

|
시장보고서
상품코드
2119216
수소 충전소 시장 : 시장 점유율 분석, 업계 동향 및 통계, 성장 예측(2026-2031년)Hydrogen Fueling Station - Market Share Analysis, Industry Trends & Statistics, Growth Forecasts (2026 - 2031) |
||||||
 Mordor Intelligence
Mordor Intelligence에 의하면, 수소 충전소 시장 규모는 2025년 18억 1,000만 달러로 평가되었고, 2026년에는 20억 1,000만 달러로 추정되고, 2031년까지 48억 9,000만 달러에 이를 것으로 예상되며, 2026-2031년 CAGR 19.46%로 성장할 전망입니다.
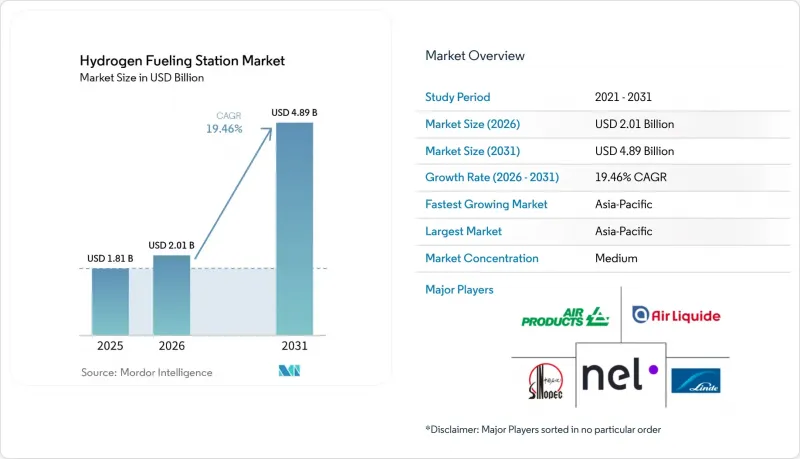
본 보고서는 충전소 유형별(고정식, 이동식), 수소 생산원별(그린 수소, 블루 수소, 그레이 수소, 기타 저탄소 수소), 최종 용도별(승용차, 상용차, 노선버스, 대형 트럭, 철도, 선박, 산업용 차량, 기타), 지역별(북미, 유럽, 아시아태평양, 남미, 중동 및 아프리카)로 분류되어 있습니다. 시장 전망은 금액(달러) 기준으로 제시되어 있습니다.
세계의 수소 충전소 시장 동향 및 인사이트
대형 화물 운송 회랑에서의 차량 함대 주도형 수소 수요
수소 충전소 시장에서 가장 강력한 수요 신호는 특정 화물 운송 회랑에서 신뢰할 수 있는 연료 공급을 필요로 하는 물류 사업자들로부터 발생하고 있습니다. 독일은 2026년 1월, TEN-T 핵심 네트워크 노선에서 최대 40곳의 수소 충전소와 400대의 연료전지 트럭을 지원하기 위해 2억 2,000만 유로 규모의 프로그램을 시작했습니다. 2026년 6월 마감일까지 이 프로그램에는 4억 5,500만 유로를 요청하는 526건의 신청이 접수되었으며, 이는 가용 자금의 2배 이상에 해당합니다. 한국에서는 서울과 부산, 서울과 광주, 인천과 충청북도를 연결하는 화물 운송 회랑이 정비되어 있습니다. 이러한 프로그램들은 차량을 특정 장소와 연계하여 충전소의 예상 처리량을 증가시키는 플릿 계약을 우선시하고 있습니다. 디포나 회랑에서 예측 가능한 수요가 있는 경우, 수소 충전소 시장은 혜택을 받게 됩니다. 왜냐하면 그러한 수요 패턴은 더 광범위한 일반 고객층이 형성되기 전에 운영 비용을 회수할 수 있게 해주기 때문입니다.
제로 배출 차량(ZEV) 의무화 및 수소 인프라 자금 지원
공공 지원은 실증 프로젝트에서 상용 수소 인프라로 전환되고 있습니다. 캘리포니아주는 GFO-25-607에 따라 2026년에 경·중대형 차량용 수소 충전 인프라에 4,500만 달러를 지원했습니다. 또한, 캘리포니아주는 ‘ZEV 인프라 청사진 2.0’ 프로그램을 통해 중대형 차량 용도로 4,000만 달러를 지원했습니다. 한국은 2025년, 연료전지차 구매 보조금으로 7,218억 원(5억 3,000만 달러 상당)을 편성하고, 수소버스의 연료 보조금을 1kg당 5,000원으로 인상했습니다. AFIR에서는 정해진 기한까지 TEN-T 핵심 네트워크 회랑 위에 일반인이 이용할 수 있는 수소 충전 거점을 설치해야 할 의무가 있습니다. 승인 지연으로 인해 프로젝트가 초기 회랑 클러스터에 포함되지 못할 가능성이 있으므로, 이러한 요건으로 인해 인허가 및 안전 거리 승인의 중요성이 더욱 커지고 있습니다. 수소 충전소 시장에서는 자금 조달이 차량 도입 및 회랑 접근성과 연계되어 있어 수요 창출 경로가 더욱 명확해지고 있습니다.
높은 자본 비용과 초기 단계의 낮은 이용률
차량 대수가 적고 연료 판매가 불확실한 상황에서는 충전소의 수익성이 여전히 어려운 상태입니다. 『International Journal of Hydrogen Energy』지에 게재된 2026년 연구에 따르면, 대형 수소 충전소의 주요 비용 요인으로 이용률과 할인율이 지목되었습니다. 이 연구에 따르면, 이용률이 낮은 이용 사례에서는 소규모 구성에서 수소의 균등화 비용이 Kg당 50유로를 초과할 가능성이 있는 것으로 밝혀졌습니다. 캘리포니아주의 이전 평가에서도 유지보수 및 수소 품질과 관련된 네트워크 가동 시간의 문제가 지적된 바 있습니다. 이러한 상황에서는 공급 중단이나 제품 품질 변동이 발생할 경우, 충전소가 더 큰 영향을 받기 쉽습니다. 독일의 프로그램에서는 충전소에 대한 자금 지원을 연료전지 트럭과 연계함으로써 이러한 위험에 대처하고 있으며, 이를 통해 운영 개시 초기부터 가동률을 향상시킬 수 있습니다. 수소 충전소 시장은 확고한 차량 함대가 형성되어 수요가 정착될 때까지 자금 조달 비용의 영향을 받기 쉬운 상태가 지속될 것으로 보입니다.
부문 분석
2025년 시점에서 고정식 충전소는 수소 충전소 시장의 91.1%를 차지했습니다. 이러한 우위는 확립된 상업 노선이나 대규모 차량 거점에서 높은 처리 능력이 요구되고 있음을 반영합니다. 고정식 시설은 차량이 반복적으로 충전할 수 있고, 개발자가 압축·저장·충전 설비 도입을 정당화할 수 있는 구간에 적합합니다. 수소 충전소 산업은 신뢰할 수 있는 네트워크 기반을 제공하기 위해 이러한 거점에 의존하고 있습니다. 이동식 충전소는 2025년 설치 용량의 8.9%를 차지했으나, 초기 차량 도입 단계에서 연료를 공급하는 별개의 역할을 수행하고 있습니다. 제공된 자료에 따르면, 2024년 말 기준 아시아태평양에는 849곳의 충전소가 있으며, 그 대부분은 중국, 한국, 일본에 집중되어 있습니다.
이동식 충전소는 2026-2031년 연평균 성장률(CAGR) 22.3%를 나타낼 것으로 예측됩니다. 초기 투자 비용이 적게 들기 때문에 개발자는 차량 함대 수요를 바탕으로 더 대규모 충전소 설치의 타당성을 검증하기 쉬워집니다. 수소 충전소 시장에서는 이러한 시설을 버스, 트럭, 항만 설비, 건설 중인 임시 용도로 활용할 수 있습니다. 또한 트레일러 탑재형 시스템은 차량 인도부터 연료를 사용할 수 있게 될 때까지의 시간을 단축합니다. 서로 다른 제조업체의 차량에 대응하기 위해서는 규격에 부합하는 충전 방식이 여전히 중요합니다. 고정식 및 이동식 자산을 조합하여 운영함으로써, 수요에 앞서 영구적인 설비를 건설할 때의 위험을 줄일 수 있습니다.
지역별 분석
아시아태평양은 2025년에 수소 충전소 시장의 45.3%를 차지한 것으로 평가되었으며, 2031년까지 연평균 성장률(CAGR) 29.7%로 성장할 것으로 전망됩니다. 중국, 한국, 일본은 계속해서 이 지역의 주요 거점으로 자리 잡고 있습니다. 한국은 차량 보조금 지원을 받아 충전소 수를 2022년 170곳에서 2025년 400곳으로 확대했습니다. 일본에서는 정부의 목표에 비해 가동 중인 충전소 네트워크가 소규모에 그치고 있어, 일반 소비자 주도의 충전 수요를 지속시키기 어려운 실정이 엿보입니다.
유럽은 두 번째로 큰 지역으로, 충전소 계획과 화물 운송 회랑을 연계하는 정책 체계가 마련되어 있습니다. 독일의 자금 조달 공모에서는 TEN-T 회랑 내 트럭과 충전소의 병행 설치를 지원하는 것을 목표로 하고 있습니다. TEAL Mobility는 2025년 말까지 유럽 5개국에서 17곳의 충전소를 운영하고 있었습니다. 유럽의 수소 충전소 시장은 로테르담의 ‘ELYgator’와 같은 대규모 공급 프로젝트로부터도 혜택을 받고 있습니다. 클라이페다 항구에서는 2026년, 선박, 트럭, 항만 운영을 위한 리투아니아 최초의 그린 수소 시설이 개장되었습니다.
북미, 남미, 중동 및 아프리카에서는 규모는 작지만 명확한 발전 경로를 엿볼 수 있습니다. 캘리포니아주의 2026년 자금 지원 계획은 여러 중량 등급에 걸친 차량용 수소 충전소에 중점을 두고 있습니다. 북미에서는 고립된 입지보다 네트워크화된 회랑 프로젝트가 실현 가능성이 더 높을 것으로 보입니다. 브라질의 수아페 항은 2030년 가동을 목표로 158억 레알(약 30억 9,000만 달러)을 투자하는 그린 수소 허브 확장 계획을 발표했으나, 남미의 수소 충전 인프라는 여전히 제한적입니다. 중동에서는 수출용 그린 수소 생산 능력을 구축하고 있지만, 국내 수소 충전은 여전히 초기 단계에 머물러 있습니다. 이 지역들은 생산 개발을 항만, 물류 센터, 초기 차량 도입 계획과 연계함으로써 이점을 얻을 수 있습니다.
기타 혜택
- 엑셀 형식 시장 예측(ME) 시트
- 3개월간의 애널리스트 지원
자주 묻는 질문
목차
제1장 서론
제2장 조사 방법
제3장 주요 요약
제4장 시장 구도
제5장 시장 규모 및 성장 예측
제6장 경쟁 구도
제7장 시장 기회 및 향후 전망
AJY 26.09.03According to Mordor Intelligence, the hydrogen fueling station market size is expected to increase from USD 1.81 billion in 2025 to USD 2.01 billion in 2026 and reach USD 4.89 billion by 2031, growing at a CAGR of 19.46% over 2026-2031.
This report is Segmented by Station Type (Fixed, Mobile), Hydrogen Production Source (Green, Blue, Gray, Other Low-Carbon), End-Use (Passenger Vehicles, Commercial Vehicles, Transit Buses, Heavy-Duty Trucks, Railways, Marine, Industrial Vehicles), and Geography (North America, Europe, Asia-Pacific, South America, and Middle East and Africa). The Market Forecasts are Provided in Terms of Value (USD).
Global Hydrogen Fueling Station Market Trends and Insights
Fleet-Led Hydrogen Demand From Heavy-Duty Freight Corridors
The strongest demand signal in the hydrogen fueling station market comes from logistics operators that need reliable fuel access on defined freight routes. Germany launched a EUR 220 million program in January 2026 to support up to 40 hydrogen stations and 400 fuel cell trucks on TEN-T core network routes. By the June 2026 deadline, the program had received 526 applications seeking EUR 455 million, more than twice the available funding. South Korea has established freight corridors between Seoul and Busan, Seoul and Gwangju, and Incheon and Chungbuk. These programs favor fleet contracts that connect vehicles to specific locations and raise expected station throughput. The hydrogen fueling station market benefits when a depot or corridor has predictable demand, because that pattern supports operating cost recovery before a broader retail customer base develops.
Zero-Emission Vehicle Mandates and Hydrogen Infrastructure Funding
Public support is moving from demonstration projects toward commercial hydrogen infrastructure. California made USD 45 million available in 2026 under GFO-25-607 for hydrogen refueling infrastructure serving light-duty, medium-duty, and heavy-duty vehicles. The state also provided USD 40 million through its ZEV Infrastructure Blueprints 2.0 program for medium-duty and heavy-duty applications. South Korea allocated KRW 721.8 billion, equivalent to USD 530 million, in 2025 for fuel cell vehicle purchase subsidies and raised the hydrogen bus fuel subsidy to KRW 5,000 per kilogram. AFIR requires publicly accessible hydrogen refueling points on TEN-T core network corridors by stated deadlines. These requirements make permitting and safety-distance approvals more important, since delayed approvals can prevent a project from joining an early corridor cluster. The hydrogen fueling station market has a clearer route to demand where funding is tied to vehicle deployment and corridor access.
High Capital Cost and Low Early Utilization
Station economics remain difficult when vehicle numbers are low, and fuel sales are uncertain. A 2026 study in the International Journal of Hydrogen Energy identified utilization and discount rate as the leading cost drivers for heavy-duty hydrogen refueling stations. The study found that low-use cases can push levelized hydrogen costs beyond EUR 50 per kilogram at smaller configurations. California's earlier assessment also documented network uptime challenges connected to maintenance and hydrogen quality. These conditions make a station more exposed when supply deliveries are disrupted or product quality varies. The German program addresses this risk by linking funding for stations with fuel cell trucks, which can improve utilization from the start. The hydrogen fueling station market will remain sensitive to financing costs until demand is anchored by committed fleets.
Other drivers and restraints analyzed in the detailed report include:
- Green Hydrogen and On-Site Electrolyzer Integration
- Station Portfolio Optimization Through Modular and Mobile Deployment
- Limited Hydrogen Supply and Distribution Networks
For complete list of drivers and restraints, kindly check the Table Of Contents.
Segment Analysis
Fixed stations held 91.1% of the hydrogen fueling station market in 2025. Their lead reflects the need for high throughput on established commercial routes and at large fleet sites. Fixed facilities are suited to corridors where vehicles can refuel repeatedly and where the developer can justify compression, storage, and dispensing equipment. The hydrogen fueling station industry relies on these sites to provide the backbone of a dependable network. Mobile formats had 8.9% of installed capacity in 2025, but they fulfill a different role by bringing fuel to early fleet deployments. Asia-Pacific had 849 stations at the end of 2024, according to the supplied source material, with a large concentration in China, South Korea, and Japan.
Mobile stations are forecast to grow at a 22.3% CAGR between 2026 and 2031. Their smaller initial commitment helps a developer test whether fleet demand justifies a larger site. The hydrogen fueling station market can use these facilities for buses, trucks, port equipment, and temporary applications during construction. Trailer-mounted systems also reduce the time between a fleet's vehicle delivery and the availability of fuel. Standard-compliant dispensing remains important for serving vehicles from different manufacturers. A mixed portfolio of fixed and mobile assets can limit the risk of building permanent capacity ahead of demand.
Complete Report Scope:
- By Station Type
- Fixed Hydrogen Fueling Stations
- Mobile Hydrogen Fueling Stations
- By Hydrogen Production Source
- Green Hydrogen
- Blue Hydrogen
- Gray Hydrogen
- Other Low-carbon Hydrogen
- By End-use
- Passenger Vehicles
- Commercial Vehicles
- Transit Buses
- Heavy-duty Trucks
- Railways
- Marine
- Industrial Vehicles (Forklifts, Mining, Ports)
- Others
- By Geography
- North America
- United States
- Canada
- Mexico
- Europe
- Germany
- France
- Italy
- Spain
- United Kingdom
- Poland
- Russia
- Rest of Europe
- Asia-Pacific
- China
- India
- Japan
- South Korea
- Australia
- Indonesia
- Vietnam
- Thailand
- Rest of Asia-Pacific
- South America
- Brazil
- Argentina
- Chile
- Rest of South America
- Middle East and Africa
- Saudi Arabia
- United Arab Emirates
- Egypt
- South Africa
- Morocco
- Rest of Middle East and Africa
- North America
Geography Analysis
Asia-Pacific held 45.3% of the hydrogen fueling station market in 2025 and is forecast to grow at a 29.7% CAGR through 2031. China, South Korea, and Japan remain the region's main deployment centers. South Korea expanded its station count from 170 in 2022 to 400 in 2025, supported by vehicle subsidies. Japan has a smaller operating network than its government target, which shows the difficulty of sustaining passenger-led refueling demand.
Europe is the second-largest region and has a policy framework that connects station planning to freight routes. Germany's funding call seeks to support combined truck and station deployment on TEN-T corridors. TEAL Mobility operated 17 stations in 5 European countries by the end of 2025. The hydrogen fueling station market in Europe also benefits from larger-scale supply projects such as ELYgator in Rotterdam. The Port of Klaipeda opened Lithuania's first green hydrogen facility in 2026 for vessels, trucks, and port operations.
North America, South America, and the Middle East and Africa have smaller positions but have identifiable development routes. California's 2026 funding focuses on hydrogen refueling for vehicles across several weight classes. In North America, networked corridor projects are more likely to be viable than isolated locations. Brazil's Suape Port has announced a BRL 15.8 billion (~USD 3.09 billion) green hydrogen hub expansion plan for 2030 commissioning, although refueling infrastructure in South America remains limited. The Middle East is building green hydrogen production capacity for export, while domestic refueling remains at an early stage. These regions can gain from linking production development with ports, logistics centers, and initial fleet commitments.
- Air Products and Chemicals, Inc.
- Atawey SAS
- Chart Industries, Inc.
- China Petroleum and Chemical Corporation
- ENEOS Corporation
- FirstElement Fuel, Inc.
- H2 MOBILITY Deutschland GmbH & Co. KG
- Hydrogen Refueling Solutions SA
- ITM Power plc
- Iwatani Corporation
- Korea Gas Corporation
- L'Air Liquide S.A.
- Linde plc
- Maximator Hydrogen GmbH
- Nel ASA
- PDC Machines, Inc.
- Plug Power Inc.
- Shell plc
- TotalEnergies SE
Additional Benefits:
- The market estimate (ME) sheet in Excel format
- 3 months of analyst support
TABLE OF CONTENTS
1 INTRODUCTION
- 1.1 Study Assumptions and Market Definition
- 1.2 Scope of the Study
2 RESEARCH METHODOLOGY
3 EXECUTIVE SUMMARY
4 MARKET LANDSCAPE
- 4.1 Market Overview
- 4.2 Market Drivers
- 4.2.1 Fleet-Led Hydrogen Demand From Heavy-Duty Freight Corridors
- 4.2.2 Zero-Emission Vehicle Mandates and Hydrogen Infrastructure Funding
- 4.2.3 Growth of Fixed-Route Bus and Depot Fleets
- 4.2.4 Green Hydrogen and On-Site Electrolyzer Integration
- 4.2.5 Port, Airport and Logistics-Hub Decarbonization
- 4.2.6 Station Portfolio Optimization Through Modular and Mobile Deployment
- 4.3 Market Restraints
- 4.3.1 High Capital Cost and Low Early Utilization
- 4.3.2 Limited Hydrogen Supply and Distribution Networks
- 4.3.3 Station Uptime Exposure to Hydrogen Quality and Delivery Reliability
- 4.3.4 Permitting, Safety-Distance and Cross-Jurisdiction Approval Friction
- 4.4 Supply-Chain Analysis
- 4.5 Technology Outlook
- 4.6 Regulatory Landscape
- 4.7 Porter's Five Forces Analysis
- 4.7.1 Bargaining Power of Suppliers
- 4.7.2 Bargaining Power of Buyers
- 4.7.3 Threat of New Entrants
- 4.7.4 Threat of Substitutes
- 4.7.5 Competitive Rivalry
5 MARKET SIZE AND GROWTH FORECASTS
- 5.1 By Station Type
- 5.1.1 Fixed Hydrogen Fueling Stations
- 5.1.2 Mobile Hydrogen Fueling Stations
- 5.2 By Hydrogen Production Source
- 5.2.1 Green Hydrogen
- 5.2.2 Blue Hydrogen
- 5.2.3 Gray Hydrogen
- 5.2.4 Other Low-carbon Hydrogen
- 5.3 By End-use
- 5.3.1 Passenger Vehicles
- 5.3.2 Commercial Vehicles
- 5.3.3 Transit Buses
- 5.3.4 Heavy-duty Trucks
- 5.3.5 Railways
- 5.3.6 Marine
- 5.3.7 Industrial Vehicles (Forklifts, Mining, Ports)
- 5.3.8 Others
- 5.4 By Geography
- 5.4.1 North America
- 5.4.1.1 United States
- 5.4.1.2 Canada
- 5.4.1.3 Mexico
- 5.4.2 Europe
- 5.4.2.1 Germany
- 5.4.2.2 France
- 5.4.2.3 Italy
- 5.4.2.4 Spain
- 5.4.2.5 United Kingdom
- 5.4.2.6 Poland
- 5.4.2.7 Russia
- 5.4.2.8 Rest of Europe
- 5.4.3 Asia-Pacific
- 5.4.3.1 China
- 5.4.3.2 India
- 5.4.3.3 Japan
- 5.4.3.4 South Korea
- 5.4.3.5 Australia
- 5.4.3.6 Indonesia
- 5.4.3.7 Vietnam
- 5.4.3.8 Thailand
- 5.4.3.9 Rest of Asia-Pacific
- 5.4.4 South America
- 5.4.4.1 Brazil
- 5.4.4.2 Argentina
- 5.4.4.3 Chile
- 5.4.4.4 Rest of South America
- 5.4.5 Middle East and Africa
- 5.4.5.1 Saudi Arabia
- 5.4.5.2 United Arab Emirates
- 5.4.5.3 Egypt
- 5.4.5.4 South Africa
- 5.4.5.5 Morocco
- 5.4.5.6 Rest of Middle East and Africa
- 5.4.1 North America
6 COMPETITIVE LANDSCAPE
- 6.1 Market Concentration
- 6.2 Strategic Moves
- 6.3 Market Share Analysis
- 6.4 Company Profiles (includes Global Level Overview, Market Level Overview, Core Segments, Financials as available, Strategic Information, Market Rank/Share, Products and Services, Recent Developments)
- 6.4.1 Air Products and Chemicals, Inc.
- 6.4.2 Atawey SAS
- 6.4.3 Chart Industries, Inc.
- 6.4.4 China Petroleum and Chemical Corporation
- 6.4.5 ENEOS Corporation
- 6.4.6 FirstElement Fuel, Inc.
- 6.4.7 H2 MOBILITY Deutschland GmbH & Co. KG
- 6.4.8 Hydrogen Refueling Solutions SA
- 6.4.9 ITM Power plc
- 6.4.10 Iwatani Corporation
- 6.4.11 Korea Gas Corporation
- 6.4.12 L'Air Liquide S.A.
- 6.4.13 Linde plc
- 6.4.14 Maximator Hydrogen GmbH
- 6.4.15 Nel ASA
- 6.4.16 PDC Machines, Inc.
- 6.4.17 Plug Power Inc.
- 6.4.18 Shell plc
- 6.4.19 TotalEnergies SE
7 MARKET OPPORTUNITIES AND FUTURE OUTLOOK
- 7.1 White-Space and Unmet-Need Assessment


