

|
시장보고서
상품코드
2119325
통신 설비투자 우선순위 추적 도구 : 시장 점유율 분석, 업계 동향 및 통계, 성장 예측(2026-2031년)Telecom Capex Prioritization Tracker - Market Share Analysis, Industry Trends & Statistics, Growth Forecasts (2026 - 2031) |
||||||
 Mordor Intelligence
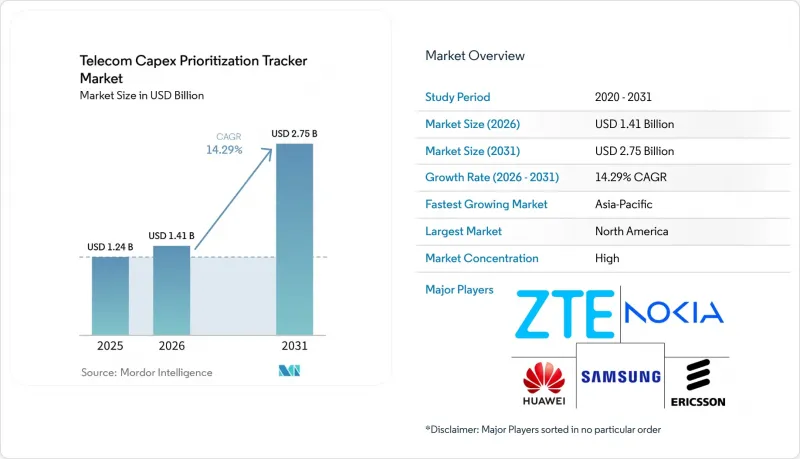
Mordor Intelligence에 의하면, 통신 설비투자 우선순위 추적 도구 시장 규모는 2025년에 12억 4,000만 달러로 평가되었습니다. 2026년 14억 1,000만 달러에서 2031년까지 27억 5,000만 달러에 이를 것으로 예상되며, 예측 기간(2026-2031년) CAGR은 14.29%를 나타낼 전망입니다.
본 보고서는 투자 범주(설치·유지보수, 무선 액세스 네트워크 장비 등), 기술(5G 네트워크 인프라, 4G LTE 네트워크 유지보수 등), 네트워크 자산 유형(유선 액세스, 무선 액세스 등), 설비 투자 자금원(모바일 네트워크 사업자 등) 및 지역별로 분류되어 있습니다. 시장 예측은 금액(달러)으로 표시되어 있습니다.
세계의 통신 설비투자 우선순위 추적 도구 시장 동향 및 인사이트
5G 독립형(SA) 및 네트워크 고밀도화
5G 비독립형(NSA)에서 독립형(SA) 아키텍처로의 전환은 통신 설비투자 우선순위 추적 도구 시장에서 자본 배분의 중요한 지표가 되고 있습니다. 2026년 3월까지 95개 통신 사업자가 5G 독립형 서비스를 상용화했으며, 이는 2025년 1분기에 비해 42% 증가한 수치입니다. 동 정보원에 따르면, 35개 통신 사업자가 5G-Advanced에 투자하고 있으며, 11개사가 상용 서비스를 개시했습니다. 이러한 프로젝트에서는 개별 무선 장비 구매가 아닌, 패킷 코어, 오케스트레이션 시스템, 전송 링크 및 무선 네트워크의 업그레이드가 필요합니다. 중국에서는 2025년 말 기준으로 483만 8,000기의 5G 기지국이 설치되었으며, 5G-Advanced의 커버리지 범위는 330개 이상의 도시로 확대되었습니다. 이에 따라 무선 계층은 이미 확장된 상태이며, X-Haul 및 코어 용량에 대한 수요가 발생하고 있습니다. 따라서 도입 현황, 소프트웨어 준비 상태, 그리고 전송상의 제약 사항이 투자 우선순위를 결정하는 데 중요한 요소가 되고 있습니다.
광대역 및 고정 무선 접속의 확대
광섬유 사업은 가정용 광대역, 모바일 백홀 및 기업용 연결을 뒷받침하기 때문에 통신 설비투자 우선순위 추적 도구 시장에서 그 비중이 높아지고 있습니다. AT&T는 2026년 3월, 2,500억 달러를 초과하는 5개년 미국 투자 계획을 발표했으며, 2026년 말까지 4,000만 곳, 2030년까지 6,000만 곳에 광섬유망을 확장하는 것을 목표로 하고 있습니다. T-Mobile은 2026년 4월, 두 개의 광섬유 합작 사업에 27억 달러를 투자하여 2026년 말까지 180만 건의 광섬유 설치를 추가하는 것을 목표로 하고 있습니다. 고정 무선 접속도 단순한 지방 지역의 대체 수단이 아닌, 광섬유를 보완하는 연계 수단으로 자리매김하고 있습니다. 광섬유 자산은 광대역 고객에게 서비스를 제공하는 것 외에도 모바일 통신 및 데이터센터의 트래픽 경로로도 기능하기 때문에 그 배분은 단순한 접속 네트워크의 단일 항목보다 더 복잡해집니다. 이러한 복합적인 용도로 인해, 통신 사업자들이 유선 통신과 무선 통신의 자본 계획을 조정하는 과정에서 통신 설비투자 우선순위 추적 도구 시장이 유지되고 있습니다.
성숙 시장에서 자본 집약도의 정상화
일부 선진 시장에서는 초기 5G 네트워크 구축이 정점을 지나, 통신 사업자들은 선별된 업그레이드 및 유지보수에 주력하는 단계에 접어들었습니다. 차이나 모바일은 2026년 설비 투자로 1366억 위안(189억 달러)을 계획하고 있으며, 이는 전년 대비 9.5% 감소한 수치입니다. 이 회사의 컴퓨팅 역량에 대한 투자는 62.4% 증가한 378억 위안(56억 달러)을 기록한 반면, 통신 네트워크에 대한 투자는 20.3% 감소했습니다. 도이치 텔레콤은 2025년에 네트워크 인프라에 169억 유로(183억 달러)를 투자했습니다. 이는 지속적인 노력을 보여주는 동시에, 유지보수 및 업그레이드 추세가 성숙기에 접어들었음을 시사합니다. 이러한 변화로 인해 컴퓨팅 및 클라우드 관련 프로젝트가 기존 통신 네트워크 예산과 밀접하게 얽혀 있어 지출 항목을 비교하기가 어려워졌습니다. 통신 설비투자 우선순위 추적 도구 시장에서는 설비 투자 총액의 감소가 모든 네트워크 자산에 대한 수요 감소를 반영한다고 가정하지 말고, 이러한 용도를 명확히 구분해야 합니다.
부문 분석
2025년, 무선 액세스 네트워크 장비는 통신 설비투자 우선순위 추적 도구 시장 점유율의 38.24%를 차지했습니다. 이러한 상황은 도시, 교외 및 기업 거점에서의 커버리지 깊이와 용량을 확보하기 위해 미드밴드 5G가 계속해서 활용되고 있음을 반영합니다. 이러한 구매에는 일반적으로 무선 장치, 사이트 통합, 주파수 대역별 최적화 소프트웨어, 그리고 통신 설비투자 우선순위 추적 도구 시장에서 수년에 걸친 공급업체 계약이 포함됩니다. 코어 네트워크 인프라도 중요한 역할을 합니다. 이는 5G 독립형(SA)으로의 전환에는 무선 관련 작업 외에도 패킷 코어 및 오케스트레이션 업그레이드가 필요하기 때문입니다. 통신 사업자들이 3G 및 구리선 자산을 폐지하고, 더 이상 운영할 수 없는 장비를 교체함에 따라 설치 및 유지보수 작업이 지속적인 수요를 창출하고 있습니다.
광섬유 및 고정 광대역 인프라는 2026년부터 2031년까지 연평균 성장률(CAGR) 15.47%를 나타낼 것으로 예측되며, 이는 해당 부문에서 가장 높은 성장률입니다. ‘Fiber-to-the-Premises(FTTP)’ 프로그램은 북미, 아시아태평양 및 유럽 전역의 지방 도시와 농촌 지역으로 확대되고 있습니다. 광대역용 광섬유 회선은 데이터센터 고객을 위한 다크 파이버 경로로도 기능하여, 동일한 물리적 자산을 통해 별도의 수익원을 창출할 수 있습니다. 노키아는 최대 400 Tbps를 지원하도록 설계된 노스다코타주의 AI 최적화 광전송 경로에 참여하여 주요 데이터센터 개발 지역과 시카고 대도시권을 연결했습니다. ‘기타’ 범주에는 Open RAN 소프트웨어, 위성 백홀 통합 및 사설 5G 장비가 포함되어 있으며, 도입이 진행됨에 따라 별도의 추적이 필요할 수 있습니다.
2025년 기술별 지출에서 5G 네트워크 인프라가 차지하는 비중은 42.13%였습니다. 이 비중은 신흥국의 통신망 구축이 미흡한 점과 선진국의 5G 독립형(SA)으로의 업그레이드 주기를 반영하고 있습니다. 두 이용 사례 모두 근본적인 투자 이유는 다르지만, 5G를 주요 예산 항목으로 유지하고 있습니다. 통신 사업자는 독립형 서비스를 효과적으로 제공하기 위해 무선, 코어 및 전송 각 구성 요소가 필요합니다. 5G-Advanced의 개발로 인해 통신 설비투자 우선순위 추적 도구 시장에서 소프트웨어 및 네트워크 제어 요구 사항이 더욱 추가되고 있습니다.
FTTP(Fiber-to-the-Premises)는 2026년부터 2031년까지 연평균 성장률(CAGR) 16.27%로 확대될 것으로 예측됩니다. T-Mobile의 27억 달러 규모의 합작 투자 및 AT&T가 계획하고 있는 광섬유망 구축은 미국 내 현재 광섬유 투자 규모를 보여줍니다. 5G 통신 범위가 불충분한 지역이나 확립된 신뢰성이 요구되는 사설 네트워크 용도에서는 여전히 4G LTE의 유지 관리가 필요합니다. 425억 달러 규모의 BEAD 프로그램은 광대역 장비의 민관 조달 파이프라인을 지원하고 있습니다. 그 밖의 기술로는 위성 백홀 및 Open RAN 등이 있으며, 2031년까지의 기술 구성은 상용화 속도에 따라 형성될 전망입니다.
지역별 분석
2025년, 북미는 통신 설비투자 우선순위 추적 도구 시장 점유율의 31.24%를 차지했습니다. AT&T의 5개년 미국 투자 계획은 2,500억 달러를 초과하며, 광섬유, 5G 가정용 인터넷, FirstNet, 위성 통신을 포괄합니다. Verizon의 Frontier 인수 완료로 인해, 이 회사의 광섬유 사업은 15개 주에서 31개 주 및 워싱턴 D.C.로 확대되었습니다. BEAD 프로그램은 상업적 구축 일정에 425억 달러의 공공 광대역 자금을 추가합니다.
아시아태평양은 2026년부터 2031년까지 15.83%라는 지역별 최고 연평균 성장률(CAGR)을 달성할 것으로 예측됩니다. 차이나 모바일은 2026년 자본 지출로 1,366억 위안(189억 달러)을 계획하고 있으며, 컴퓨팅 파워 네트워크 예산을 378억 위안(56억 달러)으로 증액했습니다. 차이나 유니콤은 2026 회계연도 설비 투자로 500억 위안(69억 달러)을 계획하고 있으며, 그중 35% 이상이 컴퓨팅 역량에 배정되어 있습니다. 릴라이언스 지오는 2026 회계연도에 152억 달러를 투자했으며, 고정 광대역 가입자 수는 2,710만 명에 달했습니다. NTT 도코모는 2025 회계연도 설비 투자액을 8,575억 엔(57억 달러)으로 유지하며, 5G 확대와 AI를 활용한 네트워크 관리에 투입했습니다.
2025년 유럽의 네트워크 인프라 총 투자액은 169억 유로(183억 달러)에 달했으며, 독일에서는 도이체 텔레콤이 59억 유로(64억 달러)를 투자했습니다. 버진 미디어 O2는 2026년 모바일 투자에 7억 파운드(8억 9,500만 달러)를 투입하기로 결정했습니다. 중동은 자본 집약적인 지역으로, 모빌리는 2025 회계연도 설비 투자액으로 58억 3,000만 사우디아라비아 리얄(15억 5,000만 달러)을 보고했으며, 61개 도시에 7,600곳 이상의 5G 기지국을 구축하고 있습니다. 아프리카의 성장은 광섬유 및 모바일 분야에 대한 투자에 힘입고 있으며, 그 일례로 남아프리카공화국의 Telkom이 2026 회계연도에 64억 3,000만 랜드(3억 5,000만 달러 상당)를 설비 투자할 예정이라는 점을 들 수 있습니다. 남미에서는 유선 광대역 및 광통신 소프트웨어에 대한 투자가 더욱 주도적인 역할을 하고 있으며, 그 예로 Cirion이 Ciena 및 Carma와 공동으로 전개하는 ‘네트워크-어즈-어-서비스(Naas)’를 들 수 있습니다.
기타 혜택 :
- 엑셀 형식 시장 예측(ME) 시트
- 3개월간의 애널리스트 지원
자주 묻는 질문
목차
제1장 서론
제2장 조사 방법
제3장 주요 요약
제4장 시장 구도
제5장 시장 규모 및 성장 예측
제6장 경쟁 구도
제7장 시장 기회 및 향후 전망
KTH 26.09.10According to Mordor Intelligence, the telecom capex prioritization tracker market size was valued at USD 1.24 billion in 2025 and estimated to grow from USD 1.41 billion in 2026 to reach USD 2.75 billion by 2031, at a CAGR of 14.29% during the forecast period (2026-2031).
This report is Segmented by Investment Category (Installation and Maintenance, Radio Access Network Equipment, and More), Technology (5G Network Infrastructure, 4G LTE Network Maintenance, and More), Network Asset Type (Wireline Access, Wireless Access, and More), Capex Source (Mobile Network Operators, and More), and Geography. The Market Forecasts are Provided in Terms of Value (USD).
Global Telecom Capex Prioritization Tracker Market Trends and Insights
5G Standalone and Network Densification
The transition from 5G Non-Standalone to Standalone architecture is a central capital allocation signal for the Telecom Capex Prioritization Tracker Market. By March 2026, 95 operators had commercially launched 5G Standalone services, 42% more than in the first quarter of 2025. The same source reported that 35 operators were investing in 5G-Advanced and 11 had launched commercial services. These projects require upgrades to packet cores, orchestration systems, transport links, and radio networks rather than isolated radio equipment purchases. China had 4.838 million 5G base stations at the end of 2025, and 5G-Advanced coverage had expanded to more than 330 cities, creating a need for X-Haul and core capacity, even as the radio layer has already grown. This makes deployment status, software readiness, and transport constraints important inputs for spending priorities.
Fiber Broadband and Fixed Wireless Access Expansion
Fiber programs are becoming a larger part of the Telecom Capex Prioritization Tracker Market because they support residential broadband, mobile backhaul, and enterprise connectivity. AT&T announced a five-year U.S. investment plan exceeding USD 250 billion in March 2026, with fiber expansion toward 40 million locations by the end of 2026 and 60 million by 2030. T-Mobile committed USD 2.7 billion to 2 fiber joint ventures in April 2026, targeting 1.8 million additional fiber passings by the end of 2026. Fixed wireless access is also becoming a coordinated complement to fiber rather than only a rural alternative. Fiber assets can serve broadband customers and provide routes for mobile and data-center traffic, which makes their allocation more complex than a single access-network line item. These combined uses sustain the Telecom Capex Prioritization Tracker Market as operators coordinate fixed and wireless capital plans.
Mature-Market Capital-Intensity Normalization
Initial 5G buildouts have passed their peak in several advanced markets, leaving operators to focus on selected upgrades and maintenance. China Mobile planned CNY 136.6 billion (USD 18.9 billion) in capital expenditure for 2026, 9.5% lower than the prior year. Its computing power investment grew 62.4% to CNY 37.8 billion (USD 5.6 billion), while communications network investment declined by 20.3%. Deutsche Telekom invested EUR 16.9 billion (USD 18.3 billion) in network infrastructure in 2025, indicating an ongoing commitment but a mature maintenance and upgrade profile. This shift makes it harder to compare spending categories because compute and cloud projects sit close to conventional telecommunications network budgets. The Telecom Capex Prioritization Tracker Market needs to separate these uses without assuming that lower total equipment spending reflects lower demand for every network asset.
Other drivers and restraints analyzed in the detailed report include:
- AI Data-Center Interconnect and Cloud-Native Network Investment
- Public-Sector Connectivity and Digital-Sovereignty Programs
- Vendor Inventory Correction and Uneven 5G Monetization
For complete list of drivers and restraints, kindly check the Table Of Contents.
Segment Analysis
Radio access network equipment held 38.24% of the Telecom Capex Prioritization Tracker Market share in 2025. Its position reflects the continued use of mid-band 5G for coverage depth and capacity in urban, suburban, and enterprise locations. These purchases commonly include radio units, site integration, spectrum-specific optimization software, and multi-year vendor commitments within the Telecom Capex Prioritization Tracker Market. Core network infrastructure is also important because a 5G Standalone transition needs packet-core and orchestration upgrades alongside radio work. Installation and maintenance create a recurring demand stream as operators retire 3G and copper assets and replace equipment that cannot remain in service.
Fiber and fixed broadband infrastructure are forecast to register a 15.47% CAGR from 2026 to 2031, the highest rate in this segmentation. Fiber-to-the-premises programs are extending into secondary cities and rural areas across North America, Asia-Pacific, and Europe. A broadband fiber route can also serve as a dark-fiber path for data-center customers, creating separate revenue uses for the same physical asset. Nokia participated in an AI-optimized optical transport route in North Dakota designed for up to 400 Tbps, linking a major data-center development with the Chicago metropolitan area. The others category includes Open RAN software, satellite backhaul integration, and private 5G equipment, which may require separate tracking as adoption increases.
5G network infrastructure accounted for 42.13% of spending by technology in 2025. The share reflects incomplete coverage programs in emerging economies and the 5G Standalone upgrade cycle in advanced economies. Both use cases maintain 5G as the leading budget line, although their underlying investment reasons differ. Operators need radio, core, and transport components to deliver Standalone services effectively. The development of 5G-Advanced adds another layer of software and network-control requirements for the Telecom Capex Prioritization Tracker Market.
Fiber-to-the-premises is projected to expand at a 16.27% CAGR from 2026 to 2031. T-Mobile's USD 2.7 billion joint-venture commitment and AT&T's planned fiber build show the scale of current fiber investment in the United States. 4G LTE maintenance remains necessary where 5G coverage is incomplete and in private-network applications that favor established reliability. The USD 42.5 billion BEAD program supports a public and private procurement pipeline for broadband equipment. Other technologies include satellite backhaul and Open RAN, with the pace of commercial deployment shaping the technology mix through 2031.
Complete Report Scope:
- By Investment Category
- Installation and Maintenance
- Radio Access Network Equipment
- Core Network Infrastructure
- Fiber and Fixed Broadband Infrastructure
- Other Investment Categories
- By Technology
- 5G Network Infrastructure
- 4G LTE Network Maintenance
- Fiber-to-the-Premises
- Other Technologies
- By Network Asset Type
- Wireline Access
- Wireless Access
- Wireless X-Haul and Packet Core
- Transport Networks
- Other Network Asset Types
- By Capex Source
- Mobile Network Operators
- Fixed Broadband Operators
- Infracos and Tower Companies
- Other Capex Sources
- By Geography
- North America
- United States
- Canada
- Mexico
- South America
- Brazil
- Argentina
- Chile
- Rest of South America
- Europe
- Germany
- United Kingdom
- France
- Italy
- Spain
- Rest of Europe
- Asia-Pacific
- China
- Japan
- India
- South Korea
- Australia
- Rest of Asia-Pacific
- Middle East
- United Arab Emirates
- Saudi Arabia
- Qatar
- Rest of Middle East
- Africa
- South Africa
- Egypt
- Nigeria
- Rest of Africa
- North America
Geography Analysis
North America held 31.24% of the Telecom Capex Prioritization Tracker Market share in 2025. AT&T's five-year U.S. investment plan exceeded USD 250 billion and covered fiber, 5G home internet, FirstNet, and satellite connectivity. Verizon's completed acquisition of Frontier expanded its fiber operations from 15 to 31 states and Washington, D.C. The BEAD program adds USD 42.5 billion in public broadband funding to commercial build schedules.
Asia-Pacific is forecast to achieve the fastest regional CAGR, at 15.83%, from 2026 to 2031. China Mobile planned CNY 136.6 billion (USD 18.9 billion) in capital expenditure for 2026 and increased its computing-power network budget to CNY 37.8 billion (USD 5.6 billion). China Unicom planned CNY 50 billion (USD 6.9 billion) in capital expenditure for 2026, with more than 35% allocated to computing power. Reliance Jio invested USD 15.2 billion in fiscal year 2026 and had 27.1 million fixed broadband subscribers. NTT DOCOMO maintained JPY 857.5 billion (USD 5.7 billion) in fiscal year 2025 capital expenditure for 5G expansion and AI-enabled network management.
Europe's 2025 network infrastructure investment totaled EUR 16.9 billion (USD 18.3 billion), with Deutsche Telekom contributing EUR 5.9 billion (USD 6.4 billion) in Germany. Virgin Media O2 committed GBP 700 million (USD 895 million) to mobile investment in 2026. The Middle East is a capital-intensive region, with Mobily reporting SAR 5.83 billion (USD 1.55 billion) in 2025 capital expenditure and more than 7,600 5G sites across 61 cities. Africa's growth is supported by fiber and mobile investment, including Telkom South Africa's ZAR 6.43 billion, equivalent to USD 350 million, capital expenditure in fiscal year 2026. South America is led more by fixed broadband and optical software investment, including Cirion's network-as-a-service deployment with Ciena and Carma.
- Huawei Technologies Co., Ltd.
- Nokia Corporation
- Telefonaktiebolaget LM Ericsson
- ZTE Corporation
- Cisco Systems, Inc.
- Ciena Corporation
- Juniper Networks, Inc.
- CommScope Holding Company, Inc.
- ADTRAN Holdings, Inc.
- Fujitsu Limited
- NEC Corporation
- Samsung Electronics Co., Ltd.
- Mavenir Systems, Inc.
- Airspan Networks Holdings Inc.
- Parallel Wireless, Inc.
- Calix, Inc.
- Cambium Networks Corporation
- Ubiquiti Inc.
- Tejas Networks Limited
- HFCL Limited
- Ceragon Networks Ltd.
- Aviat Networks, Inc.
- Ekinops S.A.
- Ribbon Communications Inc.
Additional Benefits:
- The market estimate (ME) sheet in Excel format
- 3 months of analyst support
TABLE OF CONTENTS
1 INTRODUCTION
- 1.1 Study Assumptions and Market Definition
- 1.2 Scope of the Study
2 RESEARCH METHODOLOGY
3 EXECUTIVE SUMMARY
4 MARKET LANDSCAPE
- 4.1 Market Overview
- 4.2 Market Drivers
- 4.2.1 5G Standalone and Network Densification
- 4.2.2 Fiber Broadband and Fixed Wireless Access Expansion
- 4.2.3 AI Data-Center Interconnect and Cloud-Native Network Investment
- 4.2.4 Public-Sector Connectivity and Digital-Sovereignty Programs
- 4.2.5 6G Research and Pre-Commercial Infrastructure Commitments
- 4.2.6 Energy-Efficient Network Modernization and Automation
- 4.3 Market Restraints
- 4.3.1 Mature-Market Capital-Intensity Normalization
- 4.3.2 Vendor Inventory Correction and Uneven 5G Monetization
- 4.3.3 Multi-Year Procurement Locks Reduce Tracker Responsiveness
- 4.3.4 Power, Site, and Backhaul Readiness Gaps Delay Deployment
- 4.4 Impact of Macroeconomic Factors on the Market
- 4.5 Industry Value-Chain Analysis
- 4.6 Technology Outlook
- 4.7 Regulatory Landscape
- 4.8 Porter's Five Forces Analysis
- 4.8.1 Threat of New Entrants
- 4.8.2 Bargaining Power of Suppliers
- 4.8.3 Bargaining Power of Buyers
- 4.8.4 Threat of Substitutes
- 4.8.5 Intensity of Competitive Rivalry
5 MARKET SIZE AND GROWTH FORECASTS (VALUE)
- 5.1 By Investment Category
- 5.1.1 Installation and Maintenance
- 5.1.2 Radio Access Network Equipment
- 5.1.3 Core Network Infrastructure
- 5.1.4 Fiber and Fixed Broadband Infrastructure
- 5.1.5 Other Investment Categories
- 5.2 By Technology
- 5.2.1 5G Network Infrastructure
- 5.2.2 4G LTE Network Maintenance
- 5.2.3 Fiber-to-the-Premises
- 5.2.4 Other Technologies
- 5.3 By Network Asset Type
- 5.3.1 Wireline Access
- 5.3.2 Wireless Access
- 5.3.3 Wireless X-Haul and Packet Core
- 5.3.4 Transport Networks
- 5.3.5 Other Network Asset Types
- 5.4 By Capex Source
- 5.4.1 Mobile Network Operators
- 5.4.2 Fixed Broadband Operators
- 5.4.3 Infracos and Tower Companies
- 5.4.4 Other Capex Sources
- 5.5 By Geography
- 5.5.1 North America
- 5.5.1.1 United States
- 5.5.1.2 Canada
- 5.5.1.3 Mexico
- 5.5.2 South America
- 5.5.2.1 Brazil
- 5.5.2.2 Argentina
- 5.5.2.3 Chile
- 5.5.2.4 Rest of South America
- 5.5.3 Europe
- 5.5.3.1 Germany
- 5.5.3.2 United Kingdom
- 5.5.3.3 France
- 5.5.3.4 Italy
- 5.5.3.5 Spain
- 5.5.3.6 Rest of Europe
- 5.5.4 Asia-Pacific
- 5.5.4.1 China
- 5.5.4.2 Japan
- 5.5.4.3 India
- 5.5.4.4 South Korea
- 5.5.4.5 Australia
- 5.5.4.6 Rest of Asia-Pacific
- 5.5.5 Middle East
- 5.5.5.1 United Arab Emirates
- 5.5.5.2 Saudi Arabia
- 5.5.5.3 Qatar
- 5.5.5.4 Rest of Middle East
- 5.5.6 Africa
- 5.5.6.1 South Africa
- 5.5.6.2 Egypt
- 5.5.6.3 Nigeria
- 5.5.6.4 Rest of Africa
- 5.5.1 North America
6 COMPETITIVE LANDSCAPE
- 6.1 Market Concentration
- 6.2 Strategic Moves
- 6.3 Market Share Analysis
- 6.4 Company Profiles (includes Global Level Overview, Market Level Overview, Core Segments, Financials as available, Strategic Information, Market Rank/Share, Products and Services, Recent Developments)
- 6.4.1 Huawei Technologies Co., Ltd.
- 6.4.2 Nokia Corporation
- 6.4.3 Telefonaktiebolaget LM Ericsson
- 6.4.4 ZTE Corporation
- 6.4.5 Cisco Systems, Inc.
- 6.4.6 Ciena Corporation
- 6.4.7 Juniper Networks, Inc.
- 6.4.8 CommScope Holding Company, Inc.
- 6.4.9 ADTRAN Holdings, Inc.
- 6.4.10 Fujitsu Limited
- 6.4.11 NEC Corporation
- 6.4.12 Samsung Electronics Co., Ltd.
- 6.4.13 Mavenir Systems, Inc.
- 6.4.14 Airspan Networks Holdings Inc.
- 6.4.15 Parallel Wireless, Inc.
- 6.4.16 Calix, Inc.
- 6.4.17 Cambium Networks Corporation
- 6.4.18 Ubiquiti Inc.
- 6.4.19 Tejas Networks Limited
- 6.4.20 HFCL Limited
- 6.4.21 Ceragon Networks Ltd.
- 6.4.22 Aviat Networks, Inc.
- 6.4.23 Ekinops S.A.
- 6.4.24 Ribbon Communications Inc.
7 MARKET OPPORTUNITIES AND FUTURE OUTLOOK
- 7.1 White-Space and Unmet-Need Assessment


