

|
시장보고서
상품코드
2119341
네트워크 클라우드 비용 최적화 : 시장 점유율 분석, 업계 동향 및 통계, 성장 예측(2026-2031년)Network Cloud Cost Optimization - Market Share Analysis, Industry Trends & Statistics, Growth Forecasts (2026 - 2031) |
||||||
 Mordor Intelligence
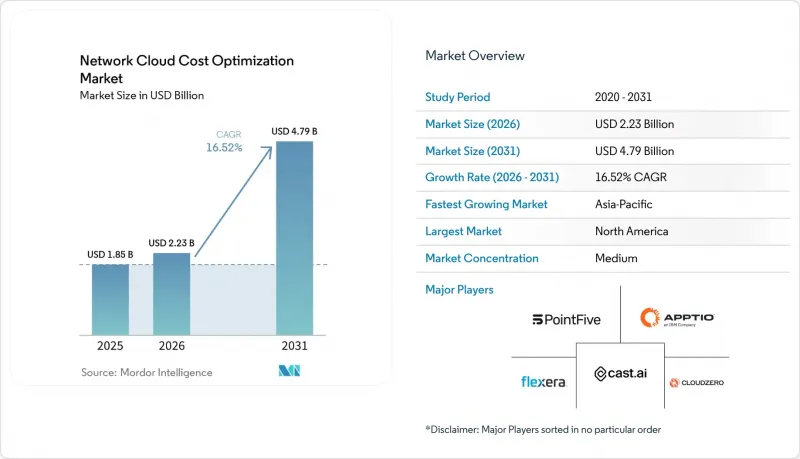
Mordor Intelligence에 의하면, 네트워크 클라우드 비용 최적화 시장 규모는 2025년에 18억 5,000만 달러로 평가되었습니다. 2026년 22억 3,000만 달러에서 2031년까지 47억 9,000만 달러에 이를 것으로 예상되며, 예측 기간(2026-2031년) CAGR은 16.52%를 나타낼 전망입니다.
본 보고서는 구성 요소(솔루션 및 서비스), 도입 형태(클라우드 및 On-Premise), 조직 규모(대기업 및 중소기업), 용도(클라우드 리소스 최적화 등), 최종 사용자(정보기술·통신, 소매 및 전자상거래 등), 그리고 지역별로 분류되어 있습니다. 시장 예측은 금액(달러) 기준으로 제시되어 있습니다.
세계의 네트워크 클라우드 비용 최적화 시장 동향 및 인사이트
멀티클라우드 및 하이브리드 클라우드 비용의 복잡성
조직은 여러 클라우드 환경을 이용하고 있어, 리소스 및 데이터 전송 비용에 대한 책임 소재를 파악하기 어려워지고 있습니다. Flexera의 보고서에 따르면, 2026년에는 조사 대상 기업의 73%가 하이브리드 환경을 운영하고 있었습니다. 인수합병, 구매의 분산화, 그리고 SaaS(Software-as-a-Service) 이용 확대에 따라 이러한 환경에는 계정, 청구 형식, 태그가 지정되지 않은 리소스가 추가될 가능성이 있습니다. 따라서 클라우드 팀은 여러 공급자에 걸친 사용 현황, 약정량 및 트래픽 비용을 통합적으로 파악해야 합니다. 개별 공급업체의 대시보드만으로는 크로스 클라우드 비용 배분을 완전히 처리할 수 없기 때문에 네트워크 클라우드·비용 최적화 시장은 이러한 수요로부터 혜택을 보고 있습니다. 또한, 유럽의 스위칭 규제로 인해 조직이 벤더 옵션을 비교할 때 데이터 전송의 경제성이 더욱 중요시되고 있습니다.
AI 및 데이터 집약적 네트워크 워크로드의 확대
AI 워크로드는 고가의 GPU, 대규모 데이터 세트 및 대량의 데이터 전송을 필요로 할 수 있어 클라우드 예산에 추가적인 부담을 주고 있습니다. CAST AI의 조사에 따르면, 2026년에 분석된 프로덕션 환경의 Kubernetes 배포 환경에서 CPU 사용률은 평균 8%였습니다. 같은 분석에서 GPU 사용률이 5%였던 것으로도 보고되어, 고가의 리소스가 충분히 활용되지 못하고 있을 가능성이 있음을 시사합니다. FinOps Foundation의 보고서에 따르면, 2026년에는 응답자의 98%가 AI 지출을 관리하고 있었던 반면, 2025년에는 63%에 그쳤습니다. 네트워크 클라우드 비용 최적화 시장에서는 GPU 사용 현황을 측정하고, AI 지출을 배분하며, 데이터 전송 요금을 파악하는 도구가 제공되기 시작했습니다. 추론 비용 및 인프라 비용을 제품, 고객, 사업 부문별로 할당할 수 있는 플랫폼에 대한 수요가 증가하고 있습니다.
인증받은 FinOps 및 클라우드 네트워킹 인력 부족
클라우드 과금과 네트워크 운영 양쪽에 정통한 인재 부족은 네트워크에 초점을 맞춘 비용 관리 도구의 도입을 지연시킬 가능성이 있습니다. FinOps Foundation의 조사에 따르면, 연간 클라우드 지출이 1억 달러를 초과하는 기업에서는 2026년 시점에서 평균 8-10명의 FinOps 실무자가 재직하고 있었습니다. 이러한 팀은 비용 배분, 보고서 작성, 약정 관리, 엔지니어링 부서와의 협업은 물론, 점점 더 중요해지고 있는 AI 관련 지출 관리까지 담당해야 합니다. 확립된 FinOps 실천 체계를 갖추지 못한 조직에서는 결과를 해석하거나 효과적인 정책을 수립하기 어려울 수 있습니다. Bitkom의 조사에 따르면, 2025년 시점에서 독일의 클라우드 이용 기업 중 64%가 클라우드 운영 비용 증가를 보고했습니다. 매니지드 서비스는 이러한 격차를 메울 수 있지만, 구매 측에는 여전히 비용 및 용도 관련 의사 결정에 대한 내부적 설명 책임이 요구됩니다.
부문별 분석
2025년에는 솔루션이 구성 요소별 매출의 65.15%를 차지했습니다. 이는 복잡한 클라우드 환경 전반에서 활용되는 가시화, 최적화, 트래픽 분석 및 계획 수립 도구의 도입 기반에 힘입은 결과입니다. 구매자가 재무, 엔지니어링, 운영 팀 전반에 걸쳐 권장 사항을 적용할 수 있도록 지원을 요청함에 따라, 서비스 부문은 2031년까지 연평균 성장률(CAGR) 18.46%를 나타낼 것으로 예측됩니다. 매니지드 FinOps, 컨설팅, 구현 및 지원은 조직이 청구 데이터를 지속적인 운영상의 변화로 전환하고, 이러한 변화에 대한 명확한 책임 체계를 확립하는 데 도움이 됩니다. 대시보드를 조기에 도입한 기업들은 커밋먼트 관리, 태깅 관행, 사업부별 배분, 정기적인 보고서 작성 루틴에 대한 지원을 점점 더 필요로 하고 있습니다. 이러한 변화는 소프트웨어와 전문 서비스를 결합하면서 각 고객의 운영 모델에 맞추어 서비스를 조정할 수 있는 벤더에게 유리하게 작용합니다.
네트워크 클라우드 비용 최적화 업계는 도구 도입 단계에서 지속적인 실행 및 거버넌스 단계로 전환되고 있습니다. IBM의 Apptio 사업부는 2026년 6월, 하이브리드 IT 비용 관리 및 클라우드 최적화 기능을 갖춘 ‘Conversational Insights’를 출시했습니다. 이 제품은 Apptio의 ‘Financial Intelligence Layer’를 통해 비용, 사용 현황, 가치 및 조치를 연결합니다. 또한 FOCUS의 도입도 서비스 선정에 영향을 미칠 가능성이 있습니다. 이는 기업들이 여러 공급자를 아우르며 활용할 수 있는 표준화된 클라우드 비용 데이터 지원을 요구하고 있기 때문입니다. 벤더가 통합 소프트웨어와 책임 있는 서비스 제공, 그리고 측정 가능한 후속 조치를 결합함으로써 네트워크 클라우드 비용 최적화 시장은 혜택을 볼 수 있습니다.
2025년 네트워크 클라우드 비용 최적화 시장에서 클라우드 배포가 71.56%를 차지했으며, 이는 이미 퍼블릭 클라우드 환경에서 운영 중인 워크로드의 비중이 크다는 점을 반영합니다. On-Premise 배포는 2031년까지 연평균 성장률(CAGR) 18.32%를 나타낼 것으로 예측됩니다. 클라우드를 통한 제공은 설정 부담을 줄이고, 여러 계정 간의 연결을 간소화하며, 분산된 팀에 일관된 경험을 제공할 수 있습니다. 또한 팀은 제품 업데이트, 관리형 기능, 공급자와의 통합에 신속하게 접근할 수 있게 됩니다. 이러한 이점 덕분에 외부에서 호스팅되는 소프트웨어를 이용할 수 있는 조직에게 클라우드 배포는 주요 모델로서의 위상을 유지하고 있습니다.
일부 조직에서는 청구 데이터나 운영 데이터를 외부 SaaS 환경으로 내보낼 수 없기 때문에 On-Premise 사용이 증가하고 있습니다. 금융 서비스, 공공 부문 및 국방 관련 조직에서는 텔레메트리 및 액세스에 대한 보다 엄격한 관리가 요구되므로 프라이빗 클라우드나 소버린 클라우드 인프라를 운영하는 경우가 있습니다. 하이브리드 환경에서는 별도의 비용 거버넌스 프로세스를 구축하지 않고도 퍼블릭 환경과 프라이빗 환경 모두에서 작동하는 도구에 대한 수요가 증가하고 있습니다. Flexera의 보고서에 따르면, 2026년에는 조사 대상 기업의 73%가 하이브리드 환경을 운영하고 있었습니다. 네트워크 클라우드 비용 최적화 시장은 호스팅형과 고객 관리형 모두의 도입 형태를 지원해야 합니다.
지역별 분석
북미는 대규모 클라우드 사용자가 집중되어 있고 FinOps 관행이 성숙한 점을 배경으로, 2025년 네트워크 클라우드 비용 최적화 시장에서 37.45%의 점유율을 차지했습니다. Flexera의 보고서에 따르면, 2026년에는 미국 대기업의 76%가 클라우드 서비스에 매달 500만 달러 이상을 지출하고 있었습니다. 이 지역에는 최적화 벤더와 클라우드 플랫폼 사용자가 밀집해 있으며, AI 인프라에 대한 지출이 세밀한 비용 배분과 네트워크 이그레스 제어에 대한 수요를 높이고 있습니다. 캐나다에서는 금융 서비스 업계의 도입이 수요를 뒷받침하고 있으며, 멕시코에서는 클라우드 이용 확대에 따라 비용 거버넌스에 대한 수요가 초기 단계에서 형성되고 있습니다.
유럽에서는 규정 준수 요건과 지역별 데이터 보관 장소 선택이 시장을 형성하고 있습니다. ‘데이터법(Data Act)’은 데이터 처리 서비스 간 전환을 가능하게 하는 조건을 마련하고 있으며, 클라우드 의사결정에서 이식성과 전송 비용이 중요한 요소로 대두되고 있습니다. 한편, Bitkom의 조사에 따르면 독일의 클라우드 이용 기업 중 64%가 2025년에 운영 비용 상승을 보고했으며, 54%는 2026년에 추가 상승을 예상하고 있습니다. 독일, 프랑스, 영국, 이탈리아, 스페인은 중요한 도입 시장이지만, 러시아에서는 주요 하이퍼스케일러의 인프라 접근에 영향을 미치는 지정학적 요인으로 인해 활동이 제약받고 있습니다. 네트워크 클라우드 비용 최적화 시장에서는 비용 배분뿐만 아니라 지역별 거버넌스 요건에도 대응해야 합니다.
아시아태평양에서는 기업의 퍼블릭 클라우드 도입이 급속히 진행되고 있으며, FinOps 실천이 정착됨에 따라 2031년까지 연평균 성장률(CAGR) 18.51%를 나타낼 것으로 예측됩니다. CAST AI는 2026년 6월 뭄바이 리전을 출범시켜 현지 지원과 세계 리전과 동등한 기능을 제공합니다. 인도는 엔터프라이즈용 클라우드 최적화 분야에서 수요가 확대되고 있는 지역입니다. 일본과 한국은 재무 거버넌스 실천과 복잡한 쿠버네티스(Kubernetes) 환경이 공식 프로그램을 뒷받침하고 있어 고부가가치 기회를 제공합니다. 남미는 브라질과 아르헨티나를 중심으로 발전하고 있는 반면, 중동 및 아프리카는 클라우드 인프라 확대 및 디지털화 프로그램과 연계되어 여전히 초기 단계에 있는 지역입니다. 네트워크 클라우드 비용 최적화 시장에는 비용 관리 성숙도보다 클라우드 투자 증가 속도가 빠른 지역에서 성장 여지가 있습니다.
기타 혜택 :
- 엑셀 형식 시장 예측(ME) 시트
- 3개월간의 애널리스트 지원
자주 묻는 질문
목차
제1장 서론
제2장 조사 방법
제3장 개요
제4장 시장 구도
제5장 시장 규모 및 성장 예측
제6장 경쟁 구도
제7장 시장 기회 및 향후 전망
KTH 26.09.02According to Mordor Intelligence, the network cloud cost optimization market size was valued at USD 1.85 billion in 2025 and is estimated to grow from USD 2.23 billion in 2026 to reach USD 4.79 billion by 2031, at a CAGR of 16.52% during the forecast period (2026-2031).
This report is Segmented by Component (Solutions, and Services), Deployment Mode (Cloud, and On Premise), Organization Size (Large Enterprises, and Small and Medium Enterprises), Application (Cloud Resource Rightsizing, and More), End-User (Information Technology and Telecommunications, Retail and E-Commerce, and More), and Geography. The Market Forecasts are Provided in Terms of Value (USD).
Global Network Cloud Cost Optimization Market Trends and Insights
Multi-Cloud and Hybrid-Cloud Cost Complexity
Organizations are using more than one cloud environment, which makes it harder to assign ownership of resource and data-transfer costs. Flexera reported that 73% of surveyed enterprises operated hybrid environments in 2026. Mergers, decentralized purchasing, and growth in software-as-a-service use can add accounts, billing formats, and untagged resources to these environments. Cloud teams therefore need one view of usage, commitments, and traffic costs across providers. The Network cloud cost optimization market gains from this need because individual provider dashboards do not fully address cross-cloud allocation. European switching rules also make data-transfer economics more relevant when organizations compare vendor options.
Growth of AI and Data-Intensive Network Workloads
AI workloads place greater pressure on cloud budgets because they can require expensive GPUs, large datasets, and high volumes of data movement. CAST AI found that CPU utilization averaged 8% across the production Kubernetes deployments it analyzed in 2026. The same analysis reported that GPU utilization was 5%, showing that expensive capacity can remain underused. The FinOps Foundation reported that 98% of respondents managed AI spend in 2026, compared with 63% in 2025. The Network cloud cost optimization market is responding with tools that measure GPU use, allocate AI spending, and identify data-transfer charges. Demand is moving toward platforms that can assign inference and infrastructure costs to products, customers, and business units.
Shortage of Certified FinOps and Cloud-Networking Talent
The shortage of people who understand both cloud billing and network operations can slow the deployment of network-focused cost tools. The FinOps Foundation found that enterprises managing more than USD 100 million in annual cloud spend had 8-10 FinOps practitioners on average in 2026. These teams must cover allocation, reporting, commitments, engineering engagement, and increasingly AI spending. Organizations without an established FinOps practice may have difficulty interpreting results or setting effective policies. Bitkom found that 64% of cloud-using enterprises in Germany reported rising cloud operating costs in 2025. Managed services can address this gap, although buyers still need internal accountability for cost and application decisions.
Other drivers and restraints analyzed in the detailed report include:
- Rising Demand for FinOps and Cloud Financial Governance
- Need for Real-Time Network Egress and Traffic-Path Economics
- Fragmented Billing, Tagging, and Network-Telemetry Data
For complete list of drivers and restraints, kindly check the Table Of Contents.
Segment Analysis
Solutions held 65.15% of component revenue in 2025, supported by the installed base of visibility, rightsizing, traffic analytics, and planning tools used across complex cloud estates. Services are projected to grow at an 18.46% CAGR through 2031 as buyers seek assistance in applying recommendations across finance, engineering, and operations teams. Managed FinOps, consulting, implementation, and support help organizations convert billing data into sustained operating changes and establish clear accountability for those changes. Earlier adopters of dashboards increasingly need help with commitment management, tagging practices, business-unit allocation, and recurring reporting routines. This shift favors vendors that can combine software with expert delivery while adapting services to each customer's operating model.
The Network cloud cost optimization industry is moving from tool deployment toward recurring execution and governance. IBM's Apptio unit launched Conversational Insights in June 2026 with hybrid IT cost management and cloud optimization capabilities. The product connects cost, consumption, value, and action through Apptio's Financial Intelligence Layer. FOCUS adoption can also influence service selection because enterprises want support for normalized cloud cost data that can be used across multiple providers. The Network cloud cost optimization market can benefit when vendors pair integrated software with accountable service delivery and measurable follow-through.
Cloud deployment held 71.56% of the Network cloud cost optimization market in 2025, reflecting the large share of workloads already operating in public cloud environments. On-premises deployment is projected to grow at an 18.32% CAGR through 2031. Cloud delivery can reduce setup effort, simplify connections across multiple accounts, and provide a consistent experience for distributed teams. It also gives teams faster access to product updates, managed capabilities, and provider integrations. These advantages sustain cloud deployment as the leading model for organizations that can use externally hosted software.
On-premises use is growing because some organizations cannot export billing or operational data to an external software-as-a-service environment. Financial services, public-sector, and defense-related organizations may operate private or sovereign cloud infrastructure with requirements for tighter control over telemetry and access. Hybrid environments increase the need for a tool that works across public and private estates without creating separate cost-governance processes. Flexera reported that 73% of surveyed enterprises operated hybrid environments in 2026. The Network cloud cost optimization market must support both hosted and customer-managed implementations.
Complete Report Scope:
- By Component
- Solutions
- Cost Monitoring and Visibility
- Network Traffic and Egress Analytics
- Resource Rightsizing and Workload Optimization
- Budgeting, Forecasting, and Allocation
- Services
- Managed FinOps and Optimization Services
- Consulting and Implementation Services
- Support and Maintenance Services
- Solutions
- By Deployment Mode
- Cloud
- On Premise
- By Organization Size
- Large Enterprises
- Small and Medium Enterprises
- By Application
- Network Egress and Data-Transfer Optimization
- Kubernetes and Container Cost Management
- Cloud Resource Rightsizing
- Commitment and Discount Management
- Other Applications
- By End-User Industry
- Information Technology and Telecommunications
- Banking, Financial Services, and Insurance
- Retail and E-Commerce
- Healthcare and Life Sciences
- Manufacturing and Industrial
- Other End-User Industries
- By Geography
- North America
- United States
- Canada
- Mexico
- South America
- Brazil
- Argentina
- Rest of South America
- Europe
- Germany
- United Kingdom
- France
- Italy
- Spain
- Russia
- Rest of Europe
- Asia-Pacific
- China
- India
- Japan
- South Korea
- Australia and New Zealand
- Rest of Asia-Pacific
- Middle East
- Saudi Arabia
- United Arab Emirates
- Turkey
- Israel
- Rest of Middle East
- Africa
- South Africa
- Nigeria
- Egypt
- Rest of Africa
- North America
Geography Analysis
North America held 37.45% of the Network cloud cost optimization market share in 2025, supported by a high concentration of large cloud consumers and mature FinOps practices. Flexera reported that 76% of large U.S. enterprises spent more than USD 5 million monthly on cloud services in 2026. The region has a dense base of optimization vendors and cloud platform users, while AI infrastructure spending is adding demand for granular allocation and network egress controls. Canada supports demand through financial services adoption, while Mexico is developing early-stage cost-governance needs as cloud use expands.
Europe is shaped by compliance requirements and regional data-location choices. The Data Act supports conditions for switching between data-processing services, making portability and transfer costs relevant in cloud decisions, while Bitkom found that 64% of cloud-using enterprises in Germany reported rising operating costs in 2025 and 54% expected further increases in 2026.Germany, France, the United Kingdom, Italy, and Spain are important adoption markets, while Russian activity is constrained by geopolitical factors that affect access to mainstream hyperscaler infrastructure. The Network cloud cost optimization market needs to address regional governance requirements as well as cost allocation.
Asia-Pacific is projected to grow at an 18.51% CAGR through 2031 as enterprises formalize FinOps practices alongside rapid public-cloud adoption. CAST AI launched a Mumbai region in June 2026 with in-country support and feature parity with its global regions. India represents a developing demand center for enterprise cloud optimization. Japan and South Korea offer high-value opportunities where financial governance practices and complex Kubernetes estates support formal programs. South America is developing through Brazil and Argentina, while the Middle East and Africa remain earlier-stage areas linked to expanding cloud infrastructure and digitalization programs. The Network cloud cost optimization market has room to grow where cloud investment is rising faster than cost-management maturity.
- IBM Corporation
- Broadcom Inc.
- Flexera Software LLC
- CloudZero, Inc.
- Harness, Inc.
- Amazon Web Services, Inc.
- Microsoft Corporation
- Google LLC
- ServiceNow, Inc.
- Kubecost
- Densify Inc.
- nOps, Inc.
- Yotascale, Inc.
- Finout Ltd.
- CAST AI Group Inc.
- Datadog, Inc.
- DoiT International
- Oracle Corporation
- Nutanix, Inc.
- PointFive
- Zesty Ltd.
- CloudBolt Software, Inc.
Additional Benefits:
- The market estimate (ME) sheet in Excel format
- 3 months of analyst support
TABLE OF CONTENTS
1 INTRODUCTION
- 1.1 Study Assumptions and Market Definition
- 1.2 Scope of the Study
2 RESEARCH METHODOLOGY
3 EXECUTIVE SUMMARY
4 MARKET LANDSCAPE
- 4.1 Market Overview
- 4.2 Impact of Macroeconomic Factors on the Market
- 4.3 Market Drivers
- 4.3.1 Multi-Cloud and Hybrid-Cloud Cost Complexity
- 4.3.2 Growth of AI and Data-Intensive Network Workloads
- 4.3.3 Rising Demand for FinOps and Cloud Financial Governance
- 4.3.4 Need for Real-Time Network Egress and Traffic-Path Economics
- 4.3.5 FinOps-as-Code and Automated Policy Enforcement
- 4.3.6 Expansion of Cloud Optimization into SaaS, Kubernetes, and Private Infrastructure
- 4.4 Market Restraints
- 4.4.1 Shortage of Certified FinOps and Cloud-Networking Talent
- 4.4.2 Fragmented Billing, Tagging, and Network-Telemetry Data
- 4.4.3 Opaque Egress, Inter-Region, and Cross-Cloud Pricing
- 4.4.4 Risk of Automated Remediation Affecting Application Performance
- 4.5 Industry Value Chain Analysis
- 4.6 Regulatory Landscape
- 4.7 Technological Outlook
- 4.8 Porter's Five Forces Analysis
- 4.8.1 Threat of New Entrants
- 4.8.2 Bargaining Power of Suppliers
- 4.8.3 Bargaining Power of Buyers
- 4.8.4 Threat of Substitutes
- 4.8.5 Competitive Rivalry
5 MARKET SIZE AND GROWTH FORECASTS
- 5.1 By Component
- 5.1.1 Solutions
- 5.1.1.1 Cost Monitoring and Visibility
- 5.1.1.2 Network Traffic and Egress Analytics
- 5.1.1.3 Resource Rightsizing and Workload Optimization
- 5.1.1.4 Budgeting, Forecasting, and Allocation
- 5.1.2 Services
- 5.1.2.1 Managed FinOps and Optimization Services
- 5.1.2.2 Consulting and Implementation Services
- 5.1.2.3 Support and Maintenance Services
- 5.1.1 Solutions
- 5.2 By Deployment Mode
- 5.2.1 Cloud
- 5.2.2 On Premise
- 5.3 By Organization Size
- 5.3.1 Large Enterprises
- 5.3.2 Small and Medium Enterprises
- 5.4 By Application
- 5.4.1 Network Egress and Data-Transfer Optimization
- 5.4.2 Kubernetes and Container Cost Management
- 5.4.3 Cloud Resource Rightsizing
- 5.4.4 Commitment and Discount Management
- 5.4.5 Other Applications
- 5.5 By End-User Industry
- 5.5.1 Information Technology and Telecommunications
- 5.5.2 Banking, Financial Services, and Insurance
- 5.5.3 Retail and E-Commerce
- 5.5.4 Healthcare and Life Sciences
- 5.5.5 Manufacturing and Industrial
- 5.5.6 Other End-User Industries
- 5.6 By Geography
- 5.6.1 North America
- 5.6.1.1 United States
- 5.6.1.2 Canada
- 5.6.1.3 Mexico
- 5.6.2 South America
- 5.6.2.1 Brazil
- 5.6.2.2 Argentina
- 5.6.2.3 Rest of South America
- 5.6.3 Europe
- 5.6.3.1 Germany
- 5.6.3.2 United Kingdom
- 5.6.3.3 France
- 5.6.3.4 Italy
- 5.6.3.5 Spain
- 5.6.3.6 Russia
- 5.6.3.7 Rest of Europe
- 5.6.4 Asia-Pacific
- 5.6.4.1 China
- 5.6.4.2 India
- 5.6.4.3 Japan
- 5.6.4.4 South Korea
- 5.6.4.5 Australia and New Zealand
- 5.6.4.6 Rest of Asia-Pacific
- 5.6.5 Middle East
- 5.6.5.1 Saudi Arabia
- 5.6.5.2 United Arab Emirates
- 5.6.5.3 Turkey
- 5.6.5.4 Israel
- 5.6.5.5 Rest of Middle East
- 5.6.6 Africa
- 5.6.6.1 South Africa
- 5.6.6.2 Nigeria
- 5.6.6.3 Egypt
- 5.6.6.4 Rest of Africa
- 5.6.1 North America
6 COMPETITIVE LANDSCAPE
- 6.1 Market Concentration
- 6.2 Strategic Moves
- 6.3 Market Share Analysis
- 6.4 Company Profiles (includes Global Level Overview, Market Level Overview, Core Segments, Financials as available, Strategic Information, Market Rank/Share, Products and Services, Recent Developments)
- 6.4.1 IBM Corporation
- 6.4.2 Broadcom Inc.
- 6.4.3 Flexera Software LLC
- 6.4.4 CloudZero, Inc.
- 6.4.5 Harness, Inc.
- 6.4.6 Amazon Web Services, Inc.
- 6.4.7 Microsoft Corporation
- 6.4.8 Google LLC
- 6.4.9 ServiceNow, Inc.
- 6.4.10 Kubecost
- 6.4.11 Densify Inc.
- 6.4.12 nOps, Inc.
- 6.4.13 Yotascale, Inc.
- 6.4.14 Finout Ltd.
- 6.4.15 CAST AI Group Inc.
- 6.4.16 Datadog, Inc.
- 6.4.17 DoiT International
- 6.4.18 Oracle Corporation
- 6.4.19 Nutanix, Inc.
- 6.4.20 PointFive
- 6.4.21 Zesty Ltd.
- 6.4.22 CloudBolt Software, Inc.
7 MARKET OPPORTUNITIES AND FUTURE OUTLOOK
- 7.1 White-Space and Unmet-Need Assessment


