

|
시장보고서
상품코드
2119367
통신 사업자 조달 정보 : 시장 점유율 분석, 업계 동향 및 통계, 성장 예측(2026-2031년)Telecom Operator Procurement Intelligence - Market Share Analysis, Industry Trends & Statistics, Growth Forecasts (2026 - 2031) |
||||||
 Mordor Intelligence
Mordor Intelligence에 의하면, 통신 사업자 조달 정보 시장 규모는 2025년 11억 5,000만 달러로 평가되었습니다. 2026년에는 12억 8,000만 달러에, 게다가 2031년까지 20억 1,000만 달러로 확대되며 2026년부터 2031년까지 연평균 성장률(CAGR)은 9.45%를 나타낼 전망입니다.
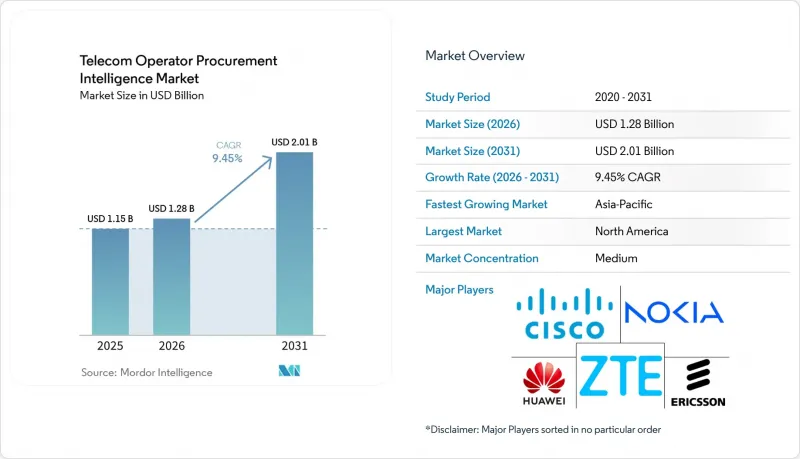
본 보고서는 서비스 유형(전략적 조달, 지출 분석 등), 도입 형태(클라우드 기반, On-Premise형, 하이브리드형), 조직 규모(대기업 등), 최종 사용자(모바일 네트워크 사업자 등), 조달 카테고리(무선 액세스 네트워크 장비 등) 및 지역별로 분류되어 있습니다. 시장 전망은 금액(달러) 기준으로 제시되어 있습니다.
세계의 통신 사업자 조달 정보 시장 동향 및 인사이트
분산된 통신 조달 데이터가 통합된 인텔리전스에 대한 수요를 창출하고 있습니다.
통신 사업자는 사업 부문별로 서로 다른 ERP, 조달 및 재무 시스템을 사용하는 경우가 많습니다. 이러한 시스템으로 인해 카테고리 관리자는 공급업체 이름, 계약 기록 및 지출 분류에서 불일치가 발생할 수 있습니다. 그 결과, 수작업으로 대조해야 하므로 관리형 서비스, 소프트웨어 라이선스, 전문 서비스 수수료 등 카테고리 간 비교가 어려워집니다. 통신 사업자 조달 인텔리전스 시장은 정규화된 지출 데이터를 조달 및 계약 의사 결정에 활용할 수 있도록 함으로써 이 문제를 해결하고 있습니다. 도이치 텔레콤은 전체 공급업체 기반에 ‘SAP Business Network for Procurement’를 도입했으며, SAP는 이 통합 레이어가 6개월 이내에 가동될 수 있을 것이라고 밝혔습니다. 데이터 정리를 미루는 사업자는 자동화 도구가 기존 데이터 품질 문제를 해결하기는커녕 오히려 이를 영구화시킬 수 있다는 사실을 깨닫게 될지도 모릅니다.
5G 독립형(SA) 및 네트워크 현대화 조달이 조달 프로세스의 복잡성을 가중시킵니다.
5G 독립형 프로그램에서는 무선 액세스, 코어 네트워크, 전송, 소프트웨어, 관리형 서비스에 관한 계약이 통합됩니다. 각 계약에는 서로 다른 이행 의무, 라이선스 규정, 보안 요구 사항이 적용될 수 있습니다. Wind Tre는 2026년, 클라우드 네이티브 듀얼 모드 5G 코어 네트워크 현대화와 관련해 에릭슨과 7년 계약을 체결했습니다. 또한 에릭슨은 2026년 3월, 일본 내 소프트뱅크의 코어 네트워크 확장 및 현대화에 대해서도 합의했습니다. 이러한 프로그램들은 대규모 프레임워크 계약이 체결되기 전에, 통신 사업자의 조달 인텔리전스 시장에서 공급업체 벤치마킹, 계약 조항 및 예측을 연계하는 도구가 왜 필요한지를 보여줍니다. 개방적이고 클라우드 네이티브인 아키텍처는 통신 사업자가 수년간 이어온 공급업체와의 관계를 재평가할 수 있게 해주지만, 관리해야 할 인터페이스와 종속 관계도 증가시킵니다.
ERP 시스템과 조달 시스템 간의 통합 복잡성이 도입 일정을 지연시킵니다.
조달 인텔리전스 플랫폼은 기존 ERP 및 조달-지급(Procure-to-Pay) 시스템 간의 신뢰할 수 있는 연동에 의존합니다. 합병을 통해 사업을 확장한 통신 사업자의 경우, 여러 데이터 모델이나 승인 프로세스가 도입되어 있을 수 있습니다. 이 때문에 매핑, 데이터 복제 및 인터페이스 테스트가 도입 작업의 중요한 부분을 차지하게 됩니다. Colt Technology사는 5개의 엔터프라이즈 플랫폼을 통합하면서 조달, 재무, 인사 기능을 SAP S/4HANA Cloud로 이전했습니다. 이 사례는 도입에 소요되는 기간이 단일 소프트웨어 구매보다 길어지는 이유를 보여줍니다. 따라서 통신 사업자의 조달 인텔리전스 시장에서는 단계적인 통합과 강력한 정보 보안 대책에 대응할 필요가 있습니다.
부문별 분석
2025년, 전략적 소싱은 통신 사업자 조달 정보 시장에서 32.14%의 점유율을 차지했습니다. 이러한 위상은 카테고리 전략, 제안 요청서(RFP) 관리, 공급업체와의 협상, 그리고 프레임워크 계약 설계에 대한 통신 사업자의 지속적인 요구를 반영합니다. 또한, 계약 체결 후에도 성과 모니터링이 지속되므로 공급업체 관리 및 계약 관리 역시 여전히 중요합니다. 계약에 네트워크 장비, 클라우드 서비스, 관리형 서비스가 포함되는 경우, 조달 팀은 의무 사항에 대한 명확한 기록이 필요합니다. 지출 분석 시장은 2031년까지 연평균 성장률(CAGR) 12.61%를 나타낼 것으로 예측됩니다. 이 부문은 통신 사업자가 서로 다른 시스템이나 조직 전반에 걸친 지출 상황을 통합적으로 파악하고자 할 때 그 장점을 발휘합니다. 이를 통해 새로운 조달 프로세스가 시작되기 전에 중복된 공급업체, 분류되지 않은 거래, 불균일한 구매 패턴을 식별할 수 있습니다. 따라서 이는 전략적 소싱 프로세스를 대체하기보다는 이와 병행하여 활용할 때 유용합니다.
조달 업무가 데이터 관리와 더욱 밀접하게 연결됨에 따라 서비스 구성도 변화하고 있습니다. 조달 결정에는 동일한 워크플로우 내에서 지출 내역, 계약 조건, 공급업체 정보 및 운영 요건이 필요할 수 있습니다. 이를 통해 기초가 되는 재무 기록을 변경하지 않고도 원시 거래 데이터를 표준화할 수 있는 플랫폼의 가치가 높아집니다. 또한 지출 분석은 팀이 서로 다른 계약 조건 하에서 유사한 제품이나 서비스를 구매하고 있는 부분을 밝혀냄으로써 수요 관리도 지원합니다. 테일 스펜드 관리와 규정 준수 모니터링은 ‘기타’ 범주에 포함됩니다. 이러한 기능은 수많은 소규모 거래가 누적되어 상당한 비용 및 관리상의 부담이 될 때 중요한 역할을 수행합니다. 통신 사업자용 조달 인텔리전스 시장에서는 사업자에게 기존의 모든 조달 용도를 교체하도록 강요하지 않으면서도 이러한 기능을 연동할 수 있는 공급업체가 높은 평가를 받을 가능성이 높습니다. 통신 사업자용 조달 인텔리전스 업계에서는 우선순위가 높은 이용 사례 하나부터 시작하여, 시간을 두고 범위를 확대할 수 있는 솔루션이 유리하게 작용합니다.
2025년, 통신 사업자용 조달 인텔리전스 시장에서 클라우드 기반 도입은 76.42%를 차지했습니다. 클라우드 시스템은 On-Premise 도입에 비해 기능 업데이트가 신속하며, 인프라 관리 요구 사항도 낮습니다. SAP는 2026년 3월, SAP Business Technology Platform을 기반으로 차세대 SAP Ariba를 출시했습니다. 여기에는 소싱, 계약 체결, 지출 분석 각 워크플로우에 Joule이 통합되어 있습니다. 이번 출시는 조달 기능을 클라우드 기반 엔터프라이즈 시스템과 통합하려는 통신 사업자를 지원하기 위한 것입니다. 데이터 소재지, 보안 또는 내부 통제 규정이 엄격한 경우, On-Premise 배포는 여전히 유효합니다. 이러한 조건은 기밀성이 높은 계약서, 공급업체의 재무 정보, 네트워크 보안 관련 기록에서 특히 중요합니다. 클라우드를 도입한다고 해서 어떤 기록을 로컬 환경 외부에서 처리할 수 있는지 분류할 필요가 없어지는 것은 아닙니다.
하이브리드 배포는 2026년부터 2031년까지 연평균 성장률(CAGR) 12.73%로 확대될 것으로 예측됩니다. 이를 통해 사업자는 기밀 데이터를 관리된 환경에 보관하면서, 분석 및 협업을 위해 클라우드 리소스를 활용할 수 있게 됩니다. 이러한 설계를 통해 계약 문서나 보안 공개 정보를 공급업체 조사나 지출 분류와 같은 위험이 낮은 업무로부터 분리할 수 있습니다. 스위스콤(Swisscom)은 SAP Ariba 솔루션을 활용하여 공급업체 관리를 개선하고, 전체 공급업체 기반에서 전자 청구서 도입률 100%를 달성했습니다. 이 사례는 연계된 조달 프로세스가 대규모 공급업체 네트워크 전반에 걸쳐 가시성을 어떻게 향상시킬 수 있는지를 보여줍니다. 통신 사업자 조달 정보 시장에서는 하이브리드 모델을 활용함으로써 완전한 클라우드 접근 방식을 원하지 않는 규제 대상 통신 사업자에게 서비스를 제공할 수 있습니다. 도입 방식의 선택은 앞으로도 현지 규제, 기존 용도 및 조달 데이터의 기밀성에 따라 좌우될 것입니다.
지역별 분석
2025년 기준, 북미는 38.42%의 점유율을 차지했습니다. 이 지역은 조달 기술 환경이 성숙해 있으며, 대규모 자본 변혁 프로그램을 추진하는 주요 통신 사업자가 존재합니다. 제공된 자료에 따르면, AT&T는 2027년까지 네트워크, 정보 기술 및 전반적인 운영 기능에 걸친 플랫폼 개편에 140억 달러를 할당하고 있습니다. 이러한 규모의 투자로 인해 기술 지출과 공급업체의 성과를 연계하는 조달 기록에 대한 수요가 발생하고 있습니다. 이 지역에서는 확립된 소스-투-페이(S2P) 시스템이 도입을 촉진하고 있지만, 레거시 시스템과의 통합이 여전히 일부 프로젝트의 진행을 지연시키고 있습니다. 남미는 규모는 작지만 성장세가 두드러지는 지역으로, 브라질과 칠레의 통신 사업자들이 보다 광범위한 디지털 전환의 일환으로 조달 프로그램을 공식적으로 도입하고 있습니다. 통신 사업자의 조달 인텔리전스 시장은 사업자들이 분산된 구매 관행에서 카테고리 및 공급업체 관리로 전환함에 따라 추가적인 성장 여지가 있습니다.
아시아태평양은 2031년까지 연평균 성장률(CAGR) 13.24%를 나타낼 것으로 예측됩니다. 중국, 일본, 인도, 한국에서는 네트워크 현대화 프로그램이 진행 중이며, 이로 인해 조달 활동의 규모와 복잡성이 증가하고 있습니다. 인도의 2026년 데이터 현지화 요건은 현지화된 조달 데이터 환경을 촉진할 가능성이 있습니다. NTT 도코모는 주요 벤더들에게 멀티 벤더 Open RAN 통합에 대한 협력을 요청하고 있으며, 이를 통해 성과 공유 및 계약 모니터링의 가치가 높아지고 있습니다. 한국의 SK텔레콤은 ‘지속 가능한 조달 방침’을 유지하고 있으며, 공급업체에게 ESG 실적 보고 및 ‘Science-Based Targets’ 준수를 요구하고 있습니다. 또한, 에릭슨이 2026년 3월에 소프트뱅크와 체결한 계약도 해당 지역 내 대규모 코어 네트워크 현대화 계약의 한 사례를 보여줍니다. 이러한 상황으로 인해, 동일한 환경 내에서 현지 규정 준수 대응과 다중 벤더 조달을 관리할 수 있는 도구에 대한 수요가 발생하고 있습니다.
중동 및 아프리카는 시장 규모는 작지만, 현대화에 대한 수요는 활발합니다. 카타르의 Ooredoo는 2025년 2월, 코어 네트워크 현대화 및 5G 독립형(SA) 서비스 도입을 위해 노키아를 선정했습니다. 이 계약은 코어 네트워크 조달 시 기술, 서비스, 운영 요건을 비교 검토할 필요성을 반영하고 있습니다. 아프리카의 조달 관행은 아직 초기 단계에 있지만, 남아프리카공화국과 나이지리아의 통신 사업자들 사이에서 활동이 활발해지고 있습니다. GSMA는 2026년 7월, 모바일 부문의 탄소 배출량 중 4분의 3이 스코프 3 밸류체인에서 비롯된다고 발표했습니다. 이 단체의 ‘스코프 3 평가 도구’는 공급업체 관련 배출량 대책을 위한 공통 기반을 제공합니다. ‘통신사 조달 인텔리전스 시장’은 공급업체의 지속가능성 데이터를 상업적 조달 결정에 반영하고자 하는 통신사를 지원할 수 있습니다.
기타 혜택 :
- 엑셀 형식 시장 예측(ME) 시트
- 3개월간의 애널리스트 지원
자주 묻는 질문
목차
제1장 서론
제2장 조사 방법
제3장 개요
제4장 시장 구도
제5장 시장 규모 및 성장 예측
제6장 경쟁 구도
제7장 시장 기회 및 향후 전망
KTH 26.09.02According to Mordor Intelligence, the telecom operator procurement intelligence market size is projected to expand from USD 1.15 billion in 2025 to USD 1.28 billion in 2026, and to USD 2.01 billion by 2031, registering a CAGR of 9.45% between 2026 and 2031.
This report is Segmented by Service Type (Strategic Sourcing, Spend Analysis, and More), Deployment (Cloud-Based, On-Premises, and Hybrid), Organization Size (Large Enterprises, More), End User (Mobile Network Operators, and More), Procurement Category (Radio Access Network Equipment, and More), and Geography. The Market Forecasts are Provided in Terms of Value (USD).
Global Telecom Operator Procurement Intelligence Market Trends and Insights
Fragmented Telecom Procurement Data Creates Demand for Unified Intelligence
Telecom operators often use separate ERP, procurement, and finance systems across business units. These systems can leave category managers with inconsistent supplier names, contract records, and spending classifications. The resulting manual reconciliation makes it harder to compare categories such as managed services, software licenses, and professional fees. The Telecom Operator Procurement Intelligence Market addresses this problem by making normalized spend data usable in sourcing and contract decisions. Deutsche Telekom deployed SAP Business Network for Procurement across its supplier base, and SAP stated that the integration layer could be operational within 6 months. Operators who delay data cleanup may find that automated tools perpetuate existing data-quality problems rather than resolving them.
5G Standalone and Network Modernization Procurement Intensifies Sourcing Complexity
5G standalone programs bring together contracts for radio access, core networks, transport, software, and managed services. Each agreement can use different performance obligations, licensing rules, and security requirements. Wind Tre signed a 7-year agreement with Ericsson for cloud-native dual-mode 5G Core modernization in 2026. Ericsson also agreed in March 2026 to expand and modernize SoftBank's core network in Japan. These programs show why the Telecom Operator Procurement Intelligence Market needs tools that connect supplier benchmarks, contract clauses, and forecasts before large frameworks are awarded. Open and cloud-native architectures also allow operators to reassess long-standing supplier relationships, but they add more interfaces and dependencies to manage.
Integration Complexity Across ERP and Procurement Systems Delays Adoption Timelines
Procurement intelligence platforms depend on reliable links to existing ERP and procure-to-pay systems. Operators that expanded through mergers can have several data models and approval processes in place. This makes mapping, data replication, and interface testing a substantial part of deployment work. Colt Technology migrated procurement, finance, and human resources capabilities to SAP S/4HANA Cloud while integrating 5 enterprise platforms. The example shows why implementation can take longer than a standalone software purchase. The Telecom Operator Procurement Intelligence Market must therefore accommodate phased integration and robust information security controls.
Other drivers and restraints analyzed in the detailed report include:
- Continuous Supplier Risk Monitoring Replaces Point-in-Time Reviews
- Multi-Vendor and Open-Network Sourcing Complexity Demands Structured Procurement Intelligence
- Data Sovereignty and Cross-Border Procurement Restrictions Fragment Global Deployments
For complete list of drivers and restraints, kindly check the Table Of Contents.
Segment Analysis
Strategic Sourcing held 32.14% of the Telecom Operator Procurement Intelligence Market share in 2025. Its position reflects operators' continued need for category strategy, request-for-proposal management, supplier negotiation, and framework agreement design. Supplier Management and Contract Management also remain important because performance monitoring continues after an award. Procurement teams need a clear record of obligations when contracts include network equipment, cloud services, and managed services. Spend Analysis is forecast to grow at a CAGR of 12.61% through 2031. The segment benefits when operators seek a consistent view of spending across different systems and entities. It can identify duplicate suppliers, unclassified transactions, and uneven buying patterns before a new sourcing event begins. This makes it useful alongside, rather than instead of, strategic sourcing processes.
The service mix is changing as procurement work becomes more closely linked to data management. A sourcing decision may require spending history, contract terms, supplier information, and operational requirements in the same workflow. This raises the value of platforms that can normalize raw transaction data without changing the underlying financial records. Spend analysis also supports demand management by showing where teams purchase similar products or services under different arrangements. Tail-spend management and compliance monitoring are included in the Others category. These applications matter when many small transactions collectively create a meaningful cost or control burden. The Telecom Operator Procurement Intelligence Market is likely to reward providers that connect these functions without forcing operators to replace every existing procurement application. The telecom operator procurement intelligence industry benefits from offerings that can start with one high-priority use case and broaden over time.
Cloud-Based deployment held 76.42% of the Telecom Operator Procurement Intelligence Market in 2025. Cloud systems can offer faster feature updates and lower infrastructure management requirements than on-premises installations. SAP launched next-generation SAP Ariba on the SAP Business Technology Platform in March 2026, with Joule embedded across sourcing, contracting, and spend analytics workflows. This release supports operators seeking to align procurement functions with cloud-based enterprise systems. On-Premises deployment remains relevant where data residency, security, or internal control rules are strict. These conditions are particularly important for sensitive contract, supplier financial, and network security records. Cloud adoption does not remove the need to classify which records can be processed outside local environments.
Hybrid deployment is projected to grow at a CAGR of 12.73% between 2026 and 2031. It allows operators to retain sensitive data in controlled environments while using cloud resources for analytics and collaboration. This design can separate contract documents and security disclosures from lower-risk tasks such as supplier research and spend classification. Swisscom used SAP Ariba solutions to improve supplier management and achieve 100% e-invoice coverage across its supplier base. The case illustrates how connected procurement processes can improve visibility across a large supplier network. The Telecom Operator Procurement Intelligence Market can use hybrid models to serve regulated operators that do not want an all-cloud approach. Deployment choice will remain tied to local rules, existing applications, and the sensitivity of procurement data.
Complete Report Scope:
- By Service Type
- Strategic Sourcing
- Supplier Management
- Contract Management
- Spend Analysis
- Other Service Types
- By Deployment
- Cloud-Based
- On-Premises
- Hybrid
- By Organization Size
- Large Enterprises
- Small and Medium-Sized Enterprises
- By End User
- Mobile Network Operators
- Fixed-Line and Broadband Operators
- Integrated Telecommunications Operators
- Tower Companies and Neutral-Host Providers
- Other End users
- By Procurement Category
- Radio Access Network Equipment
- Optical Transport and Fiber Infrastructure
- Core Network and IP Equipment
- Cloud, IT, and Software Services
- Managed Network Services
- By Geography
- North America
- United States
- Canada
- Mexico
- South America
- Brazil
- Argentina
- Chile
- Rest of South America
- Europe
- Germany
- United Kingdom
- France
- Italy
- Spain
- Rest of Europe
- Asia-Pacific
- China
- Japan
- India
- South Korea
- Australia
- Rest of Asia-Pacific
- Middle East
- United Arab Emirates
- Saudi Arabia
- Qatar
- Rest of Middle East
- Africa
- South Africa
- Egypt
- Nigeria
- Rest of Africa
- North America
Geography Analysis
North America held 38.42% in 2025. The region has a mature procurement technology environment and major carriers with large capital transformation programs. AT&T had earmarked USD 14 billion through 2027 for platform overhauls across the network, information technology, and operations functions, as stated in the supplied material. This scale creates demand for procurement records that connect technology spending with supplier performance. The region's established source-to-pay systems can support adoption, but legacy system integration still slows some projects. South America is a smaller but growing area as Brazilian and Chilean operators formalize procurement programs within broader digital transformation work. The Telecom Operator Procurement Intelligence Market has room to expand, where operators move from dispersed buying practices toward category and supplier management.
Asia-Pacific is forecast to grow at a CAGR of 13.24% through 2031. China, Japan, India, and South Korea are advancing network modernization programs that increase the volume and complexity of procurement activity. India's 2026 data localization requirement can favor localized procurement data environments. NTT DoCoMo has required major vendors to collaborate on multi-vendor Open RAN integration, which increases the value of shared performance and contract oversight. South Korea's SK Telecom maintained a Sustainable Procurement Policy that requires suppliers to report ESG performance and align with Science-Based Targets. Ericsson's March 2026 agreement with SoftBank also illustrates the large core modernization contracts in the region. These conditions create demand for tools that can manage local compliance and multi-vendor sourcing in the same environment.
The Middle East and Africa have a smaller aggregate position but a strong demand for modernization. Ooredoo Qatar selected Nokia in February 2025 to modernize its core network and enable 5G standalone services. The agreement reflects the need to compare technology, service, and operating requirements during core network sourcing. Procurement practices in Africa are at an earlier stage, with growing activity among South African and Nigerian operators. The GSMA stated in July 2026 that 3 quarters of mobile-sector carbon emissions come from Scope 3 value chain sources. Its Scope 3 Assessment Tool provides a common basis for supplier-related emissions work. The Telecom Operator Procurement Intelligence Market can support operators seeking to integrate supplier sustainability data into commercial sourcing decisions.
- Huawei Technologies Co., Ltd.
- Ericsson AB
- Nokia Corporation
- ZTE Corporation
- Samsung Electronics Co., Ltd.
- Cisco Systems, Inc.
- NEC Corporation
- Fujitsu Limited
- Ciena Corporation
- Juniper Networks, Inc.
- CommScope Holding Company, Inc.
- Corning Incorporated
- Infinera Corporation
- Ribbon Communications Inc.
- Adtran Holdings, Inc.
- FiberHome Telecommunication Technologies Co., Ltd.
- Mavenir Systems, Inc.
- Airspan Networks Inc.
- Sterlite Technologies Limited
- EXFO Inc.
- Tejas Networks Limited
- Ekinops S.A.
- Aviat Networks, Inc.
- Ceragon Networks Ltd.
- Cambium Networks Corporation
Additional Benefits:
- The market estimate (ME) sheet in Excel format
- 3 months of analyst support
TABLE OF CONTENTS
1 INTRODUCTION
- 1.1 Study Assumptions and Market Definition
- 1.2 Scope of the Study
2 RESEARCH METHODOLOGY
3 EXECUTIVE SUMMARY
4 MARKET LANDSCAPE
- 4.1 Market Overview
- 4.2 Market Drivers
- 4.2.1 Fragmentation of Telecom Procurement Data
- 4.2.2 Accelerating 5G Standalone and Network Modernization Procurement
- 4.2.3 Rising Demand for Continuous Supplier Risk Monitoring
- 4.2.4 Increasing Multi-Vendor and Open-Network Sourcing Complexity
- 4.2.5 Growth of AI-Enabled Spend Classification and Contract Analytics
- 4.2.6 Increasing Procurement Focus on Sustainability and Scope 3 Reporting
- 4.3 Market Restraints
- 4.3.1 Integration Complexity Across ERP and Procurement Systems
- 4.3.2 Data Sovereignty and Cross-Border Procurement Restrictions
- 4.3.3 Limited Standardization of Telecom Supplier and Contract Data
- 4.3.4 Procurement Budget Deferrals During Network Investment Cycles
- 4.4 Impact of Macroeconomic Factors on the Market
- 4.5 Industry Value-Chain Analysis
- 4.6 Technology Outlook
- 4.7 Regulatory Landscape
- 4.8 Porter's Five Forces Analysis
- 4.8.1 Threat of New Entrants
- 4.8.2 Bargaining Power of Suppliers
- 4.8.3 Bargaining Power of Buyers
- 4.8.4 Threat of Substitutes
- 4.8.5 Intensity of Competitive Rivalry
5 MARKET SIZE AND GROWTH FORECASTS (VALUE)
- 5.1 By Service Type
- 5.1.1 Strategic Sourcing
- 5.1.2 Supplier Management
- 5.1.3 Contract Management
- 5.1.4 Spend Analysis
- 5.1.5 Other Service Types
- 5.2 By Deployment
- 5.2.1 Cloud-Based
- 5.2.2 On-Premises
- 5.2.3 Hybrid
- 5.3 By Organization Size
- 5.3.1 Large Enterprises
- 5.3.2 Small and Medium-Sized Enterprises
- 5.4 By End User
- 5.4.1 Mobile Network Operators
- 5.4.2 Fixed-Line and Broadband Operators
- 5.4.3 Integrated Telecommunications Operators
- 5.4.4 Tower Companies and Neutral-Host Providers
- 5.4.5 Other End users
- 5.5 By Procurement Category
- 5.5.1 Radio Access Network Equipment
- 5.5.2 Optical Transport and Fiber Infrastructure
- 5.5.3 Core Network and IP Equipment
- 5.5.4 Cloud, IT, and Software Services
- 5.5.5 Managed Network Services
- 5.6 By Geography
- 5.6.1 North America
- 5.6.1.1 United States
- 5.6.1.2 Canada
- 5.6.1.3 Mexico
- 5.6.2 South America
- 5.6.2.1 Brazil
- 5.6.2.2 Argentina
- 5.6.2.3 Chile
- 5.6.2.4 Rest of South America
- 5.6.3 Europe
- 5.6.3.1 Germany
- 5.6.3.2 United Kingdom
- 5.6.3.3 France
- 5.6.3.4 Italy
- 5.6.3.5 Spain
- 5.6.3.6 Rest of Europe
- 5.6.4 Asia-Pacific
- 5.6.4.1 China
- 5.6.4.2 Japan
- 5.6.4.3 India
- 5.6.4.4 South Korea
- 5.6.4.5 Australia
- 5.6.4.6 Rest of Asia-Pacific
- 5.6.5 Middle East
- 5.6.5.1 United Arab Emirates
- 5.6.5.2 Saudi Arabia
- 5.6.5.3 Qatar
- 5.6.5.4 Rest of Middle East
- 5.6.6 Africa
- 5.6.6.1 South Africa
- 5.6.6.2 Egypt
- 5.6.6.3 Nigeria
- 5.6.6.4 Rest of Africa
- 5.6.1 North America
6 COMPETITIVE LANDSCAPE
- 6.1 Market Concentration
- 6.2 Strategic Moves
- 6.3 Market Share Analysis
- 6.4 Company Profiles (includes Global Level Overview, Market Level Overview, Core Segments, Financials as available, Strategic Information, Market Rank/Share, Products and Services, Recent Developments)
- 6.4.1 Huawei Technologies Co., Ltd.
- 6.4.2 Ericsson AB
- 6.4.3 Nokia Corporation
- 6.4.4 ZTE Corporation
- 6.4.5 Samsung Electronics Co., Ltd.
- 6.4.6 Cisco Systems, Inc.
- 6.4.7 NEC Corporation
- 6.4.8 Fujitsu Limited
- 6.4.9 Ciena Corporation
- 6.4.10 Juniper Networks, Inc.
- 6.4.11 CommScope Holding Company, Inc.
- 6.4.12 Corning Incorporated
- 6.4.13 Infinera Corporation
- 6.4.14 Ribbon Communications Inc.
- 6.4.15 Adtran Holdings, Inc.
- 6.4.16 FiberHome Telecommunication Technologies Co., Ltd.
- 6.4.17 Mavenir Systems, Inc.
- 6.4.18 Airspan Networks Inc.
- 6.4.19 Sterlite Technologies Limited
- 6.4.20 EXFO Inc.
- 6.4.21 Tejas Networks Limited
- 6.4.22 Ekinops S.A.
- 6.4.23 Aviat Networks, Inc.
- 6.4.24 Ceragon Networks Ltd.
- 6.4.25 Cambium Networks Corporation
7 MARKET OPPORTUNITIES AND FUTURE OUTLOOK
- 7.1 White-Space and Unmet-Need Assessment

(주말 및 공휴일 제외)


