

|
시장보고서
상품코드
2119594
애틀랜타의 데이터센터 시장 : 점유율 분석, 업계 동향과 통계, 성장 예측(2026-2031년)Atlanta Data Center - Market Share Analysis, Industry Trends & Statistics, Growth Forecasts (2026 - 2031) |
||||||
 Mordor Intelligence
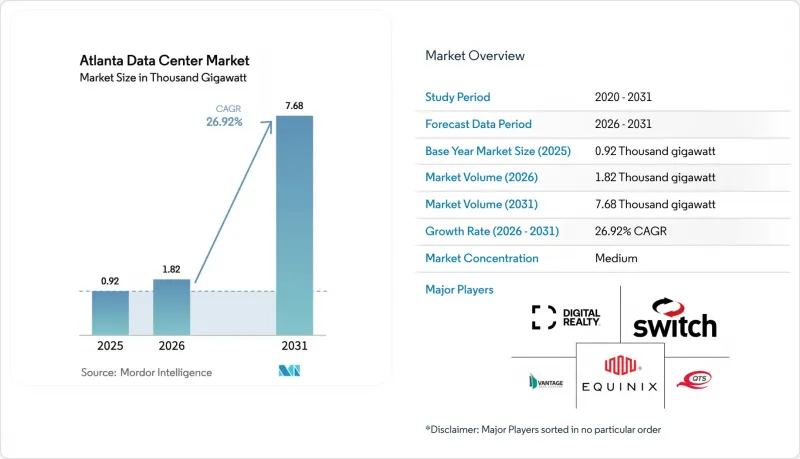
에 의하면, 2026년 애틀랜타 데이터센터 시장 규모는 IT설비 전력 용량으로 1.82 GW로 추정되고 있어 2025년 0.92 GW에서 증가했습니다.
또한, 2031년 전망에 따르면 IT 설비 전력 용량이 7.68 GW에 달할 것으로 예상되며, 2026년부터 2031년까지 연평균 성장률(CAGR) 26.95%로 성장할 것으로 전망됩니다.
본 보고서는 데이터센터 규모(소규모, 중규모, 대규모, 초대규모, 메가 규모), 티어 유형(Tier 1·2, Tier 3, Tier 4), 데이터센터 유형(클라우드 서비스 제공업체(CSP), 코로케이션형 등)별로 분류되어 있습니다. 시장 전망은 금액(달러) 기준으로 제시되어 있습니다.
애틀랜타 데이터센터 시장 동향 및 인사이트
AI/클라우드 주도형 하이퍼스케일 구축: 전력 요구 사항의 재정의
애틀랜타의 최신 하이퍼스케일 캠퍼스는 AI 훈련 클러스터의 요구 사항을 충족하기 위해 랙 밀도 40kW를 초과하는 사양으로 설계되었습니다. 마이크로소프트만 해도 총 324MW 규모의 3개 현지 시설에 18억 달러를 투자하고 있습니다. 전력연구협회(EPRI)에 따르면, AI는 이미 전미 데이터센터 전력 소비량의 10-20%를 차지하고 있으며, 이 비율로 볼 때 2030년까지 해당 부문 수요가 미국 발전량의 9.1%에 달할 가능성이 있습니다. 최신 시설에서는 액체 냉각 시스템, 추가 개폐 장치, 부지 내 변전소 등이 도입되어 프리미엄 가격 책정이 이루어지고 있는 반면, 기존 데이터센터는 개보수 압박에 직면해 있습니다. 이러한 시설들이 남부 대도시권에 집중됨에 따라, 이중화된 송전망, 루프형 광섬유, 100에이커 규모의 부지가 융합된 전용 유틸리티 구역이 형성되고 있습니다.
엣지 컴퓨팅과 지연 시간에 민감한 워크로드: 도시 지역 확장을 주도
모바일 게임, 원격 의료, 금융 거래 플랫폼이 애틀랜타 다운타운 전역에 마이크로 시설의 그물망 같은 네트워크를 형성하고 있습니다. 아메리칸 타워(American Tower)는 홉 수를 5밀리초 미만으로 억제하기 위해 피치트리 센터(Peachtree Center) 인근에 엣지 노드를 증설했습니다. Vapor IO와 컴캐스트는 기존 케이블 설비와 연동하기 위해 라스트 마일 엣지 서비스의 시범 운영을 진행하고 있습니다. EdgeConneX는 시청에서 반경 3마일 이내 지역에 총 16MW 규모의 두 개 거점을 운영하고 있습니다. 이러한 확장을 통해 AI 추론, 인터랙티브 미디어, 자율주행차 텔레메트리 분야의 네트워크 지연이 감소함에 따라, 애틀랜타 광역권은 코어와 엣지 모두의 거점으로서의 위상을 확립하고 있습니다.
전력 공급 리드타임: 중요 인프라의 병목 현상
조지아 파워(Georgia Power)는 2035년까지 산업용 전력 수요가 17배 증가할 것으로 예측하고 있으며, 그 증가분의 80%를 데이터센터가 차지할 것으로 전망하고 있습니다. 고압 송전선 연장에는 평균 4년에 가까운 리드타임이 소요되어, 단계적 확장이나 현장 가스 터빈 도입을 불가피하게 만들고 있습니다. 대도시권 시장들은 주문 증가 속도를 따라잡기 위해서는 2030년까지 8.2 GW의 추가 용량이 필요하다고 경고하고 있습니다. 새로운 주 규정에 따라 대규모 프로젝트는 주택용 고객의 요금 인상을 방지하기 위해 변전소 업그레이드 비용을 공동 부담해야 할 의무가 있습니다.
부문 분석
2025년 현재, 메가 사이트는 애틀랜타 데이터센터 시장 점유율의 53.12%를 차지하고 있으며, 이는 2025년 가동 중인 IT 용량 467.5 MW에 해당합니다. 이러한 압도적인 점유율로 인해, 이미 발표된 확장 계획이 가동됨에 따라 애틀랜타 데이터센터 시장의 메가급 건설 규모는 2020년대 중반까지 1.57 GW로 확대될 전망입니다. 규모의 경제를 통해 사업자는 전력 비용을 절감하고, 랙 단위가 아닌 룸 단위로 SCADA 지원 배전 시스템을 도입할 수 있게 됩니다. 아마존 웹 서비스(AWS)의 110억 달러 규모의 조지아주 프로그램에는 100MW를 초과하는 여러 블록이 포함되어 있으며, 이는 캠퍼스형 내결함성 청사진을 제시하고 있습니다. ‘대규모’(20-100 MW) 부문은 2위 클라우드 사업자와 SaaS 벤더들이 미래를 내다보며 거점 확보를 추진함에 따라 연평균 28.73%의 성장이 예상됩니다. 한편, ‘중규모’ 및 ‘대규모’ 카테고리는 프라이빗 클라우드로의 워크로드 이전, 엣지 캐싱, 그리고 규정 준수에 기반한 격리 구역에서 계속해서 중요한 역할을 수행하고 있습니다. 소규모(5MW 미만) 시설은 와트 규모보다 근접성을 중시하는 통신 사업자의 엣지 클러스터 및 연구시설로 초점을 옮기고 있습니다.
경제적인 측면에서 메가 캠퍼스는 옥상 열교환 루프와 부지 내 냉수 플랜트를 통합하여 PUE 값을 1.2 수준으로 억제하고 있습니다. 토지 집약 전략을 통해 부지를 200에이커 규모의 슈퍼 사이트로 통합함으로써, 공급되는 1메가와트당 지자체 승인 건수를 줄이고 있습니다. 이 전략은 자본 지출을 사전 임대 계약과 일치시키는 다동 단계별 개발도 지원하여 개발업자의 내부 수익률(IRR)을 유지합니다. 향후 5년 동안 AI 랙 밀도가 80kW를 초과하여 전용 전원 트레인이 필요해짐에 따라, 애틀랜타의 데이터센터 시장은 메가 및 매시브급 시설로 12퍼센트 포인트 더 이동할 것으로 예측됩니다.
2025년에는 Tier 3 시설이 가동 면적의 65.72%를 차지하며, 미션 크리티컬하면서도 비용에 민감한 도입 사례에서 표준으로서의 위상을 확고히할 것으로 보입니다. 기업들이 On-Premise 서버실을 폐지함에 따라, 애틀랜타 데이터센터 시장에서 Tier 3 시설에 할당되는 규모는 2031년까지 2.42 GW를 넘어설 것으로 예측됩니다. 한편, Tier 4는 단일 장애 지점을 허용할 수 없는 머신러닝 클러스터, 핀테크 청산 시스템, 국방 관련 워크로드에 힘입어 연평균 성장률(CAGR) 28.54%로 성장을 지속하고, 있습니다. 사업자 측은 가동률 99.999%(5 나인)과 평균 복구 시간(MTTR) 단축을 특징으로 하는 서비스 수준 계약(SLA)을 제공함으로써, 자본 지출(CAPEX)의 높은 비용을 정당화하고 있습니다. 플렉센셜(Flexential)의 알파레타(Alpharetta) 거점은 액체 냉각, 업플로우(upflow) 방식의 격리 시스템, 평방피트당 1,500W의 밀도를 갖추고 있어 Tier 4의 경제성을 구현하고 있습니다.
Tier 1 및 Tier 2 시설은 주로 아카이브 스토리지, 스테이징 영역, 재해 복구 거점을 담당하고 있지만, 가격 차이가 줄어들면서 그 점유율은 감소하고 있습니다. 설계 동향으로는 Tier 3 시설이 이중 유틸리티 공급, 세분화된 버스웨이, 배터리 에너지 저장 시스템과 같은 Tier 4의 특정 요소를 통합하여, 완전한 Tier 4 수준의 비용을 들이지 않고도 자산의 미래 가치를 확보하려는 움직임이 나타나고 있습니다.
기타 혜택:
- 엑셀 형식 시장 예측(ME) 시트
- 3개월간의 애널리스트 지원
자주 묻는 질문
목차
제1장 서론
제2장 조사 방법
제3장 개요
제4장 시장 구도
제5장 시장 규모와 성장 예측(MW)
제6장 경쟁 구도
제7장 시장 기회와 향후 전망
JHS 26.09.03According to Mordor Intelligence, the atlanta data center market size in 2026 is estimated at 1.82 GW of installed IT power, up from 0.92 GW in 2025, with 2031 projections showing 7.68 GW of installed IT power, growing at a 26.95% CAGR over 2026-2031.
This report is Segmented by Data Center Size (Small, Medium, Large, Massive, Mega), Tier Type (Tier 1&2, Tier 3, Tier 4), and Data Center Type (Cloud Service Providers (CSPs), Colocation Type, and More). The Market Forecasts are Provided in Terms of Value (USD).
Atlanta Data Center Market Trends and Insights
AI / Cloud-Led Hyperscale Builds: Reshaping Power Requirements
Atlanta's newest hyperscale campuses are being engineered for rack densities exceeding 40 kW to satisfy AI training clusters. Microsoft alone is investing USD 1.8 billion in three local facilities totaling 324 MW. Electric Power Research Institute notes AI already accounts for 10-20% of data-center electricity draw nationwide, a share that could push sector demand to 9.1% of U.S. generation by 2030. Premium pricing follows the newest builds owing to their liquid cooling, extra switchgear and on-site substations, while legacy halls face retrofit pressures. The clustering of these sites in the southern metro is forming purpose-built utility zones where redundant transmission, looped fiber and 100-acre parcels converge.
Edge-Computing and Latency-Sensitive Workloads: Driving Urban Deployments
Mobile gaming, tele-health and financial-trading platforms are spurring a lattice of micro-facilities across downtown Atlanta. American Tower has added edge nodes near Peachtree Center to keep hop counts under five milliseconds. Vapor IO and Comcast are piloting last-mile edge services to dovetail with existing cable plant. EdgeConneX operates two sites totaling 16 MW within a three-mile radius of city hall. These deployments trim network latency for AI inference, interactive media and autonomous-vehicle telemetry, positioning metro Atlanta as both a core and edge nexus.
Utility Power-Delivery Lead-Times: Critical Infrastructure Bottleneck
Georgia Power expects industrial electricity demand to multiply 17-fold by 2035, with data centers absorbing 80% of that growth. Average lead times for high-voltage extensions approach four years, forcing phased build-outs and on-site gas turbine deployments. Metro mayors warn that 8.2 GW of extra capacity is required by 2030 to keep pace with bookings. New state rules now compel large projects to co-fund sub-station upgrades to shield residential customers from rate hikes.
Other drivers and restraints analyzed in the detailed report include:
- Georgia Tax and Renewable-Energy Incentives: Fiscal Catalysts
- Surging AI Power Constraints in NoVA Divert Demand: Geographic Redistribution
- Escalating Land and Construction Costs: Economic Pressure Points
For complete list of drivers and restraints, kindly check the Table Of Contents.
Segment Analysis
Mega sites held 53.12% of Atlanta data center market share in 2025, translating into 467.5 MW of active IT capacity in 2025. This dominance pushes the Atlanta data center market size for mega builds toward 1.57 GW by mid-decade as announced expansions come online. Economies of scale allow operators to undercut power costs and deploy SCADA-enabled distribution at room scale rather than row scale. Amazon Web Services' USD 11 billion Georgia program involves multiple 100 MW+ blocks and sets a blueprint for campus-style resiliency. The Massive tier (20-100 MW) is forecast to climb 28.73% annually as second-tier clouds and SaaS vendors secure future-proven footprints. Meanwhile, Medium and Large categories remain relevant for private-cloud transition workloads, edge caching and compliance-driven isolation zones. Smaller (sub-5 MW) halls have pivoted toward telco edge clusters and research labs that prize proximity over watt scale.
Economically, mega campuses secure PUE values near 1.2 by integrating rooftop heat-exchanger loops and on-site chilled-water plants. Land aggregation tactics bundle parcels into 200-acre super sites, reducing municipal approvals per megawatt delivered. The strategy also supports multi-building phasing that aligns capital draws with pre-leased commitments, preserving developer IRRs. Over the next five years, the Atlanta data center market is expected to shift another 12 percentage points toward mega and massive stock as AI rack densities exceed 80 kW and require specialized power trenways.
Tier 3 inventory occupied 65.72% of active floor space in 2025, underlining its status as the standard for mission-critical yet cost-sensitive deployments. The Atlanta data center market size allocated to Tier 3 halls is projected to surpass 2.42 GW by 2031 as enterprises retire on-premises server rooms. However, Tier 4 is registering a 28.54% CAGR, buoyed by machine-learning clusters, fintech clearing systems and defense workloads that cannot tolerate a single point of failure. Operators justify the capex premium by commanding service-level agreements featuring five-nines uptime and shorter mean-time-to-repair. Flexential's Alpharetta site illustrates Tier 4 economics with liquid cooling, up-flow containment and 1,500 W per square foot densities.
Tier 1 and Tier 2 footprints cater mainly to archival storage, staging areas and disaster-recovery seats, but their share is sliding as price differentials narrow. Design trends show Tier 3 sites integrating selective Tier 4 attributes-dual utility feeds, segmented busways and battery-energy-storage systems-to future-proof assets without a full Tier 4 price tag.
Complete Report Scope:
- By Data Center Size
- Small
- Medium
- Large
- Hyperscale
- By Tier Type
- Tier 1 and 2
- Tier 3
- Tier 4
- By Data Center Type
- Cloud Service Providers (CSPs)
- Enterprise, Modular and Edge
- Colocation
- Non-Utilized
- Utilized
- Colocation Type
- Retail
- Wholesale
- Colocation Type
- By End User Industry
- Cloud and IT
- Telecom
- Media and Entertainment
- Government
- BFSI
- Manufacturing
- E-Commerce
- Other End User
List of Companies Covered in this Report:
- QTS Realty Trust
- Vantage Data Centers Management Company, LLC
- EDC VENTURE LLC (Edged)
- Digital Realty Trust Inc.
- Quadranet Systems Limited
- H5 Data Centers
- DataBank Holdings Ltd.
- EVODC, LLC (Evocative)
- Krypt
- Lumen Technologies
- Cogent Communications Holdings, Inc.
- Assurant, Inc.
- Csquare (Phoenix Infrastructure LLC)
- Summit Hosting
- EdgeConneX, Inc.
- Equinix Inc.
- Apotech Group
- Vault Networks, Inc.
- Coloblox Data Centers
- CoreSite
- Enzu Inc.
Additional Benefits:
- The market estimate (ME) sheet in Excel format
- 3 months of analyst support
TABLE OF CONTENTS
1 INTRODUCTION
- 1.1 Study Assumptions and Market Definition
- 1.2 Scope of the Study
2 RESEARCH METHODOLOGY
3 EXECUTIVE SUMMARY
4 MARKET LANDSCAPE
- 4.1 Market Overview
- 4.2 Market Drivers
- 4.2.1 AI / cloud-led hyperscale builds
- 4.2.2 Edge-computing and latency-sensitive workloads
- 4.2.3 Georgia tax and renewable-energy incentives
- 4.2.4 Surging AI power constraints in NoVA divert demand
- 4.2.5 Surplus dark-fiber along I-285 and I-20 corridors
- 4.2.6 Sub-sea cable upgrade via Myrtle Beach landing
- 4.3 Market Restraints
- 4.3.1 Utility power-delivery lead-times
- 4.3.2 Escalating land and construction costs
- 4.3.3 Prospective water-usage restrictions for cooling
- 4.3.4 Skilled labor gap for high-density builds
- 4.4 Digital Infrastructure Indicators
- 4.4.1 Smartphone Users
- 4.4.2 Data Traffic per Smartphone
- 4.4.3 Mobile Data Speed
- 4.4.4 Broadband Data Speed
- 4.5 Value / Supply-Chain Analysis
- 4.6 Regulatory Landscape
- 4.7 Technological Outlook
- 4.8 Assessment of the impact of Macro Economic Trends on the Market
- 4.9 Porter's Five Forces
- 4.9.1 Bargaining Power of Suppliers
- 4.9.2 Bargaining Power of Buyers
- 4.9.3 Threat of New Entrants
- 4.9.4 Threat of Substitutes
- 4.9.5 Competitive Rivalry
5 MARKET SIZE AND GROWTH FORECASTS (MW)
- 5.1 By Data Center Size
- 5.1.1 Small
- 5.1.2 Medium
- 5.1.3 Large
- 5.1.4 Hyperscale
- 5.2 By Tier Type
- 5.2.1 Tier 1 and 2
- 5.2.2 Tier 3
- 5.2.3 Tier 4
- 5.3 By Data Center Type
- 5.3.1 Cloud Service Providers (CSPs)
- 5.3.2 Enterprise, Modular and Edge
- 5.3.3 Colocation
- 5.3.3.1 Non-Utilized
- 5.3.3.2 Utilized
- 5.3.3.2.1 Colocation Type
- 5.3.3.2.1.1 Retail
- 5.3.3.2.1.2 Wholesale
- 5.3.3.2.1 Colocation Type
- 5.4 By End User Industry
- 5.4.1 Cloud and IT
- 5.4.2 Telecom
- 5.4.3 Media and Entertainment
- 5.4.4 Government
- 5.4.5 BFSI
- 5.4.6 Manufacturing
- 5.4.7 E-Commerce
- 5.4.8 Other End User
6 COMPETITIVE LANDSCAPE
- 6.1 Market Concentration
- 6.2 Strategic Moves
- 6.3 Market Share Analysis (MW)
- 6.4 Company Profiles (includes Global level Overview, Market level overview, Core Segments, Financials as available, Strategic Information, Market Rank/Share for key companies, Products and Services, and Recent Developments)
- 6.4.1 QTS Realty Trust
- 6.4.2 Vantage Data Centers Management Company, LLC
- 6.4.3 EDC VENTURE LLC (Edged)
- 6.4.4 Digital Realty Trust Inc.
- 6.4.5 Quadranet Systems Limited
- 6.4.6 H5 Data Centers
- 6.4.7 DataBank Holdings Ltd.
- 6.4.8 EVODC, LLC (Evocative)
- 6.4.9 Krypt
- 6.4.10 Lumen Technologies
- 6.4.11 Cogent Communications Holdings, Inc.
- 6.4.12 Assurant, Inc.
- 6.4.13 Csquare (Phoenix Infrastructure LLC)
- 6.4.14 Summit Hosting
- 6.4.15 EdgeConneX, Inc.
- 6.4.16 Equinix Inc.
- 6.4.17 Apotech Group
- 6.4.18 Vault Networks, Inc.
- 6.4.19 Coloblox Data Centers
- 6.4.20 CoreSite
- 6.4.21 Enzu Inc.
7 MARKET OPPORTUNITIES AND FUTURE OUTLOOK
- 7.1 White-space and Unmet-need Assessment


