

|
시장보고서
상품코드
2119615
인도의 위성 영상 서비스 시장 : 점유율 분석, 업계 동향과 통계, 성장 예측(2026-2031년)India Satellite Imagery Services - Market Share Analysis, Industry Trends & Statistics, Growth Forecasts (2026 - 2031) |
||||||
 Mordor Intelligence
Mordor Intelligence에 의하면, 인도의 위성 영상 서비스 시장 규모는 2025년 3억 3,000만 달러에서 2026년에는 3억 8,650만 달러로 확대되어 2026년부터 2031년까지 CAGR 17.12%로 성장을 지속하여, 2031년에는 8억 5,180만 달러에 이를 것으로 예측됩니다.
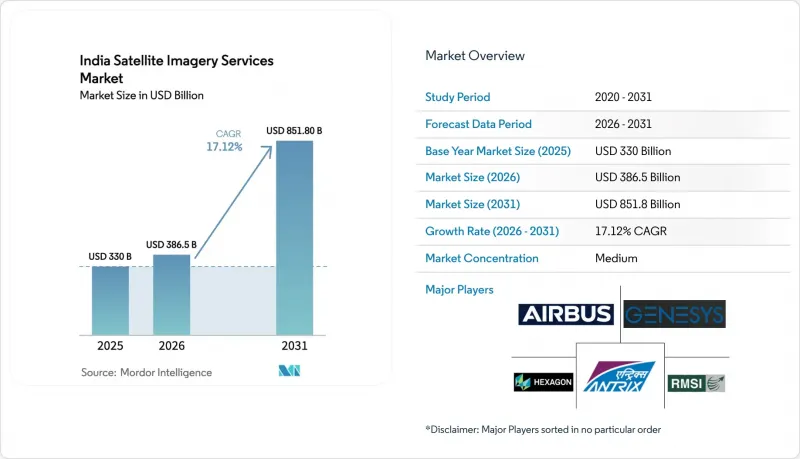
본 보고서는 용도별(지리공간 데이터 수집 및 매핑, 천연자원 관리 등), 최종 사용자별(정부, 건설 및 인프라 등), 서비스 유형별(원시 위성 데이터, 부가가치 분석 등), 그리고 촬영 유형별(해상도 및 스펙트럼 모드)로 분류되어 있습니다. 시장 예측은 금액(달러) 단위로 제시되어 있습니다.
인도 위성 영상 서비스 시장 동향 및 인사이트
2025년 이후 민관 협력을 통한 지구관측(EO) 위성 발사
IN-SPACe의 인가에 따라 발사 시장이 민간 기업에 개방되어, 2025년 1월에 발사된 Pixxel사의 3기 하이퍼스펙트럼 위성 클러스터와 같은 위성 군집이 실현되었습니다. 벤처 자금과 150억 루피 규모의 민관 공동 입찰이 맞물려, 세계적인 대기업과 현지 스타트업 기업을 유치하며 재촬영 간격을 1일 미만으로 단축하고 있습니다. 접근 비용의 하락으로 인해 보험사, 농업 기술 기업, 물류 사업자의 진입 장벽이 낮아지면서 인도의 위성 영상 서비스 시장은 확대되고 있습니다. BlackSky 및 Thales Alenia Space와의 제휴를 통해 고도화된 작업 관리 능력과 클라우드 전송 능력이 도입되면서, 국내 분석 역량이 강화되고 있습니다. 그 결과, 이미지 공급량이 과거 수요를 상회할 것으로 예상되며, 시장 역학은 ‘데이터 부족’에서 ‘부가가치를 통한 차별화’로 전환되고 있습니다.
국방 및 국경 관리 디지털화 프로그램
52기의 위성을 아우르는 SBS-3 프로그램은 분쟁 중인 국경 지역을 대상으로 한 전천후 감시에 대한 지속적인 자금 지원을 약속하고 있습니다. 이중 용도 페이로드는 특히 인프라 보안 및 자원 모니터링 분야에서 상업적 파급 효과를 창출하여, 이를 통해 인도의 위성 영상 서비스 시장을 심화시키고 있습니다. 위성 간 링크와 AI를 활용한 탑재체 처리를 통해 의사결정 주기가 수 시간에서 수 분으로 단축되면서, 거의 실시간으로 업데이트되는 분석 대시보드에 대한 수요가 증가하고 있습니다. 국산 조달 조항은 민간 제조업체로의 기술 이전을 촉진하고, 광학, SAR, 추진 서브시스템 분야의 현지 조달률을 높이고 있습니다. 군사 발사 속도가 꾸준히 유지됨에 따라, 평시 기간 동안 민간 고객이 기회를 포착하여 임대할 수 있는 기반 역량이 확보되고 있습니다.
2018년 기준보다 낮은 1미터 미만의 IRS 이미지에 대한 유료 접근
NewSpace India Limited사가 서브미터급 아카이브 데이터를 유료 모델로 전환함에 따라, 농업 기술, 임업, 도시 계획 분야의 스타트업 기업의 입력 비용이 상승했습니다. 스타트업 기업들은 현재 인도의 기존 데이터를 구매할지, 아니면 더 새로운 외국 이미지를 확보할지 고민하고 있으며, 이는 국내 역량 구축을 저해하고 있습니다. ‘국가 지리공간 정책’에 따라 사전 승인 요건은 철폐되었으나, 경쟁력 있는 민간 위성 군이 충분히 확대되어 국내 가격을 낮출 때까지는 자금 조달 격차가 여전히 남아 있습니다.
부문별 분석
지리공간 데이터 수집 및 매핑은 2025년 매출의 28.24%를 차지하며, 토지 대장 현대화 추진 및 전국적인 지적 조사 동향을 반영하고 있습니다. 인도의 위성 영상 서비스 시장은 예측 가능한 정부 조달 주기의 혜택을 받고 있으며, 광학,SAR, LiDAR 기반 제품에 대한 최소한의 이용 수요가 보장되고 있습니다. 62만 개의 마을에서 의무화된 고유 토지 구획 ID로 인해 정사 보정 모자이크 이미지에 대한 연간 수요가 확대되고 있는 한편, 농촌 개발 기관은 자산 감사를 위해 시계열 레이어를 추가하고 있습니다. 이와 동시에, 재난 관리 당국은 업데이트 빈도가 높은 이미지를 사이클론 대응 워크플로에 통합하여, 일회성 프로젝트를 다년간의 서비스 계약으로 전환하고 있습니다.
보조금 지급 기준이 구획 수준의 지표로 전환됨에 따라 정밀 농업은 연평균 성장률(CAGR) 17.6%로 확대되고 있습니다. 위성을 활용한 영양 결핍 지도가 일률적인 비료 기준을 대체하면서, 비료 제조업체들이 이미지 구매 자금을 지원하도록 유도하고 있습니다. 협동조합 은행은 계절별 바이오매스 점수를 대출 앱에 통합하여, 인도 위성 영상 서비스 시장의 농촌 지역 내 확산 범위를 확대되고 있습니다. 장기적으로는 지속적인 농업 수요가 매핑 시장의 점진적인 성숙을 상쇄하여, 가격에 민감한 사용자층 전반에 걸쳐 수익원을 다각화하면서도 높은 수익률을 보이는 분석 비즈니스 기회를 유지하고 있습니다.
2025년 매출의 41.88%를 정부 기관이 차지하고 있으며, 턴키 방식의 이미지 패키지에 의존하는 국방, 농촌 개발, 스마트 시티 관련 지출이 이를 뒷받침하고 있습니다. 중앙 정부 기관은 프로젝트별 타일이 아닌 주 전체 라이선스를 구매하고 있으며, 이는 판매량 증가를 뒷받침하는 한편, 재입찰 시에는 가격 압박 요인이 되고 있습니다. 예산 규모는 크지만 조달 절차의 경직성으로 인해 기동성이 높은 민간 고객이 진입할 여지가 남아 있습니다.
금융 및 보험 업계는 작물 수확량 지수, 부동산 리스크 점수, 실시간 홍수 경보 등을 원동력으로 연평균 성장률(CAGR) 18.02%의 성장 궤도에 올라 있습니다. Sentinel-1 기반의 보험금 지급 모델로 인해 보험금 지급 지연이 40% 단축됨에 따라, 보험사들은 시즌 전체에 걸친 모니터링 피드를 계약하고 있습니다. 은행들은 유사한 분석을 주택담보대출 포트폴리오로 확대하여 지리공간 리스크 대시보드를 수익화하고 있습니다. 자본 투자가 많이 필요한 라이선싱 방식 대신 거래 기반 가격 책정이 도입됨에 따라, 정기적인 수익이 인도 위성 영상 서비스 시장에서 고객 충성도를 높이고 있습니다.
기타 혜택:
- 엑셀 형식 시장 예측(ME) 시트
- 3개월간의 애널리스트 지원
자주 묻는 질문
목차
제1장 서론
제2장 조사 방법
제3장 개요
제4장 시장 구도
제5장 시장 규모와 성장 예측
제6장 경쟁 구도
제7장 시장 기회와 향후 전망
JHS 26.09.03According to Mordor Intelligence, the India satellite imagery services market size is expected to grow from USD 330 million in 2025 to USD 386.5 million in 2026 and is forecast to reach USD 851.8 million by 2031 at 17.12% CAGR over 2026-2031.
This report is Segmented by Application (Geospatial Data Acquisition and Mapping, Natural Resource Management, and More), End-User (Government, Construction and Infrastructure, and More), Service Type (Raw Satellite Data, Value-Added Analytics, and More), and Imaging Type (Resolution and Spectral Modality). The Market Forecasts are Provided in Terms of Value (USD).
India Satellite Imagery Services Market Trends and Insights
Public-private EO satellite launches post-2025
IN-SPACe clearances opened the launch market to private firms, enabling constellations such as Pixxel's three-satellite hyperspectral cluster that flew in January 2025. Venture funding coupled with a Rs 1,500 crore public-private tender attracts global primes and local start-ups, driving revisit times down to sub-daily windows. Cheaper access lowers entry barriers for insurers, agritech firms and logistics operators, widening the India satellite imagery services market. Partnerships with BlackSky and Thales Alenia Space inject advanced tasking and cloud delivery capabilities, strengthening domestic analytics depth. As a result, imagery supply is set to outpace historical demand, pivoting market dynamics from data scarcity to value-added differentiation.
Defense and border management digitization programs
The SBS-3 program covering 52 satellites commits sustained funding to all-weather surveillance along contested borders. Dual-use payloads generate commercial spillovers, especially in infrastructure security and resource monitoring, thereby deepening the India satellite imagery services market. Inter-satellite links and AI-enabled onboard processing shrink decision loops from hours to minutes, feeding demand for near-real-time analytics dashboards. Indigenous sourcing clauses foster technology transfer to private manufacturers, lifting local content in optical, SAR and propulsion subsystems. The sustained cadence of military launches ensures baseline capacity that private clients can opportunistically lease during peacetime windows.
Fee-based access to less than 1 m IRS imagery below 2018 baseline
NewSpace India Limited shifted sub-meter archives to a paid model, raising input costs for agritech, forestry and urban-planning start-ups.Start-ups now weigh paying for legacy Indian data against sourcing fresher foreign imagery, which undercuts domestic capacity-building. Although the National Geospatial Policy removes prior-approval hurdles, the funding gap persists until competitive private constellations scale sufficiently to lower domestic prices.
Other drivers and restraints analyzed in the detailed report include:
- Precision-agri subsidy schemes (e-NAM 2.0, Digital Ag Mission)
- Mandated LiDAR-based city planning for Smart-Cities 2.0
- Data-localization and multi-agency clearance delays
For complete list of drivers and restraints, kindly check the Table Of Contents.
Segment Analysis
Geospatial Data Acquisition and Mapping commanded 28.24% of 2025 revenues, mirroring the land-record modernization push and nationwide cadastral surveys. The India satellite imagery services market benefits from predictable government procurement cycles, ensuring baseline utilization for optical, SAR and LiDAR-derived products. Mandated Unique Land Parcel IDs across 620,000 villages enlarge annual demand for ortho-rectified mosaics, while rural development agencies add time-series layers for asset audits. In parallel, disaster-management authorities integrate high-refresh imagery into cyclone preparedness workflows, converting episodic projects into multiyear service agreements.
Precision Agriculture expands at a 17.6% CAGR as subsidy disbursals pivot to plot-level indicators. Satellite-enabled nutrient deficiency maps replace blanket fertilizer norms, nudging fertilizer firms to fund imagery purchases. Cooperative banks embed seasonal biomass scores into lending apps, widening the India satellite imagery services market's rural footprint. Over time, sustained agri demand offsets mapping's gradual maturation, diversifying revenue streams across more price-sensitive user groups while preserving high-margin analytics opportunities.
Government buyers represented 41.88% of 2025 turnover, buoyed by defense, rural-development and smart-city outlays that rely on turnkey imagery bundles. Central agencies purchase statewide licenses rather than project-specific tiles, underpinning volume growth but exerting price pressure during rebids. Despite budget heft, procurement rigidity leaves white spaces open to agile private customers.
Financial Services and Insurance is on track for an 18.02% CAGR, fed by crop-yield indices, property-risk scores and real-time flood alerts. Sentinel-1-based indemnity models cut claim-settlement lags by 40%, prompting insurers to subscribe to season-long monitoring feeds. Banks extend similar analytics to mortgage portfolios, monetizing geospatial risk dashboards. As transaction-based pricing replaces capex-heavy licensing, recurring revenues deepen stickiness within the India satellite imagery services market.
Complete Report Scope:
- By Application
- Geospatial Data Acquisition and Mapping
- Natural Resource Management
- Surveillance and Security
- Conservation and Research
- Disaster Management
- Intelligence
- Urban Planning and Smart Cities
- Precision Agriculture
- By End-User
- Government
- Construction and Infrastructure
- Transportation and Logistics
- Military and Defense
- Forestry and Agriculture
- Energy and Utilities
- Financial Services and Insurance
- Other End-Users
- By Service Type
- Raw Satellite Data
- Value-Added Analytics
- Platform-as-a-Service / API Access
- By Imaging Type
- Resolution
- Very High ( less than 0.5 m)
- High (0.5-1 m)
- Medium (1-5 m)
- Low ( above 5 m)
- Spectral Modality
- Optical
- Synthetic Aperture Radar (SAR)
- Hyperspectral
- Resolution
List of Companies Covered in this Report:
- Airbus SE
- Genesys International Corporation Limited
- Antrix Corporation Limited
- Hexagon AB
- RMSI Private Limited
- Maxar Technologies Inc.
- C.E. Info Systems Limited (MapmyIndia)
- Rolta India Limited
- Quantduo Technologies Private Limited
- GIS Consortium India Private Limited
- SatSure Analytics India Private Limited
- Planet Labs PBC
- Pixxel Space Technologies Private Limited
- Capella Space Corp.
- BlackSky Technology Inc.
- Satellogic USA Inc.
- NewSpace India Limited
- Spatial Views Private Limited
- GeoSpoc Geospatial Services Private Limited
- Earth-i Limited
- Kawa Space Private Limited
Additional Benefits:
- The market estimate (ME) sheet in Excel format
- 3 months of analyst support
TABLE OF CONTENTS
1 INTRODUCTION
- 1.1 Study Assumptions and Market Definition
- 1.2 Scope of the Study
2 RESEARCH METHODOLOGY
3 EXECUTIVE SUMMARY
4 MARKET LANDSCAPE
- 4.1 Market Overview
- 4.2 Market Drivers
- 4.2.1 Public-private EO satellite launches post-2025
- 4.2.2 Defence and border management digitisation programmes
- 4.2.3 Precision-agri subsidy schemes (e-NAM 2.0, Digital Ag Mission)
- 4.2.4 Mandated LiDAR-based city planning for Smart-Cities 2.0
- 4.2.5 Cat-6 cyclone early-warning upgrade roadmap
- 4.2.6 Satellite-IoT back-haul for nationwide 5G densification
- 4.3 Market Restraints
- 4.3.1 Fee-based access to less than 1 m IRS imagery below 2018 baseline
- 4.3.2 Data-localisation and multi-agency clearance delays
- 4.3.3 Limited interoperability across state-run data portals
- 4.3.4 Shortage of hyperspectral image analysts
- 4.4 Regulatory Landscape
- 4.5 Technological Outlook
- 4.6 Porter's Five Forces Analysis
- 4.6.1 Bargaining Power of Buyers
- 4.6.2 Bargaining Power of Suppliers
- 4.6.3 Threat of New Entrants
- 4.6.4 Threat of Substitutes
- 4.6.5 Intensity of Competitive Rivalry
5 MARKET SIZE AND GROWTH FORECASTS (VALUE)
- 5.1 By Application
- 5.1.1 Geospatial Data Acquisition and Mapping
- 5.1.2 Natural Resource Management
- 5.1.3 Surveillance and Security
- 5.1.4 Conservation and Research
- 5.1.5 Disaster Management
- 5.1.6 Intelligence
- 5.1.7 Urban Planning and Smart Cities
- 5.1.8 Precision Agriculture
- 5.2 By End-User
- 5.2.1 Government
- 5.2.2 Construction and Infrastructure
- 5.2.3 Transportation and Logistics
- 5.2.4 Military and Defense
- 5.2.5 Forestry and Agriculture
- 5.2.6 Energy and Utilities
- 5.2.7 Financial Services and Insurance
- 5.2.8 Other End-Users
- 5.3 By Service Type
- 5.3.1 Raw Satellite Data
- 5.3.2 Value-Added Analytics
- 5.3.3 Platform-as-a-Service / API Access
- 5.4 By Imaging Type
- 5.4.1 Resolution
- 5.4.1.1 Very High ( less than 0.5 m)
- 5.4.1.2 High (0.5-1 m)
- 5.4.1.3 Medium (1-5 m)
- 5.4.1.4 Low ( above 5 m)
- 5.4.2 Spectral Modality
- 5.4.2.1 Optical
- 5.4.2.2 Synthetic Aperture Radar (SAR)
- 5.4.2.3 Hyperspectral
- 5.4.1 Resolution
6 COMPETITIVE LANDSCAPE
- 6.1 Market Concentration
- 6.2 Strategic Moves
- 6.3 Market Share Analysis
- 6.4 Company Profiles (includes Global level Overview, Market level overview, Core Segments, Financials as available, Strategic Information, Market Rank/Share for key companies, Products and Services, and Recent Developments)
- 6.4.1 Airbus SE
- 6.4.2 Genesys International Corporation Limited
- 6.4.3 Antrix Corporation Limited
- 6.4.4 Hexagon AB
- 6.4.5 RMSI Private Limited
- 6.4.6 Maxar Technologies Inc.
- 6.4.7 C.E. Info Systems Limited (MapmyIndia)
- 6.4.8 Rolta India Limited
- 6.4.9 Quantduo Technologies Private Limited
- 6.4.10 GIS Consortium India Private Limited
- 6.4.11 SatSure Analytics India Private Limited
- 6.4.12 Planet Labs PBC
- 6.4.13 Pixxel Space Technologies Private Limited
- 6.4.14 Capella Space Corp.
- 6.4.15 BlackSky Technology Inc.
- 6.4.16 Satellogic USA Inc.
- 6.4.17 NewSpace India Limited
- 6.4.18 Spatial Views Private Limited
- 6.4.19 GeoSpoc Geospatial Services Private Limited
- 6.4.20 Earth-i Limited
- 6.4.21 Kawa Space Private Limited
7 MARKET OPPORTUNITIES AND FUTURE OUTLOOK
- 7.1 White-space and Unmet-Need Assessment


