
|
시장보고서
상품코드
2119652
서버 운영체제 : 시장 점유율 분석, 업계 동향과 통계, 성장 예측(2026-2031년)Server Operating System - Market Share Analysis, Industry Trends & Statistics, Growth Forecasts (2026 - 2031) |
||||||
 Mordor Intelligence
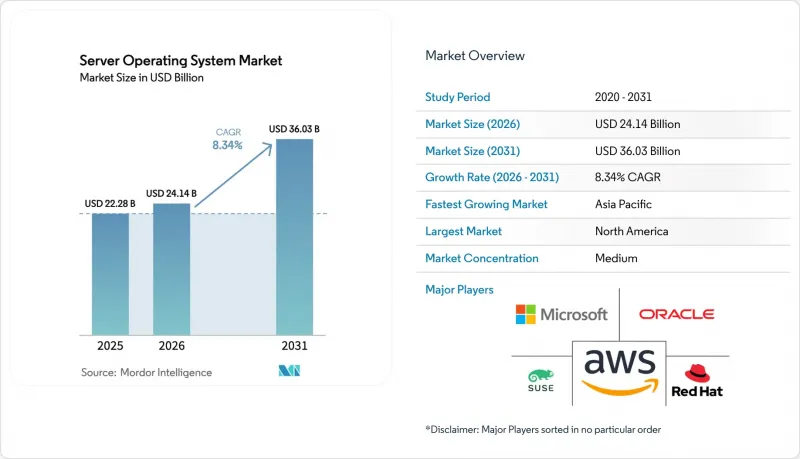
Mordor Intelligence에 따르면 2026년 서버 운영체제 시장 규모는 241억 4,000만 달러로 추정되며, 2025년 222억 8,000만 달러에서 성장하여 2031년에는 360억 3,000만 달러에 달할 것으로 예측됩니다.
2026년부터 2031년까지의 연평균 성장률(CAGR)은 8.34%가 될 것으로 전망됩니다.
시장은 구성요소(소프트웨어, 서비스), 라이선스 모델(상업용 독점 등), 유형(Windows, Linux 등), 서버 아키텍처(x86/X64 등), 가상화 상태(가상 서버 등), 도입 형태(클라우드, 온프레미스, 하이브리드), 기업 규모(대기업, 중소기업), 산업 분야(IT·통신, BFSI, 기타), 및 지역별로 분류됩니다.
세계 서버 운영체제 시장의 동향 및 인사이트
클라우드 우선의 기업 혁신 주기
각 조직은 하드웨어 교체에 그치지 않고 인프라 현대화를 추진하고 있으며, 온프레미스 환경에서 클라우드와 동등한 기능을 제공하는 운영체제를 선택하고 있습니다. Windows Server 2025는 Azure Arc와의 네이티브 통합 및 핫패치 업데이트 기능을 갖추고 있어 다운타임을 단축하고 워크로드 마이그레이션을 원활하게 합니다. 의료 서비스 제공업체인 Kaleida Health는 하이퍼바이저 통합과 소프트웨어 정의 인프라를 통해 연간 500만-1,000만 달러의 비용 절감을 기대하고 있습니다. 각 벤더들은 이러한 요구에 부응하기 위해 노력하고 있으며, Red Hat은 현재 Azure에서 Enterprise Linux AI를 제공함으로써 하이브리드 AI 도입을 간소화하고 있습니다. 기업들은 단일 제어 플레인, 자동화된 라이프사이클 관리, 예측 가능한 비용 모델을 기대하고 있습니다. 그 결과, 서버 운영체제 시장에서 여러 거점에 걸쳐 있는 전체 환경에 걸쳐 라이선싱, 텔레메트리, 보안을 조화시키는 솔루션에 대한 수요가 지속되고 있습니다.
하이퍼스케일 데이터센터의 확장
클라우드 제공업체들은 자본 집약도를 지속적으로 높이고 있습니다. 마이크로소프트는 AI 지원 시설에 800억 달러를 배정하고 있으며, 한편 구글은 같은 기간 동안 750억 달러를 계획하고 있습니다. 규모 확대에 따라 수만 대의 노드가 하나의 논리적 컴퓨터로 기능할 수 있도록 운영체제를 재설계하는 작업이 진행되고 있습니다. 1킬로와트 단위의 전력 효율을 극대화하기 위해 전력 제한, 실리콘 가속기, 텔레메트리 API가 커널 수준에 통합되었습니다. 이러한 규모의 컴퓨팅 리소스 집약은 ARM 및 맞춤형 실리콘에 특화된 새로운 배포판의 개발을 촉진하고, 서버 운영체제 시장의 잠재적 고객 기반을 확대하고 있습니다. 원자력 및 재생에너지와의 제휴는 비용 압박을 부각시키고 있으며, OS에서 에너지 효율을 고려한 스케줄링이 경쟁상의 차별화 요소가 되고 있습니다.
높은 마이그레이션 비용 및 다운타임 비용
Hitachi Data Systems에 따르면, 테스트, 직원 재교육, 서비스 기간을 포함하면 미션 크리티컬 워크로드의 마이그레이션에는 1테라바이트당 15,000달러 이상의 비용이 소요될 수 있습니다. 레거시 애플리케이션에 대한 의존으로 인해 직접적인 업그레이드는 위험을 수반하므로, 일부 기업은 가상화 래퍼 도입을 선택할 수밖에 없습니다. CentOS의 지원 종료는 이러한 위험을 여실히 드러냈습니다. 스캔된 리눅스 서버의 26%가 몇 달 이내에 교체가 필요했던 것입니다. 기업들이 비즈니스에 미치는 영향을 최소화하기 위해 단계적인 마이그레이션을 모색함에 따라 전문 서비스에 대한 수요가 급증하고 있습니다. 비용에 대한 민감성으로 인해 단기적인 전환이 더뎌지면서 서버 운영체제 시장의 성장이 억제되고 있습니다.
부문 분석
2025년에는 구독형 라이선싱과 지속적인 업데이트를 기반으로 소프트웨어가 매출의 61.85%를 차지하며, 서버 운영체제 시장의 경제적 기반으로 자리매김할 것입니다. 기업들은 예측 가능한 운영 비용과 클라우드 콘솔과의 직접 연동을 중시하고 있으며, 이로 인해 벤더 종속성은 강화되지만 조달은 간소화됩니다. 벤더들은 텔레메트리, 정책 엔진, 비용 거버넌스 기능을 통합함으로써 기존 OS의 경계를 모호하게 만들고 시장 점유율을 확대하고 있습니다. 서비스 분야는 하이브리드 환경의 확대에 따라 2031년까지 연평균 성장률(CAGR) 10.58%를 기록할 전망입니다. CentOS에서 마이그레이션, 메인프레임 오프로드 프로젝트, 엣지 환경으로의 확장 등 모든 분야에서 자문, 설계, 매니지드 서비스가 요구되고 있습니다. 각 제공업체는 라이선스, 튜닝, 규제 대응을 묶은 패키지형 서비스를 구축하고 있습니다. 운영 환경이 멀티 클라우드 및 엣지로 확대됨에 따라 전문적인 매니지드 서비스가 필수화되어, 서버 운영체제 시장의 성장세를 뒷받침하고 있습니다.
2025년에는 상용 독점 라이선스가 39.10%의 점유율을 차지했으며, 이는 디렉터리 중심의 워크로드에서 Windows Server의 우위를 반영한 것입니다. 그러나 기업들이 자본 지출에서 종량제 유틸리티 모델로 전환함에 따라, 구독형 SaaS 모델은 연평균 성장률(CAGR) 9.82%로 가장 높은 성장률을 보이고 있습니다. Red Hat과 같은 벤더들은 워크로드의 피크에 비례하여 선형적으로 확장되는 코어 단위 및 노드 단위 요금 체계를 정교화하고 있습니다. CentOS 7의 지원 종료에 따라 커뮤니티 배포판의 점유율은 감소하고 있으며, 프로덕션 환경의 사용자들은 지원 대상인 배포판으로 전환하고 있습니다. 기업들은 규정 준수 증명 및 보상을 유료 리눅스를 채택하는 이유로 꼽고 있습니다. 이러한 변화는 서버 운영체제 시장에서 사용량 기반 가격 책정이 점점 더 가치를 결정하는 요소가 되고 있음을 여실히 보여줍니다.
리눅스는 컨테이너, 클라우드, HPC(고성능 컴퓨팅) 분야의 강점을 바탕으로 2025년에는 44.25%의 점유율을 차지했습니다. 윈도우는 ARM64 지원과 Azure와의 긴밀한 통합에 힘입어 2031년까지 연평균 성장률(CAGR) 9.62%를 유지하고 있습니다. 유닉스는 독점적인 RISC 하드웨어의 노후화에 따라 장기적인 감소 추세를 보이고 있지만, 통신 업계의 과금 시스템이나 금융 거래 분야에서는 여전히 일정한 수요가 남아 있습니다. 워크로드의 적합성이 선택을 좌우하고 있으며, 리눅스는 클라우드 네이티브 마이크로서비스 분야에서 지배적인 위치를 차지하는 반면, 윈도우는 ERP 및 ID 관리 서비스에서 견조한 성장세를 유지하고 있습니다. AI 파이프라인 및 엣지 자율화를 위해 최적화된 새로운 배포판이 등장하고 선택지가 다양해짐에 따라, 서버 운영체제 시장의 경쟁 구도가 더욱 확대되고 있습니다.
지역별 분석
북미는 마이크로소프트, 구글, AWS의 하이퍼스케일 투자에 힘입어 2025년에는 매출의 36.25%를 차지하며 1위를 차지했습니다. 마이크로소프트만 해도 차세대 AI 시설에 800억 달러의 예산을 책정하고 있습니다. 캐나다에서 도입이 예정된 컴퓨터실용 공조 설비의 효율화 규제는 지속가능한 인프라를 중시하고 있습니다. 멕시코의 제조업 확대는 산업용 서버 수요를 끌어올려, 서버 운영체제 시장에서 해당 지역의 주도적 지위를 더욱 공고히 하고 있습니다.
아시아태평양은 2031년까지 연평균 성장률(CAGR) 11.02%로 가장 높은 성장률을 기록할 전망입니다. 중국의 클라우드 시장은 2025년까지 1조 위안 규모를 돌파할 궤도에 올랐습니다. 한국 MSP(관리형 서비스 제공업체)의 매출 증가와 2024년에 5조 1,000억 원에 달하며 72.7%의 성장률을 기록한 GPU 서버 판매는 AI의 파급 효과를 여실히 보여주고 있습니다. 일본에서는 감사 도구 및 보안 규정 준수를 통해 견고해진 플랫폼에 대한 수요가 높아지고 있습니다. 지역 정책에 따라 국내 ISA가 추진되고 있으며, 멀티아크 OS 지원이 필수 조건으로 자리 잡으면서 서버 운영체제 시장에서의 도입 기회가 확대되고 있습니다.
유럽에서는 에너지 효율 지침에 따라 IT 부하가 100kW를 초과하는 사업자가 2024년 9월까지 에너지 KPI 공표를 의무화함에 따라, 꾸준한 보급이 진행되고 있습니다. 사업자들은 이 보고 의무를 충족하기 위해 OS 텔레메트리 확장 기능을 채택하고 있습니다. 독일, 프랑스, 영국이 기업의 리프레시 주기를 주도하는 한편, 동유럽 회원국에서는 주권형 오픈 소스 스택의 도입이 검토되고 있습니다. 규제의 일관성이 구매 기준을 형성하며, 서버 운영체제 시장의 꾸준한 성장을 뒷받침하고 있습니다.
기타 혜택:
- 엑셀 형식의 시장 전망(ME) 시트
- 3개월간의 애널리스트 지원
자주 묻는 질문
목차
제1장 소개
제2장 조사 방법
제3장 주요 요약
제4장 시장 구도
제5장 시장 규모와 성장 예측
제6장 경쟁 구도
제7장 시장 기회와 향후 동향
KSM 26.09.03According to Mordor Intelligence, server operating system market size market size in 2026 is estimated at USD 24.14 billion, growing from 2025 value of USD 22.28 billion with 2031 projections showing USD 36.03 billion, growing at 8.34% CAGR over 2026-2031.
Server Operating System Market by Component (Software and Service), License Model (Commercial Proprietary and More), Type (Windows, Linux, and More), Server Architecture (x86/X64 and More), Virtualization Status (Virtual Server and More), Deployment Mode (Cloud, On-Premise, and Hybrid), Enterprise Size (Large Enterprises and Small and Medium-Sized Enterprises), Industry Vertical (IT and Telecom, BFSI, and More), and Geography.
Global Server Operating System Market Trends and Insights
Cloud-first enterprise refresh cycles
Organizations are modernizing infrastructure beyond hardware replacement, choosing operating systems that deliver cloud parity on-premises. Windows Server 2025 brings native Azure Arc integration and hot-patch updates, cutting downtime and smoothing workload mobility Microsoft Corporation. Healthcare provider Kaleida Health projects USD 5-10 million in annual savings from hypervisor consolidation and software-defined infrastructure. Vendors court these needs; Red Hat now packages Enterprise Linux AI on Azure to simplify hybrid AI deployment Red Hat. Enterprises expect a single control plane, automated lifecycle management, and predictable cost models. The result is sustained demand for solutions that harmonize licensing, telemetry, and security across multi-location estates in the server operating system market.
Hyperscale data-center build-outs
Cloud providers keep raising capital intensity; Microsoft has earmarked USD 80 billion for AI-ready facilities, while Google plans USD 75 billion over the same horizon. Scale drives operating system redesign so that tens of thousands of nodes appear as one logical computer. Power capping, silicon accelerators, and telemetry APIs are embedded at the kernel level to extract every kilowatt. Warehousing compute at this magnitude spurs new distributions tailored to ARM and custom silicon, widening the addressable base of the server operating system market. Nuclear and renewable energy alliances highlight cost pressure, making energy-aware scheduling in the OS a competitive differentiator.
High migration and downtime costs
Moving mission-critical workloads can consume over USD 15,000 per terabyte when testing, staff retraining, and service windows are included, according to Hitachi Data Systems. Legacy application dependencies make direct upgrades risky, pushing some firms to virtualization wrappers. The CentOS sunset underscored exposure: 26% of scanned Linux servers needed replacement within months. Professional services surge as enterprises seek staged cut-overs that limit business disruption. Cost sensitivity slows near-term churn, tempering expansion of the server operating system market.
Other drivers and restraints analyzed in the detailed report include:
- Edge and 5G micro-data-center rollout
- AI/ML workload proliferation
- Rising zero-day vulnerabilities
For complete list of drivers and restraints, kindly check the Table Of Contents.
Segment Analysis
Software dominated with 61.85% revenue in 2025, anchored by subscription licensing and continuous update streams, and it remains the economic foundation of the server operating system market. Enterprises favor predictable operating expense profiles and direct tie-ins with cloud consoles, which strengthens vendor lock-in yet simplifies procurement. Vendors integrate telemetry, policy engines, and cost governance features, blurring traditional OS boundaries and expanding wallet share.Services record an 10.58% CAGR to 2031 as hybrid estates multiply. Migration from CentOS, mainframe offload projects, and edge rollouts all call for advisory, design, and managed services. Providers build packaged engagements that bundle licenses, tuning, and regulatory mapping. As operating environments scale to multicloud and edge, specialized managed service offerings become essential, sustaining momentum for the server operating system market.
Commercial proprietary licenses claimed 39.10% share in 2025, reflecting Windows Server's hold on directory-centric workloads. However, subscription SaaS models top growth at 9.82% CAGR as enterprises trade capital expenditure for pay-as-you-go utility. Vendors like Red Hat refine per-core and per-node tiers that scale linearly with workload peaks.Community distributions lose ground following CentOS 7 end-of-life, steering production users toward supported variants. Enterprises cite compliance attestations and indemnification as justification for paid Linux. The evolution underscores how consumption-based pricing increasingly defines value in the server operating system market.
Linux held a 44.25% share in 2025 on strength in container, cloud, and HPC tasks. Windows enjoys a 9.62% CAGR through 2031, bolstered by ARM64 support and deep Azure integration. UNIX continues a secular decline as proprietary RISC hardware ages out, though pockets remain in telecom billing and financial trading.Workload alignment drives choice: Linux dominates cloud-native microservices, while Windows keeps traction in ERP and identity services. Emerging distributions tuned for AI pipelines and edge autonomy diversify options, extending competitive contours within the server operating system market.
Complete Report Scope:
- By Component
- Software
- Services
- By License Model
- Commercial Proprietary
- Paid Linux Distribution
- Community Linux Distribution (Free)
- Subscription-based SaaS OS
- By Type
- Windows
- Linux
- UNIX
- Others
- By Server Architecture
- x86/x64
- ARM
- RISC-V
- POWER
- Others
- By Virtualization Status
- Virtual Server
- Physical Server
- Containerised Environment
- By Deployment Mode
- Cloud
- On-premise
- Hybrid
- By Enterprise Size
- Large Enterprises
- Small and Medium-sized Enterprises (SMEs)
- By Industry Vertical
- IT and Telecom
- BFSI
- Manufacturing
- Retail and E-Commerce
- Government
- Healthcare
- Media and Entertainment
- Other Industry Verticals
- By Geography
- North America
- United States
- Canada
- Mexico
- South America
- Brazil
- Argentina
- Chile
- Rest of South America
- Europe
- Germany
- United Kingdom
- France
- Italy
- Spain
- Russia
- Rest of Europe
- Asia-Pacific
- China
- India
- Japan
- South Korea
- Malaysia
- Singapore
- Australia
- Rest of Asia-Pacific
- Middle East and Africa
- Middle East
- United Arab Emirates
- Saudi Arabia
- Turkey
- Rest of Middle East
- Africa
- South Africa
- Nigeria
- Rest of Africa
- Middle East
- North America
Geography Analysis
North America led with 36.25% revenue in 2025, backed by hyperscale investments from Microsoft, Google, and AWS. Microsoft alone budgeted USD 80 billion for next-generation AI facilities. Canada's forthcoming efficiency rules for computer room air conditioners emphasize sustainable infrastructure. Mexican manufacturing expansion adds industrial server demand, further anchoring regional leadership in the server operating system market.
Asia-Pacific delivers the fastest 11.02% CAGR to 2031. China's cloud sector is on track to surpass CNY 1 trillion by 2025. South Korean MSP revenue gains and GPU server sales, which touched KRW 5.1 trillion in 2024 for 72.7% growth, underscore AI's pull-through effect. Japanese audit tooling and security compliance reinforce demand for hardened platforms. Regional policy pushes domestic ISAs, making multiarc OS support a prerequisite, broadening adoption opportunities in the server operating system market.
Europe witnesses steady uptake as the Energy Efficiency Directive obliges operators above 100 kW IT load to publish energy KPIs by September 2024. Operators adopt OS telemetry extensions to meet mandatory reporting. Germany, France, and the United Kingdom drive enterprise refresh cycles, while Eastern members explore sovereign open-source stacks. Regulatory alignment shapes purchasing criteria, sustaining consistent growth for the server operating system market.
- Microsoft Corporation
- Red Hat Inc. (IBM Corporation)
- SUSE Group
- Oracle Corporation
- Amazon Web Services Inc.
- Canonical Ltd.
- Google LLC
- Huawei Technologies Co. Ltd.
- Alibaba Cloud Computing Co. Ltd.
- Dell Technologies Inc.
- Hewlett Packard Enterprise Co.
- Fujitsu Ltd.
- Lenovo Group Ltd.
- Cisco Systems Inc.
- NEC Corp.
- Inspur Group Co. Ltd.
- Super Micro Computer Inc.
- VMware Inc.
- Parallels International (virtuozzo)
- Joyent Inc.
- Nutanix Inc.
- FreeBSD Foundation
- Percona LLC
- OpenBSD Project
- Rocky Enterprise Software Foundation
Additional Benefits:
- The market estimate (ME) sheet in Excel format
- 3 months of analyst support
TABLE OF CONTENTS
1 INTRODUCTION
- 1.1 Study Assumptions and Market Definition
- 1.2 Scope of the Study
2 RESEARCH METHODOLOGY
3 EXECUTIVE SUMMARY
4 MARKET LANDSCAPE
- 4.1 Market Overview
- 4.2 Market Drivers
- 4.2.1 Cloud-first enterprise refresh cycles
- 4.2.2 Hyperscale data-center build-outs
- 4.2.3 Edge and 5G micro-data-center rollout
- 4.2.4 AI/ML workload proliferation
- 4.2.5 RISC-V server OS tool-chains mature
- 4.2.6 Cyber-insurance compliance hardening
- 4.3 Market Restraints
- 4.3.1 High migration and downtime costs
- 4.3.2 Rising zero-day vulnerabilities
- 4.3.3 CentOS EOL license uncertainty
- 4.3.4 Energy-efficiency regulations
- 4.4 Industry Value Chain Analysis
- 4.5 Regulatory Landscape
- 4.6 Technological Outlook
- 4.7 Industry Attractiveness - Porter's Five Forces Analysis
- 4.7.1 Bargaining Power of Buyers
- 4.7.2 Bargaining Power of Suppliers
- 4.7.3 Threat of New Entrants
- 4.7.4 Threat of Substitutes
- 4.7.5 Intensity of Competitive Rivalry
- 4.8 Impact of Macroeconomic Factors on the Market
5 MARKET SIZE AND GROWTH FORECASTS (VALUES)
- 5.1 By Component
- 5.1.1 Software
- 5.1.2 Services
- 5.2 By License Model
- 5.2.1 Commercial Proprietary
- 5.2.2 Paid Linux Distribution
- 5.2.3 Community Linux Distribution (Free)
- 5.2.4 Subscription-based SaaS OS
- 5.3 By Type
- 5.3.1 Windows
- 5.3.2 Linux
- 5.3.3 UNIX
- 5.3.4 Others
- 5.4 By Server Architecture
- 5.4.1 x86/x64
- 5.4.2 ARM
- 5.4.3 RISC-V
- 5.4.4 POWER
- 5.4.5 Others
- 5.5 By Virtualization Status
- 5.5.1 Virtual Server
- 5.5.2 Physical Server
- 5.5.3 Containerised Environment
- 5.6 By Deployment Mode
- 5.6.1 Cloud
- 5.6.2 On-premise
- 5.6.3 Hybrid
- 5.7 By Enterprise Size
- 5.7.1 Large Enterprises
- 5.7.2 Small and Medium-sized Enterprises (SMEs)
- 5.8 By Industry Vertical
- 5.8.1 IT and Telecom
- 5.8.2 BFSI
- 5.8.3 Manufacturing
- 5.8.4 Retail and E-Commerce
- 5.8.5 Government
- 5.8.6 Healthcare
- 5.8.7 Media and Entertainment
- 5.8.8 Other Industry Verticals
- 5.9 By Geography
- 5.9.1 North America
- 5.9.1.1 United States
- 5.9.1.2 Canada
- 5.9.1.3 Mexico
- 5.9.2 South America
- 5.9.2.1 Brazil
- 5.9.2.2 Argentina
- 5.9.2.3 Chile
- 5.9.2.4 Rest of South America
- 5.9.3 Europe
- 5.9.3.1 Germany
- 5.9.3.2 United Kingdom
- 5.9.3.3 France
- 5.9.3.4 Italy
- 5.9.3.5 Spain
- 5.9.3.6 Russia
- 5.9.3.7 Rest of Europe
- 5.9.4 Asia-Pacific
- 5.9.4.1 China
- 5.9.4.2 India
- 5.9.4.3 Japan
- 5.9.4.4 South Korea
- 5.9.4.5 Malaysia
- 5.9.4.6 Singapore
- 5.9.4.7 Australia
- 5.9.4.8 Rest of Asia-Pacific
- 5.9.5 Middle East and Africa
- 5.9.5.1 Middle East
- 5.9.5.1.1 United Arab Emirates
- 5.9.5.1.2 Saudi Arabia
- 5.9.5.1.3 Turkey
- 5.9.5.1.4 Rest of Middle East
- 5.9.5.2 Africa
- 5.9.5.2.1 South Africa
- 5.9.5.2.2 Nigeria
- 5.9.5.2.3 Rest of Africa
- 5.9.5.1 Middle East
- 5.9.1 North America
6 COMPETITIVE LANDSCAPE
- 6.1 Market Concentration
- 6.2 Strategic Moves
- 6.3 Market Share Analysis
- 6.4 Company Profiles (includes Global level Overview, Market level overview, Core Segments, Financials as available, Strategic Information, Market Rank/Share for key companies, Products and Services, and Recent Developments)
- 6.4.1 Microsoft Corporation
- 6.4.2 Red Hat Inc. (IBM Corporation)
- 6.4.3 SUSE Group
- 6.4.4 Oracle Corporation
- 6.4.5 Amazon Web Services Inc.
- 6.4.6 Canonical Ltd.
- 6.4.7 Google LLC
- 6.4.8 Huawei Technologies Co. Ltd.
- 6.4.9 Alibaba Cloud Computing Co. Ltd.
- 6.4.10 Dell Technologies Inc.
- 6.4.11 Hewlett Packard Enterprise Co.
- 6.4.12 Fujitsu Ltd.
- 6.4.13 Lenovo Group Ltd.
- 6.4.14 Cisco Systems Inc.
- 6.4.15 NEC Corp.
- 6.4.16 Inspur Group Co. Ltd.
- 6.4.17 Super Micro Computer Inc.
- 6.4.18 VMware Inc.
- 6.4.19 Parallels International (virtuozzo)
- 6.4.20 Joyent Inc.
- 6.4.21 Nutanix Inc.
- 6.4.22 FreeBSD Foundation
- 6.4.23 Percona LLC
- 6.4.24 OpenBSD Project
- 6.4.25 Rocky Enterprise Software Foundation
7 MARKET OPPORTUNITIES AND FUTURE TRENDS
- 7.1 White-Space and Unmet-Need Assessment