

|
시장보고서
상품코드
2119728
데이터화 : 시장 점유율 분석, 업계 동향 및 통계, 성장 예측(2026-2031년)Datafication - Market Share Analysis, Industry Trends & Statistics, Growth Forecasts (2026 - 2031) |
||||||
 Mordor Intelligence
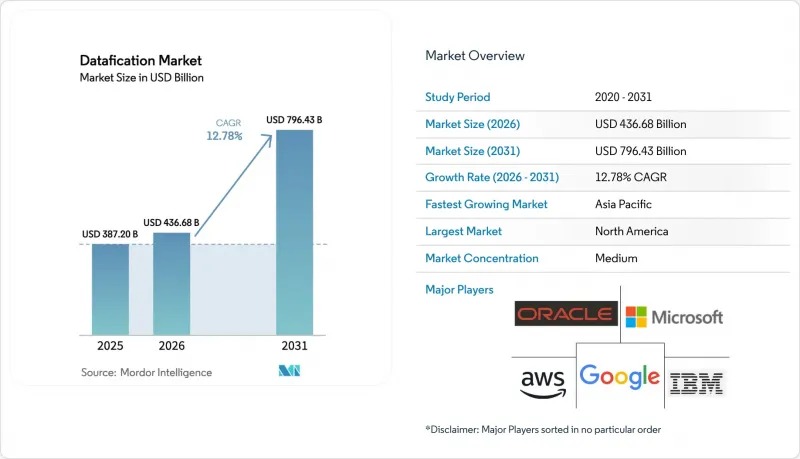
Mordor Intelligence에 의하면, 데이터화 시장 규모는 2025년 3,872억 달러로 평가되었습니다. 2026년에는 4,366억 8,000만 달러로 확대되어 2026년부터 2031년에 걸쳐 CAGR 12.78%로 성장을 지속하여, 2031년에는 7,964억 3,000만 달러에 이를 것으로 예측됩니다.
본 보고서는 제품 유형(행동 데이터화, 소셜 데이터화 등), 구성 요소(솔루션, 서비스), 도입 형태(클라우드, On-Premise,엣지/하이브리드), 용도(블록체인, AiOps, 인지 컴퓨팅 등), 최종 사용자 산업(은행, 금융서비스 및 보험(BFSI), 헬스케어, IT 및 통신, 정부·국방 등), 지역별로 분류되어 있습니다. 시장 예측은 금액(달러)으로 제시되어 있습니다.
세계의 데이터화 시장 동향 및 인사이트
IoT 및 5G 네트워크에 따른 데이터량의 폭발적 증가
연결된 엔드포인트로 인해 데이터 스트림이 급증했으며, 기업들은 이를 분석하여 기계 고장을 감지하고, 재고를 관리하며, 의료 개입을 개인화했습니다. 모든 공장 현장, 소매점 진열대, 배송 차량에서 텔레메트리 데이터가 원시 데이터를 신속한 인사이트력으로 변환하도록 설계된 플랫폼으로 전송되었습니다. 각 조직은 매일 1퀸트릴리언 바이트 규모의 데이터를 처리하고 있으며, 이러한 규모에 대응하기 위해서는 지연으로 인한 병목 현상을 방지할 수 있는 탄력적인 파이프라인과 엣지 기기가 필요했습니다. 5G가 지원하는 기기 연결은 대역폭과 결정성을 모두 확보하여, 과거에는 유선 인프라가 필요했던 실시간 피드백 루프를 가능하게 했습니다. 경쟁 우위는 단순히 데이터를 수집하는 데서 비롯된 것이 아니라, 필터링, 데이터 보강, 그리고 즉각적인 조치를 동시에 수행할 수 있는 아키텍처를 구축함으로써 탄생했습니다.
데이터 기반 의사결정을 향한 기업의 노력
경영진이 예산 편성, 제품 로드맵, 고객 경험 플레이북에 측정 가능한 인사이트력을 반영함에 따라 기업 문화도 변화했습니다. 최고 데이터 책임자(CDO)는 조직 내 영향력을 확대하고, 품질 기준을 설정하며, 데이터 윤리 정책을 승인하는 거버넌스 위원회를 주도하게 되었습니다. 후지쯔의 ‘OneERP+’ 도입은 트랜잭션과 업무 흐름을 통합함으로써 수작업에 의한 대조 작업을 줄이고 예측 정확도를 향상시켰음을 입증했습니다. 셀프 서비스형 대시보드를 통해 현장 관리자는 코딩 없이 선별된 데이터 레이어를 조회할 수 있게 되었으며, 증거에 기반한 제안을 할 수 있는 직원의 범위가 확대되었습니다. 도입이 확대됨에 따라 기업들은 시장 출시 기간 단축과 고객 생애 가치 향상을 보고했으며, ‘데이터화’ 시장의 전략적 중요성이 더욱 강화되었습니다.
데이터 엔지니어링 인력의 심각한 부족
실시간 파이프라인 설계, 스트리밍 프레임워크 최적화, 메타데이터를 비즈니스 분류 체계에 정합시키는 엔지니어에 대한 수요는 공급을 훨씬 초과했습니다. 경쟁 심화로 보상 수준이 상승하고 채용 주기가 장기화됨에 따라, 기업들은 DevOps 인력의 재교육이나 복잡성을 추상화하는 자동화 기술 도입을 불가피하게 추진해야 했습니다. 로우코드 데이터 수집 도구를 통해 일반 개발자의 진입 장벽은 낮아졌지만, 고도의 작업에는 여전히 경험이 풍부한 아키텍트가 필요했습니다. 매니지드 서비스가 그 격차를 메워주었지만, 외부 파트너에 대한 의존으로 인해 사내 역량 구축이 지연되기도 했습니다. 그 결과, 기술 부족이 도입 속도를 저해하는 요인이 되었고, 총 소유 비용(TCO)을 상승시키는 요인이 되었습니다.
부문별 분석
2025년에도 거래 기록이 여전히 최대 수익원을 차지했지만, 센서에서 나오는 데이터 스트림이 현장의 의사결정 주기를 재정의했습니다. 기업들이 결제, 주문, 공급망의 주요 단계 추적을 계속한 결과, 거래 처리는 데이터화 시장 점유율의 31.74%를 차지했습니다. 반면, 센서 분야는 제조 현장, 물류 거점, 도시 인프라 전반에 걸친 IoT의 지속적인 도입을 반영하여 연평균 성장률(CAGR) 15.48%로 확대될 것으로 예측됩니다. 현재 이용 사례로는 회전 기계의 진동 경보, 콜드체인 운송 차량의 대기 모니터링, 토목 자산의 구조 건전성 점검 등이 포함됩니다. 이러한 노력은 예측 유지보수의 수준을 높이고, 가동 중단 시간을 줄이며, 자산의 수명을 연장함으로써 데이터화 시장 규모 내에서 새로운 예산 배분을 정당화하는 구체적인 ROI를 가져오고 있습니다.
클릭 경로 및 앱 조작을 통해 얻어지는 행동 데이터 세트는 초개인화된 컨텐츠 큐레이션을 뒷받침하며, 소셜 그래프는 캠페인 최적화를 위한 관계의 강도를 정량화합니다. 지리 공간 신호는 교통 체증 상황을 시각화하고, 라스트 마일 경로 설정을 도출하며, 스마트 시티 기획 담당자가 활용하는 디지털 트윈 시뮬레이션에 정보를 제공합니다. 이러한 각 보완 범주는 마스터 분석 계층을 보강하고 있지만, 센서를 통한 시각화가 여전히 가장 가파른 도입 곡선을 이끌고 있습니다. 현재 조직에서는 AI 추론 엔진을 마이크로컨트롤러와 결합함으로써, 원격 클라우드 코어를 거치지 않고도 비정상적인 패턴에 즉시 대응할 수 있게 되었습니다. 이러한 ‘엣지 퍼스트’ 접근 방식은 데이터화 시장이 원시 데이터(텔레메트리)를 이전에는 얻을 수 없었던 실시간 예측 정보로 변환하고 있음을 보여줍니다.
데이터 레이크에서 거버넌스 콘솔에 이르는 솔루션 라이선스는 2025년에 매출의 59.55%를 차지했으나, 구매자들이 외부 전문 지식에 의존하는 경향이 강해짐에 따라 서비스 계약은 연평균 16.02%의 성장률을 보일 것으로 전망됩니다. 자문 팀은 기술적 야망과 프로세스의 성숙도를 양립시키는 로드맵을 수립하는 한편, 구현 팀은 보안 및 규정 준수 기준을 충족하는 파이프라인 구축을 신속하게 진행합니다. 또한, 매니지드 런스테이트 서비스가 일상적인 운영 관리를 담당함으로써 사내 분석가는 클러스터 수정 작업에 쫓기지 않고 인사이트 활용에 전념할 수 있게 됩니다. 이러한 전체 라이프사이클에 걸친 참여 모델은 프로젝트의 위험을 줄이고 가치 실현까지의 시간을 단축합니다. 이것이 바로 데이터화 시장의 서비스 분야 규모가 2031년까지 2926억 달러로 확대될 것으로 예측되는 이유입니다.
DataOps 프레임워크가 주목을 받으며, 데이터 엔지니어, 플랫폼 사이트 신뢰성 엔지니어, 비즈니스 도메인 전문가를 연결하고, 애자일 스프린트를 통해 단계적인 결과물을 만들어내고 있습니다. 지속적 통합 파이프라인에서는 스키마 드리프트와 리니지 업데이트를 테스트하여 오류가 대시보드에 반영되기 전에 포착합니다. 교육 패키지는 경영진의 데이터 리터러시를 향상시키고, 전략적 질문이 엄선된 데이터 세트로 답변 가능한 범위와 일치하도록 보장합니다. 이러한 시너지 효과로 인해 인사이트 발견과 운영 적용 간의 피드백 루프가 강화되어, 데이터화 시장 전체를 견인하는 선순환이 더욱 공고해집니다.
지역별 분석
2025년, 북미는 높은 클라우드 보급률, 벤처 자금, 그리고 성숙한 분석 인재 공급에 힘입어 매출의 34.79%를 차지하며 데이터화 시장을 주도했습니다. 금융 서비스 기업들은 거래 흐름과 행동 생체 인식 기술을 결합하여 부정 감지 능력을 향상시켰으며, 한편 병원에서는 예측 위험 점수 산정 방식을 적용해 재입원율을 낮췄습니다. 합성 데이터 스타트업들은 주 차원의 규제 요건을 충족하는 개인정보 보호형 데이터 레이크를 제공하며 급성장했습니다.
아시아태평양은 주요 지역 중 가장 높은 연평균 성장률(CAGR) 17.05%를 기록할 전망입니다. 중국의 제조업체들은 스마트 공장에 AI가 통합된 엣지 노드를 도입하여 예기치 않은 가동 중단 시간을 줄이는 동시에 처리량을 향상시켰습니다. 인도의 ‘통합 결제 인터페이스(UPI)’는 세밀한 거래 내역을 생성하여 개인 맞춤형 대출 모델에 활용되고 있습니다. 동남아시아 국가들은 기존 데스크톱 환경의 제약을 피하고, 슈퍼앱을 통해 구매자의 실시간 감정을 파악하기 위해 ‘모바일 퍼스트’ 분석 기법을 채택했습니다. 각 하이퍼스케일러 기업이 지역 존을 개설하는 가운데, 현지 데이터 거주지에 관한 법규가 하이브리드 클라우드의 전개를 형성했습니다.
유럽에서는 엄격한 규제와 기술적 리더십이 융합되었습니다. GDPR(EU 개인정보보호규정)의 시행과 향후 시행될 ‘디지털 시장법’에 따라 프라이버시 강화형 컴퓨팅의 도입이 촉진되었습니다. 독일의 산업 클러스터에서는 센서 그리드를 공급망의 지휘 센터에 연결했으며, EU 부흥 기금은 남유럽 국가들의 공공 부문 현대화를 가속화했습니다. GAIA-X는 주권 인프라 구축 노력을 추진하며, 조직들에게 비유럽계 하이퍼스케일러를 대체할 지역적 대안을 제공했습니다.
기타 혜택 :
- 엑셀 형식 시장 예측(ME) 시트
- 3개월간의 애널리스트 지원
자주 묻는 질문
목차
제1장 서론
제2장 조사 방법
제3장 주요 요약
제4장 시장 구도
제5장 시장 규모 및 성장 예측
제6장 경쟁 구도
제7장 시장 기회 및 향후 전망
KTH 26.09.04According to Mordor Intelligence, the datafication market size is expected to grow from USD 387.2 billion in 2025 to USD 436.68 billion in 2026 and is forecast to reach USD 796.43 billion by 2031 at 12.78% CAGR over 2026-2031.
This report is Segmented by Product Type (Behavioral Datafication, Social Datafication, and More), Component (Solutions, Services), Deployment Mode (Cloud, On-Premises, Edge/Hybrid), Application (Blockchain, Aiops, Cognitive Computing, and More), End-User Vertical (BFSI, Healthcare, IT and Telecom, Government and Defense, and More), and Geography. The Market Forecasts are Provided in Terms of Value (USD).
Global Datafication Market Trends and Insights
Exploding data volumes from IoT and 5G networks
Connected endpoints spurred a surge in data streams that businesses analysed to detect machine faults, manage inventory, and personalise health interventions. Every plant floor, retail shelf, and delivery vehicle fed telemetry into platforms designed to turn raw packets into rapid insight. Organisations processed quintillion-byte quantities each day, a scale that demanded elastic pipelines and edge appliances to prevent latency bottlenecks. Device links supported by 5G added both bandwidth and determinism, allowing real-time feedback loops that once required wired infrastructure. Competitive advantage flowed not from collecting data alone but from shaping architectures that can filter, enrich, and act in the same moment.
Enterprise push for data-driven decision-making
Corporate cultures shifted as leadership teams embedded measurable insight into budgeting, product road-maps, and customer experience playbooks. Chief data officers gained organisational influence, steering governance boards that set quality thresholds and approved data ethics policies. Fujitsu's OneERP+ rollout showcased how unified transaction and operations streams reduced manual reconciliation and accelerated forecast accuracy. Self-service dashboards gave frontline managers the ability to query curated layers without coding, widening the pool of staff who contribute evidence-based recommendations. As adoption widened, firms reported faster time to market and higher customer-lifetime value, reinforcing the strategic importance of the Datafication market.
Acute shortage of data engineering talent
Demand for engineers who design real-time pipelines, optimise streaming frameworks, and align metadata to business taxonomies far exceeded supply. Competition lifted compensation bands and lengthened hiring cycles, prompting firms to reskill DevOps staff and adopt automation that abstracts complexity. Low-code ingestion tools reduced barrier-to-entry for citizen developers, yet sophisticated initiatives still required seasoned architects. Managed services filled gaps, though reliance on external partners sometimes slowed internal capability building. The skills crunch therefore acted as a drag on deployment velocity and inflated total cost of ownership.
Other drivers and restraints analyzed in the detailed report include:
- Cloud cost compression via FinOps analytics
- Tighter data-privacy regulations driving compliant tooling
- Escalating data-sovereignty and cross-border transfer barriers
For complete list of drivers and restraints, kindly check the Table Of Contents.
Segment Analysis
Sensor streams redefined frontline decision cycles even though transactional records still produced the largest revenue block in 2025. Transactional processes contributed 31.74% of Datafication market share as enterprises continued to track payments, orders, and supply-chain milestones. The sensor category, however, is projected to expand at 15.48% CAGR, reflecting relentless IoT adoption on shop floors, in logistics depots, and across urban infrastructure. Use cases now encompass vibration alerts in rotating machinery, atmospheric monitoring in cold-chain carriers, and structural health checks on civil assets. Such initiatives elevate predictive maintenance, cut downtime, and elongate asset life, delivering tangible ROI that justifies fresh budgets within the Datafication market size.
Behavioural datasets, derived from click paths and app gestures, support hyper-personalised content curation, while social graphs quantify relationship strength for campaign optimisation. Geospatial signals map congestion, guide last-mile routing, and feed digital twin simulations used by smart-city planners. Each supplemental category enriches the master analytics layer, but sensor-driven visibility continues to drive the steepest adoption curve. Organisations now pair AI inference engines with micro-controllers, enabling immediate response to anomalous patterns without detouring through distant cloud cores. This edge-first posture illustrates how the Datafication market converts raw telemetry into real-time foresight that was previously unattainable.
Solution licences, ranging from data lakes to governance consoles, generated 59.55% of revenue in 2025, yet services contracts are projected to climb 16.02% annually as buyers lean on external expertise. Advisory teams craft road-maps that reconcile technical ambition with process maturity, while implementation squads expedite pipeline builds that meet security and compliance benchmarks. Managed run-state offerings then absorb day-to-day administration, freeing internal analysts to exploit insights rather than patch clusters. This full-lifecycle engagement model reduces project risk and accelerates time-to-value, explaining why the services slice of the Datafication market size is forecast to swell to USD 292.6 billion by 2031.
DataOps frameworks gained prominence, knitting together data engineers, platform site-reliability engineers, and business domain experts in agile sprints that deliver incremental artefacts. Continuous integration pipelines test schema drift and lineage updates, catching errors before they propagate into dashboards. Education packages cultivate literacy among executives, ensuring strategic questions align with what curated datasets can answer. The combined impact tightens feedback loops between insight discovery and operational rollout, reinforcing the virtuous cycle that propels the wider Datafication market.
Complete Report Scope:
- By Product Type
- Behavioral Datafication
- Social Datafication
- Geospatial Datafication
- Transactional Datafication
- Sensor Datafication
- By Component
- Solutions
- Services (Consulting, Managed)
- By Deployment Mode
- Cloud
- On-Premises
- Edge / Hybrid
- By Application
- Blockchain
- AIOps
- Cognitive Computing
- Edge Computing
- FinOps
- Smart Cities and XR
- By End-user Vertical
- BFSI
- Healthcare
- IT and Telecom
- Government and Defense
- Retail and E-commerce
- Manufacturing
- Media and Entertainment
- Education
- Transportation and Logistics
- Energy and Utilities
- By Geography
- North America
- United States
- Canada
- Mexico
- South America
- Brazil
- Argentina
- Rest of South America
- Europe
- Germany
- United Kingdom
- France
- Italy
- Russia
- Rest of Europe
- Asia-Pacific
- China
- Japan
- India
- South Korea
- Australia and New Zealand
- Rest of Asia-Pacific
- Middle East and Africa
- Middle East
- GCC Countries (Saudi Arabia, UAE, Qatar)
- Turkey
- Rest of Middle East
- Africa
- South Africa
- Nigeria
- Rest of Africa
- Middle East
- North America
Geography Analysis
North America led the Datafication market with 34.79% revenue in 2025, supported by deep cloud penetration, venture funding, and mature analytics talent pools. Financial-services firms improved fraud detection by combining transactional flows with behavioural biometrics, while hospitals applied predictive risk scoring to reduce readmissions. Synthetic-data startups flourished, offering privacy-preserving lakes that satisfy state-level mandates.
Asia-Pacific is on track for a 17.05% CAGR, the fastest among major regions. Chinese manufacturers deployed AI-infused edge nodes in smart factories, cutting unplanned downtime and boosting throughput. India's Unified Payments Interface generated granular transaction trails that feed personalised lending models. Southeast Asian economies adopted mobile-first analytics, bypassing legacy desktop constraints and capturing real-time buyer sentiment from super-apps. Local data-residency statutes shaped hybrid-cloud rollouts as hyperscalers opened regional zones.
Europe blended regulatory strictness with technology leadership. GDPR enforcement and the forthcoming Digital Markets Act spurred adoption of privacy-enhancing computation. German industrial clusters connected sensor grids to supply-chain command centres, while EU recovery funds accelerated public-sector modernisation in southern states. GAIA-X advanced sovereign-infrastructure ambitions, giving organisations a regional alternative to non-European hyperscalers.
- IBM Corporation
- Amazon Web Services
- Microsoft Corporation
- Google LLC
- Oracle Corporation
- SAP SE
- SAS Institute Inc.
- Snowflake Inc.
- Databricks
- Teradata Corporation
- DataRobot Inc.
- Matillion
- QlikTech International AB
- Alteryx Inc.
- Informatica
- Cloudera Inc.
- Talend (Qlik)
- Collibra
- Palantir Technologies
- ThoughtSpot Inc.
- Alation
- Denodo Technologies
- Couchbase
- Splunk Inc.
- Fivetran
- Elastic NV
Additional Benefits:
- The market estimate (ME) sheet in Excel format
- 3 months of analyst support
TABLE OF CONTENTS
1 INTRODUCTION
- 1.1 Study Assumptions and Market Definition
- 1.2 Scope of the Study
2 RESEARCH METHODOLOGY
3 EXECUTIVE SUMMARY
4 MARKET LANDSCAPE
- 4.1 Market Overview
- 4.2 Market Drivers
- 4.2.1 Exploding data volumes from IoT and 5G networks
- 4.2.2 Enterprise push for data-driven decision-making
- 4.2.3 Cloud cost compression via FinOps analytics
- 4.2.4 Tighter data-privacy regulations driving compliant tooling
- 4.2.5 Rise of synthetic data marketplaces
- 4.2.6 Metaverse telemetry creating "metaversal data" demand
- 4.3 Market Restraints
- 4.3.1 Acute shortage of data engineering talent
- 4.3.2 Escalating data-sovereignty and cross-border transfer barriers
- 4.3.3 GPU/AI chip supply chain volatility
- 4.3.4 Growing end-user fatigue over data monetisation
- 4.4 Value Chain Analysis
- 4.5 Regulatory Landscape
- 4.6 Technological Outlook
- 4.7 Porter's Five Forces Analysis
- 4.7.1 Bargaining Power of Buyers
- 4.7.2 Bargaining Power of Suppliers
- 4.7.3 Threat of New Entrants
- 4.7.4 Threat of Substitutes
- 4.7.5 Intensity of Competitive Rivalry
- 4.8 Investment Analysis
- 4.9 Assessment of Macroeconomic Factor Impact
5 MARKET SIZE AND GROWTH FORECASTS (VALUE)
- 5.1 By Product Type
- 5.1.1 Behavioral Datafication
- 5.1.2 Social Datafication
- 5.1.3 Geospatial Datafication
- 5.1.4 Transactional Datafication
- 5.1.5 Sensor Datafication
- 5.2 By Component
- 5.2.1 Solutions
- 5.2.2 Services (Consulting, Managed)
- 5.3 By Deployment Mode
- 5.3.1 Cloud
- 5.3.2 On-Premises
- 5.3.3 Edge / Hybrid
- 5.4 By Application
- 5.4.1 Blockchain
- 5.4.2 AIOps
- 5.4.3 Cognitive Computing
- 5.4.4 Edge Computing
- 5.4.5 FinOps
- 5.4.6 Smart Cities and XR
- 5.5 By End-user Vertical
- 5.5.1 BFSI
- 5.5.2 Healthcare
- 5.5.3 IT and Telecom
- 5.5.4 Government and Defense
- 5.5.5 Retail and E-commerce
- 5.5.6 Manufacturing
- 5.5.7 Media and Entertainment
- 5.5.8 Education
- 5.5.9 Transportation and Logistics
- 5.5.10 Energy and Utilities
- 5.6 By Geography
- 5.6.1 North America
- 5.6.1.1 United States
- 5.6.1.2 Canada
- 5.6.1.3 Mexico
- 5.6.2 South America
- 5.6.2.1 Brazil
- 5.6.2.2 Argentina
- 5.6.2.3 Rest of South America
- 5.6.3 Europe
- 5.6.3.1 Germany
- 5.6.3.2 United Kingdom
- 5.6.3.3 France
- 5.6.3.4 Italy
- 5.6.3.5 Russia
- 5.6.3.6 Rest of Europe
- 5.6.4 Asia-Pacific
- 5.6.4.1 China
- 5.6.4.2 Japan
- 5.6.4.3 India
- 5.6.4.4 South Korea
- 5.6.4.5 Australia and New Zealand
- 5.6.4.6 Rest of Asia-Pacific
- 5.6.5 Middle East and Africa
- 5.6.5.1 Middle East
- 5.6.5.1.1 GCC Countries (Saudi Arabia, UAE, Qatar)
- 5.6.5.1.2 Turkey
- 5.6.5.1.3 Rest of Middle East
- 5.6.5.2 Africa
- 5.6.5.2.1 South Africa
- 5.6.5.2.2 Nigeria
- 5.6.5.2.3 Rest of Africa
- 5.6.5.1 Middle East
- 5.6.1 North America
6 COMPETITIVE LANDSCAPE
- 6.1 Market Concentration
- 6.2 Strategic Moves
- 6.3 Market Share Analysis
- 6.4 Company Profiles (includes Global level Overview, Market level overview, Core Segments, Financials as available, Strategic Information, Market Rank/Share for key companies, Products and Services, and Recent Developments)
- 6.4.1 IBM Corporation
- 6.4.2 Amazon Web Services
- 6.4.3 Microsoft Corporation
- 6.4.4 Google LLC
- 6.4.5 Oracle Corporation
- 6.4.6 SAP SE
- 6.4.7 SAS Institute Inc.
- 6.4.8 Snowflake Inc.
- 6.4.9 Databricks
- 6.4.10 Teradata Corporation
- 6.4.11 DataRobot Inc.
- 6.4.12 Matillion
- 6.4.13 QlikTech International AB
- 6.4.14 Alteryx Inc.
- 6.4.15 Informatica
- 6.4.16 Cloudera Inc.
- 6.4.17 Talend (Qlik)
- 6.4.18 Collibra
- 6.4.19 Palantir Technologies
- 6.4.20 ThoughtSpot Inc.
- 6.4.21 Alation
- 6.4.22 Denodo Technologies
- 6.4.23 Couchbase
- 6.4.24 Splunk Inc.
- 6.4.25 Fivetran
- 6.4.26 Elastic NV
7 MARKET OPPORTUNITIES AND FUTURE OUTLOOK
- 7.1 White-space and Unmet-Need Assessment


