|
시장보고서
상품코드
2119815
금 : 시장 점유율 분석, 업계 동향 및 통계, 성장 예측(2026-2031년)Gold - Market Share Analysis, Industry Trends & Statistics, Growth Forecasts (2026 - 2031) |
||||||
 Mordor Intelligence
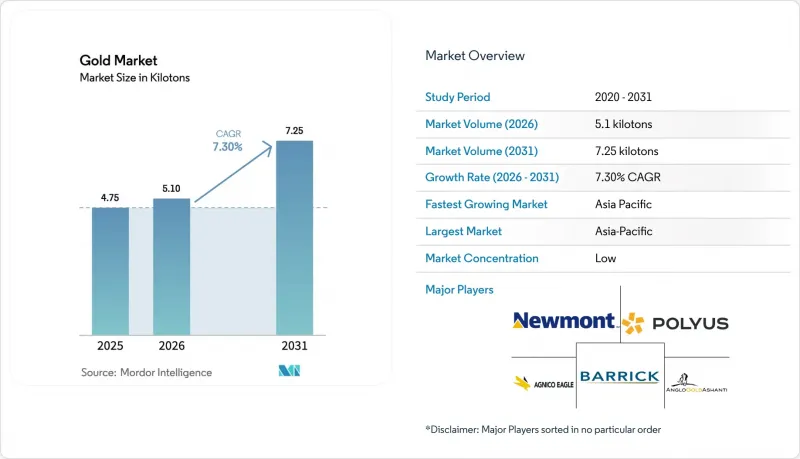
Mordor Intelligence에 의하면, 금 시장 규모는 2025년 4.75 킬로톤으로 평가되었습니다. 2026년에는 5.1 킬로톤으로 확대되어 2026-2031년에 걸쳐 CAGR 7.30%로 성장을 지속하여, 2031년에는 7.25 킬로톤에 이를 것으로 예측됩니다.
본 보고서는 공급원(1차 채굴, 재활용 금), 유형(합금 금, 레이어드 골드), 용도(보석, 전자기기, 상·지위 상징, 기타 용도(치과, 항공우주, 기타)), 지역(주요 지역별 생산·소비 분석)별로 분류되어 있습니다. 시장 예측은 수량(톤) 단위로 표시되어 있습니다.
세계의 금 시장 동향 및 인사이트
인플레이션 헤지 환경 하에서 소매 및 ETF 투자 수요의 급증
소비자 물가의 고공 행진과 금융 정책의 효과에 대한 의구심으로 인해, 분산 투자 포트폴리오에서 금의 위상이 재확립되었습니다. 인도의 금 상장지수펀드(ETF)에는 2024년 한 해 동안 1,120억 루피(13억 달러)의 순유입이 발생했으며, 이는 사상 최대의 연간 유입액입니다. 같은 해, 금은 현지 주식을 21% 앞서는 성과를 보이며 ‘안전한 피난처’로서의 입지를 공고히 했습니다. 미국과 유럽의 포트폴리오 매니저들은 실질 수익률이 마이너스로 전환됨에 따라 전략적 배분 비율을 높였습니다. 또한 조사 데이터에 따르면, 인플레이션율이 4%를 초과하면 금에 대한 선호도가 높아지는 것으로 나타났습니다. 실물 자산을 통한 헤지를 원하는 개인 투자자층 사이에서는 코인과 금괴가 여전히 인기를 끌고 있으며, 현물 가격이 온스당 2,300달러를 돌파한 후에도 수요가 놀라울 정도로 탄력성을 잃지 않는 것으로 나타났습니다. 이러한 투자 행태의 구조적 변화로 인해, 거시경제 변동이 격화될 경우 시장은 견조한 매수 수요를 유지할 것으로 예측됩니다.
중앙은행의 ‘탈달러화’ 전략이 준비금 분산화를 가속화
중앙은행들은 지난 3년 연속으로 매년 1,000톤 이상의 금을 임베디드해 왔으며, 이러한 역사적인 연속 기록은 달러의 미래 지배력에 대한 회의론이 고조되고 있음을 여실히 보여줍니다. 세계금협회(WGC)의 2025년 설문조사에서 응답자의 95%는 금괴 보유량을 유지하거나 늘릴 것이라고 답했으며, 43%는 추가 임베디드을 계획하고 있다고 응답했습니다. 중국, 인도, 튀르키예가 순임베디드을 주도했으며, 2021년 이후 이들 3개국의 합산 순임베디드량은 600톤을 넘어섰습니다. 이는 제재 위험 및 통화 변동 위험을 완화하기 위한 정책적 움직임을 반영하고 있습니다. 2024년 3월 기준, 전 세계 외환보유고에서 달러가 차지하는 비중은 58.9%까지 하락하여 현대적 통계가 시작된 이래 최저 수준을 기록했습니다. 이에 따라 중립적인 가치 보존 수단으로서 금의 매력이 높아지고 있습니다. 2024-2025년에 걸쳐, 공공 보유량에서 금괴의 적극적인 운용 비율은 37%에서 44%로 확대되어 이는 금 산업 배후에 있는 장기적인 구조적 수요를 시사합니다.
채굴 광석 등급의 하락으로 인해 AISC가 온스당 1,450달러를 넘는 수준으로 상승
성숙한 광상에서는 광석 등급이 지속적으로 하락하고 있어, 생산량을 유지하기 위해 사업자들은 더 많은 광석을 처리할 수밖에 없는 상황입니다. 뉴몬트(Newmont)사는 2025년 1분기 총지속비용(AISC)이 온스당 1,651달러로, 2022년 대비 29% 상승하여 9년 만에 최고치를 기록했다고 보고했습니다. 산업 전체의 총지속비용(AISC)은 2024년 2분기에 온스당 평균 1,388달러였으나, 북미 생산자들은 온스당 1,522달러라는 더 높은 수준에 직면했습니다. 인력 부족, 에너지 가격 급등, 현물 가격에 연동되는 로열티의 에스컬레이터 조항이 비용 압박을 더욱 가중시키고 있습니다. 현재 사상 최고 수준의 현물 가격이 이익률을 지탱하고는 있지만, 비용 상승이 지속된다면 수익성이 낮은 광산의 사업성이 압박을 받아 광산 폐쇄가 가속화될 것입니다. 중기적으로는 비용 곡선의 상승이 신규 공급을 억제하여 금 산업을 지지할 가능성이 있습니다.
부문별 분석
2025년, 1차 채굴은 금 시장 점유율의 72.05%를 차지하여, 대규모 노천 채굴과 지하 광산이 여전히 공급의 주축임을 뒷받침했습니다. 이 부문은 확립된 물류망, 숙련된 인력, 광석 품위가 저하되더라도 처리량을 안정적으로 유지할 수 있는 장기 오프테이크 계약의 혜택을 받고 있습니다. 그러나 온인서스테이닝 비용이 온스당 1,388달러를 넘어선 것은 신규 자본에 대한 수익성이 하락하고 있음을 나타내며, 각 기업은 기존 거점 주변의 탐사를 강화하고 이미 투자된 인프라를 활용하려고 하고 있습니다.
재활용은 공급량의 27.95%에 불과하지만, 2031년까지 연평균 성장률(CAGR) 7.98%로 확대되고 있으며, 이는 모든 공급원 부문 중 가장 빠른 속도입니다. 로열 민트의 사우스 웨일즈 시설에서는 특허를 취득한 습식 야금 기술을 사용하여 연간 4,000톤의 인쇄 회로 기판을 처리하고 있으며, 회수 효율은 99%에 달할 전망입니다. 재활용에 소요되는 에너지 수요는 신규 광산 개발에 비해 약 300분의 1 수준으로 낮아, 이로 인해 탄소 강도가 감소하고 환경·사회·지배구조(ESG) 요건도 충족합니다. 고급 제품 산업의 선두주자인 판도라(Pandora)사는 2025년까지 100% 재활용 귀금속을 사용할 것을 공약하고 있어 스크랩 수요를 견인했습니다. 전자 폐기물에 대한 규제를 강화하는 관할 구역이 늘어남에 따라, 2차 원료는 금 산업에서 전략적 축이 될 것으로 보입니다.
지역별 분석
아시아태평양은 2025년 금 산업의 59.85%를 차지했으며, 2031년까지 연평균 성장률(CAGR) 8.95%를 나타낼 것으로 예측됩니다. 중국은 2024년에 403톤을 채굴하며 생산량 1위를 유지한 한편, 중국인민은행은 공식 보유량을 19개월 연속 증가시켰습니다. 인도 중앙은행은 2025년 7월까지 금괴 보유량을 880톤으로 확대했으며, 수입 관세가 인하됨에 따라 소비자 수요가 회복되었습니다. 인도네시아, 태국, 베트남에서는 가처분 소득 증가와 유동성이 높은 저축 수단으로서 금에 대한 선호도를 반영하여 주얼리 판매량이 두 자릿수 성장률을 기록했습니다.
북미와 유럽에서는 수요가 성숙한 양상을 보이고 있지만, 실질 수익률의 변동에 따라 투자자들의 관심이 다시 높아지고 있습니다. 미국 상장 금 상장지수펀드(ETF)는 2024년에 152톤의 순 증가를 기록하며, 2년 동안 지속되던 순유출에서 반전했습니다. 한편, 유럽의 펀드는 에너지 가격 변동성이 높아지는 가운데 98톤의 순 증가를 기록했습니다. 캐나다 광산에서는 175톤의 생산량이 공급되었으며, 2024년 4분기에 완전 가동에 도달한 데투르 레이크 광산의 확장이 주된 견인 역할을 했습니다. 금 산업에서 이 지역의 규제 환경 안정성과 자본 시장 접근성은 기존 광산의 확장을 촉진하고 있으며, 이는 다른 지역의 품위 저하를 상쇄하는 데 일조하고 있습니다. 공급 측면에서는 라틴아메리카와 아프리카가 여전히 중요한 역할을 하고 있습니다. 페루와 브라질은 2024년에 합계 290톤을 공급했으나, 페루에서는 사회적 시위로 인해 물류가 간헐적으로 중단되었습니다. 가나는 2024년 ‘광업 투자 법안’에 따른 허가 절차 효율화에 힘입어 129톤을 수출함으로써 남아프리카공화국을 제치고 아프리카 대륙 최대 생산국이 되었습니다. 아프리카의 일부 중앙은행들은 금 보유량을 준비금의 최소 10%까지 늘릴 계획을 발표했습니다. 이러한 움직임으로 인해, 해당 지역의 생산량 일부가 수출 경로가 아닌 국내 금고로 전환될 가능성이 있습니다. 중동에서는 걸프협력회의(GCC) 회원국들이 샤리아 원칙에 부합하는 금 기반 저축 상품을 추진함에 따라 수요가 소폭 증가했고, 금 산업에 대한 개인 투자자들의 참여가 확대되었습니다.
기타 혜택
- 엑셀 형식 시장 예측(ME) 시트
- 3개월간의 애널리스트 지원
자주 묻는 질문
목차
제1장 서론
제2장 조사 방법
제3장 주요 요약
제4장 시장 구도
제5장 시장 규모 및 성장 예측
제6장 경쟁 구도
제7장 시장 기회 및 향후 전망
KTH 26.09.10According to Mordor Intelligence, the gold market size market is expected to grow from 4.75 kilotons in 2025 to 5.1 kilotons in 2026 and is forecast to reach 7.25 kilotons by 2031 at 7.30% CAGR over 2026-2031.
This report is Segmented by Source (Primary Mining and Recycled Gold), Type (Alloyed Gold and Layered Gold), Application (Jewellery, Electronics, Awards and Status Symbols, and Other Applications (Dental, Aerospace, Etc. )), and Geography (Production and Consumption Analysis Across Major Regions). The Market Forecasts are Provided in Terms of Volume (tons).
Global Gold Market Trends and Insights
Surging Retail and ETF Investment Demand in Inflation-Hedge Environments
Persistently high consumer-price levels and doubts over monetary-policy effectiveness have re-anchored gold in diversified portfolios. Gold exchange-traded funds in India attracted INR 112 Billion (USD 1.3 Billion) of net inflows during 2024, the highest annual tally on record . The metal out-performed local equities by 21 percentage points that year, reinforcing its safe-haven status. Portfolio managers in the United States and Europe lifted strategic allocations as real yields turned negative, and survey data show a rising preference for gold when inflation exceeds 4%. Coins and bars remain popular among retail savers seeking physical hedges, and demand proved remarkably inelastic after spot prices broke above USD 2,300 /oz. The structural shift in investment behaviour is expected to keep the market well bid whenever macro volatility spikes.
Central-Bank De-Dollarization Strategies Accelerating Reserve Diversification
Central banks bought more than 1,000 tons of gold in each of the past three calendar years, a historic streak that underscores growing skepticism toward the US dollar's future dominance. In the World Gold Council's 2025 survey, 95% of respondents said they would either maintain or increase their bullion holdings, and 43% plan outright additions. China, India, and Turkey led net purchases that together topped 600 tons since 2021, reflecting policy moves to mitigate sanction risk and currency volatility. The dollar's share of global foreign-exchange reserves slipped to 58.9% by March 2024, its lowest level since modern records began, increasing the attractiveness of gold as a neutral store of value. Active bullion management grew from 37% to 44% of official holdings over 2024-2025, signalling a longer-run structural bid beneath the gold industry.
Declining Mined Ore Grades Raising AISC Beyond USD 1,450 /oz
Ore grades continue to fall at mature deposits, forcing operators to process more material to maintain output. Newmont reported its highest cost base in nine years, with all-in sustaining costs at USD 1,651 /oz in Q1 2025, a 29% jump from 2022. Industry-wide all-in sustaining costs (AISC) averaged USD 1,388 /oz in Q2 2024, and North American producers faced an even steeper USD 1,522 /oz. Labour shortages, rising energy prices, and royalty escalators linked to spot quotations intensify cost pressures. Although a record spot price shields margins today, sustained cost inflation squeezes feasibility for marginal pits and accelerates mine closures. Over the medium term, higher cost curves could temper fresh supply and lift the floor under the gold industry.
Other drivers and restraints analyzed in the detailed report include:
- Rising Middle-Class Jewellery Demand in India and ASEAN
- AI-Enabled Electronics Driving Ultra-Fine Gold Bonding-Wire Usage
- ESG-Driven Financing Constraints for New Green-Field Mines
For complete list of drivers and restraints, kindly check the Table Of Contents.
Segment Analysis
Primary extraction occupied 72.05% of the Gold market share in 2025, confirming that large-scale open-pit and underground mines remain the backbone of supply. The segment benefits from established logistics, skilled labour pools, and long-term offtake contracts that stabilise throughput even when ore grades erode. However, all-in sustaining costs rising above USD 1,388 /oz signal diminishing returns on fresh capital, and companies have intensified exploration around existing hubs to leverage sunk infrastructure.
Recycling, though only 27.95% of supply, is marching forward at an 7.98% CAGR to 2031, the fastest rate of any source segment. The Royal Mint's South Wales facility processes 4,000 tons of circuit boards annually using patented hydrometallurgical techniques with 99% recovery efficiency . Energy demand for recycling is roughly 300 times lower than for green-field mining, lowering carbon intensity and aligning with Environmental, Social, and Governance (ESG) mandates. Luxury-goods leader Pandora pledged to use 100% recycled precious metals by 2025, creating pull for scrap flows. As more jurisdictions tighten e-waste rules, secondary feedstock will become a strategic pillar in the Gold industry.
Complete Report Scope:
- By Source
- Primary Mining
- Recycled Gold
- By Type
- Alloyed Gold
- Layered Gold
- By Application
- Jewellery
- Electronics
- Awards and Status Symbols
- Other Applications (Dental, Aerospace, etc.)
- By Geography
- Production Analysis
- United States
- Australia
- Brazil
- Burkina Faso
- Canada
- China
- Colombia
- Ghana
- Indonesia
- Kazakhstan
- Mali
- Mexico
- Papua New Guinea
- Peru
- Russia
- South Africa
- Sudan
- Tanzania
- Uzbekistan
- Other countries
- Consumption Analysis
- Asia-Pacific
- China
- India
- Japan
- South Korea
- Rest of Asia-Pacific
- North America
- United States
- Canada
- Mexico
- Europe
- Germany
- United Kingdom
- Italy
- France
- Rest of Europe
- South America
- Brazil
- Argentina
- Rest of South America
- Middle East and Africa
- Saudi Arabia
- South Africa
- Rest of Middle East and Africa
- Asia-Pacific
- Production Analysis
Geography Analysis
Asia-Pacific held 59.85% of the Gold industry in 2025 and is projected to grow with a 8.95% CAGR through 2031. China mined 403 tons in 2024, retaining pole position in production while its central bank lifted official holdings for the 19th consecutive month. India's Reserve Bank expanded bullion reserves to 880 tons by July 2025, and consumer demand rebounded once import duties fell. Indonesia, Thailand, and Vietnam posted double-digit percentage gains in jewelry offtake, reflecting rising disposable income and a preference for gold as a liquid savings vehicle.
North America and Europe exhibit mature demand profiles yet see renewed investor interest as real yields gyrate. US-listed gold Exchange Traded Funds (ETFs) added 152 tons during 2024, reversing two years of net outflows, while European funds absorbed 98 tons amid heightened energy-price volatility. Canadian mines contributed 175 t of output, led by the Detour Lake expansion that reached full capacity in Q4 2024. Within the gold industry, the region's regulatory stability and access to capital markets encourage brownfield expansions that help offset grade decline elsewhere. Latin America and Africa remain pivotal on the supply side. Peru and Brazil delivered a combined 290 tons in 2024, though social protests in Peru intermittently halted logistics movements. Ghana overtook South Africa as the continent's top producer, shipping 129 tons, aided by streamlined permitting under its 2024 Mining Investment Bill. Several African central banks announced plans to raise gold holdings to at least 10% of reserves, a move that could redirect part of regional output toward domestic vaults rather than export channels. Middle Eastern demand ticked higher as Gulf Cooperation Council states promoted gold-based savings products aligned with Sharia principles, enhancing retail participation in the Gold industry.
- Agnico Eagle Mines Limited
- AnglogoldAshanti
- B2Gold Corp.
- Barrick Mining Corporation
- China Gold International Resources Corp., Ltd.
- Endeavour Mining plc
- Equinox Gold Corp.
- Franco-Nevada Corporation
- FURUKAWA CO., LTD.
- Gabriel Resources
- Gold Fields Limited
- Harmony Gold Mining Company Limited
- Johnson Matthey
- Kinross Gold Corporation
- Lundin Gold Inc.
- Newmont Corporation
- PJSC Polyus
- Zijin Mining Group Co., Ltd.
Additional Benefits:
- The market estimate (ME) sheet in Excel format
- 3 months of analyst support
TABLE OF CONTENTS
1 Introduction
- 1.1 Study Assumptions & Market Definition
- 1.2 Scope of the Study
2 Research Methodology
3 Executive Summary
4 Market Landscape
- 4.1 Market Overview
- 4.2 Market Drivers
- 4.2.1 Surging Retail and ETF Investment Demand in Inflation-hedge Environments
- 4.2.2 Central-bank De-dollarization Strategies Accelerating Reserve Diversification
- 4.2.3 Rising Middle-class Jewellery Demand in India and Asean
- 4.2.4 AI-Enabled Electronics Driving Ultra-fine Gold Bonding Wire Usage
- 4.2.5 Tokenised Gold Products Expanding Digital Asset Adoption
- 4.3 Market Restraints
- 4.3.1 Declining Mined Ore-grades Raising AISC Beyond USD 1,450/oz
- 4.3.2 ESG-driven Financing Constraints for New Green-field Mines
- 4.3.3 Volatile Import Duties in Key Consuming Nations Curb Jewellery Demand
- 4.4 Value Chain Analysis
- 4.5 Porter's Five Forces
- 4.5.1 Bargaining Power of Suppliers
- 4.5.2 Bargaining Power of Buyers
- 4.5.3 Threat of New Entrants
- 4.5.4 Threat of Substitutes
- 4.5.5 Degree of Competition
5 Market Size & Growth Forecasts (Volume)
- 5.1 By Source
- 5.1.1 Primary Mining
- 5.1.2 Recycled Gold
- 5.2 By Type
- 5.2.1 Alloyed Gold
- 5.2.2 Layered Gold
- 5.3 By Application
- 5.3.1 Jewellery
- 5.3.2 Electronics
- 5.3.3 Awards and Status Symbols
- 5.3.4 Other Applications (Dental, Aerospace, etc.)
- 5.4 By Geography
- 5.4.1 Production Analysis
- 5.4.1.1 United States
- 5.4.1.2 Australia
- 5.4.1.3 Brazil
- 5.4.1.4 Burkina Faso
- 5.4.1.5 Canada
- 5.4.1.6 China
- 5.4.1.7 Colombia
- 5.4.1.8 Ghana
- 5.4.1.9 Indonesia
- 5.4.1.10 Kazakhstan
- 5.4.1.11 Mali
- 5.4.1.12 Mexico
- 5.4.1.13 Papua New Guinea
- 5.4.1.14 Peru
- 5.4.1.15 Russia
- 5.4.1.16 South Africa
- 5.4.1.17 Sudan
- 5.4.1.18 Tanzania
- 5.4.1.19 Uzbekistan
- 5.4.1.20 Other countries
- 5.4.2 Consumption Analysis
- 5.4.2.1 Asia-Pacific
- 5.4.2.1.1 China
- 5.4.2.1.2 India
- 5.4.2.1.3 Japan
- 5.4.2.1.4 South Korea
- 5.4.2.1.5 Rest of Asia-Pacific
- 5.4.2.2 North America
- 5.4.2.2.1 United States
- 5.4.2.2.2 Canada
- 5.4.2.2.3 Mexico
- 5.4.2.3 Europe
- 5.4.2.3.1 Germany
- 5.4.2.3.2 United Kingdom
- 5.4.2.3.3 Italy
- 5.4.2.3.4 France
- 5.4.2.3.5 Rest of Europe
- 5.4.2.4 South America
- 5.4.2.4.1 Brazil
- 5.4.2.4.2 Argentina
- 5.4.2.4.3 Rest of South America
- 5.4.2.5 Middle East and Africa
- 5.4.2.5.1 Saudi Arabia
- 5.4.2.5.2 South Africa
- 5.4.2.5.3 Rest of Middle East and Africa
- 5.4.2.1 Asia-Pacific
- 5.4.1 Production Analysis
6 Competitive Landscape
- 6.1 Market Concentration
- 6.2 Strategic Moves
- 6.3 Market Share(%)/Ranking Analysis
- 6.4 Company Profiles (includes Global level Overview, Market level overview, Core Segments, Financials as available, Strategic Information, Market Rank/Share for key companies, Products & Services, and Recent Developments)
- 6.4.1 Agnico Eagle Mines Limited
- 6.4.2 AnglogoldAshanti
- 6.4.3 B2Gold Corp.
- 6.4.4 Barrick Mining Corporation
- 6.4.5 China Gold International Resources Corp., Ltd.
- 6.4.6 Endeavour Mining plc
- 6.4.7 Equinox Gold Corp.
- 6.4.8 Franco-Nevada Corporation
- 6.4.9 FURUKAWA CO., LTD.
- 6.4.10 Gabriel Resources
- 6.4.11 Gold Fields Limited
- 6.4.12 Harmony Gold Mining Company Limited
- 6.4.13 Johnson Matthey
- 6.4.14 Kinross Gold Corporation
- 6.4.15 Lundin Gold Inc.
- 6.4.16 Newmont Corporation
- 6.4.17 PJSC Polyus
- 6.4.18 Zijin Mining Group Co., Ltd.
7 Market Opportunities & Future Outlook
- 7.1 White-space & Unmet-need Assessment
- 7.2 Use of Cyanide Leaching for Extracting Gold