
|
시장보고서
상품코드
2119819
독일의 EV 충전 인프라 : 시장 점유율 분석, 업계 동향 및 통계, 성장 예측(2026-2031년)Germany EV Charging Infrastructure - Market Share Analysis, Industry Trends & Statistics, Growth Forecasts (2026 - 2031) |
||||||
 Mordor Intelligence
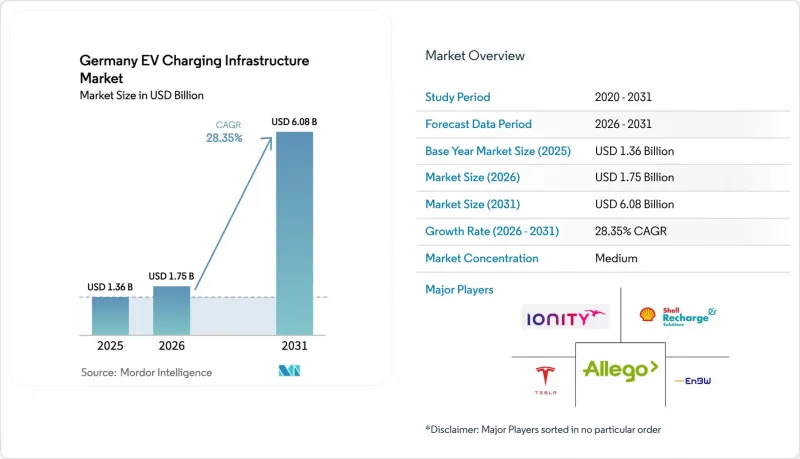
Mordor Intelligence에 의하면, 2026년 독일의 EV 충전 인프라 시장 규모는 17억 5,000만 달러로 추정되고 2025년 13억 6,000만 달러에서 확대해, 2031년에는 60억 8,000만 달러에 이를 것으로 예측됩니다.
2026-2031년 동안 연평균 성장률(CAGR) 28.35%로 성장할 것으로 전망됩니다.
본 보고서는 충전소(상업용, 주거용), 충전 유형(DC 고출력, 기타), 출력(22kW 이하, 기타), 커넥터 유형(CCS2, 기타), 설치 방식(벽걸이형, 기타), 차종(승용차, 기타), 독일 연방주별로 분류되어 있습니다. 시장 전망은 금액(달러) 기준으로 제시되어 있습니다.
독일의 EV 충전 인프라 시장 동향 및 인사이트
국가 정책 목표(마스터플랜·라데 인프라 II)
독일은 전국 규모의 EV 충전 네트워크 구축에 주력하고 있습니다. ‘Deutschlandnetz’ 이니셔티브를 통해 정부는 전기차 사용자에게 신뢰할 수 있고 광범위한 접근성을 보장하기 위해 급속 충전기 도입에 막대한 투자를 하고 있습니다. 이러한 목표는 소비자의 신뢰를 높이고 민간 부문의 참여를 촉진함으로써 전기 모빌리티로의 전환을 가속화합니다. TEN-T 노선에서 60km마다 급속 충전소 설치가 의무화됨에 따라, 도입 방식은 시장 주도형 집적형에서 체계적인 커버리지 중시형으로 전환되고 있으며, 고출력 하드웨어에 대한 수요가 안정화되고 있습니다. 바덴뷔르템베르크주의 ‘Charge&BW’와 같은 연방 및 주 차원의 프로그램을 병행함으로써 자금 부족을 최소화하고 조달에 있어 규모의 경제를 촉진합니다. 그 결과, 이용의 확실성이 높아짐에 따라 초기 투자액이 높음에도 불구하고 민간 사업자가 400-600kW 규모의 설비에 투자하도록 유도됩니다. 지방 허가 기관은 연방 정부의 목표를 점점 더 반영하게 되어, 승인까지의 리드타임이 단축되고 프로젝트의 위험이 낮아지고 있습니다.
BEV 보급률 확대
2025년 1분기 배터리 전기자동차(BEV)의 신규 등록 대수는 사상 최고치를 기록했으며, 내연기관 차량과의 총 소유 비용(TCO) 비교에서 EV가 결정적으로 유리한 상황이 되었습니다. 전기차 1대가 늘어날 때마다 일일 평균 충전 수요가 증가하여, 인프라 확충과 자동차 판매 간의 선순환이 강화되고 있습니다. 상용차의 전기화는 밴이나 트럭이 더 큰 전류를 소비하고 충전 베이(bay)를 장시간 점유하기 때문에 공공 네트워크에 과도한 부하를 주고 있습니다. 도시와 지방 간의 보급 불균형이 투자 논리를 형성하고 있습니다. 대도시권에서는 가정용 및 직장용 충전기가 우선시되는 반면, 도시 간 통로에서는 주말이나 휴일의 여행 수요 급증에 대응하기 위해 초고속 충전 허브가 우선시됩니다. 자동차 제조업체의 2030년 판매 목표는 충전 사업자에게 수년에 걸친 수요 예측의 기반이 되는 예측 가능한 전기차(EV) 공급 파이프라인을 창출하고 있습니다.
도시 지역의 송전망 용량 병목 현상
송전망의 제약으로 인해 도시 지역의 급속 충전 확대가 점점 더 가로막히고 있습니다. 주요 도시의 배전 시스템 운영사(DSO)에 따르면, 많은 설치 예정지에서 용량 병목 현상이 발생하고 있어 고출력 충전기의 대규모 도입이 과제로 대두되고 있습니다. 중전압 피더는 통근자들이 충전을 필요로 하는 시간대인 저녁 피크 수요 시에 여유 용량이 부족한 경우가 많습니다. 임시 대책-스마트 충전, 배터리 버퍼링, 시간대별 요금-은 보강 필요성을 미룰 수는 있겠지만, 이를 근본적으로 해소할 수는 없습니다. 현재 배전 시스템 운영사(DSO)는 프로젝트별로 업그레이드 일정을 조정하고 있어 리드타임이 길어지고 있습니다. 충전 인프라 계획을 도시 개발 계획에 통합하기 위한 방안 논의가 진행되고 있으나, 지자체, DSO, 민간 사업자 간의 자금 부담 분담에 대해서는 여전히 합의에 이르지 못하고 있습니다.
부문 분석
2025년, 독일의 EV 충전 인프라 시장 점유율의 60.72%를 상업시설이 차지했습니다. 이는 고속도로 연선, 소매 시설, 물류 허브가 주도한 결과입니다. 이러한 장소의 이용률은 하루 20-25회에 달하며, 송전망 업그레이드 비용을 투자한 후에도 수익성이 높은 요금 체계를 뒷받침하고 있습니다. 특히 물류 사업자를 중심으로 한 차량의 전기화로 인해 350kW 이상의 충전기와 현장 축전 설비를 갖춘 전용 물류 센터에 대한 수요가 증가하고 있습니다. 호텔이나 슈퍼마켓에서의 목적지 충전은 60-120분의 체류 시간을 활용하고 있으며, 사업자는 중출력(50-150kW) 충전 장치를 도입하여 추가적인 소매 매출을 창출할 수 있게 되었습니다.
주거용 설치는 WEG(주거법) 개정에 따라 공동주택의 법적 장벽이 제거됨에 따라 2031년까지 연평균 성장률(CAGR) 28.84%로 급속히 확대되고 있으나, 아파트 소유주 간의 프로젝트 조율로 인해 도입까지의 기간이 길어지고 있습니다. 주차장이나 주배전반의 용량이 충분히 확보된 단독주택에서는 도입률이 계속해서 높은 수준을 유지하고 있습니다. 전반적으로 주택 부문은 연평균 성장률(CAGR) 28.84%로 확대되고 있으며, 그 성장률은 규모가 더 큰 상업 부문을 상회하고 있지만, 설치 소켓 수는 적은 수준에서 시작하고 있습니다. 이러한 변화로 인해 부하 프로파일이 야간 시간대로 이동하여 도시 지역의 전력망 부하를 어느 정도 완화할 가능성이 있지만, 스마트 충전 알고리즘에 대한 필요성은 높아지고 있습니다.
2025년 독일의 EV 충전 인프라 시장 규모에서 AC 충전기는 여전히 55.62%를 차지했으며, 자본 지출(CAPEX)이 낮고 기존 3상 전력 시스템과 원활하게 통합될 수 있다는 점이 장점으로 꼽힙니다. 차량이 8시간 가까이 주차되는 직장이나 주거 환경에서는 전력망 강화 필요성을 최소화하는 11-22kW의 AC 콘센트가 사용되고 있습니다. 10년을 넘는 장비 수명과 성숙한 표준 덕분에 예측 가능한 유지보수 체계가 확보되어 있습니다.
150kW를 초과하는 DC 급속 충전기는 자동차 제조업체들이 270-350kW의 피크 충전 전력을 가능하게 하는 고전압 배터리 시스템을 출시함에 따라, 2031년까지 연평균 성장률(CAGR) 30.02%를 나타낼 것으로 전망됩니다. 도시 간 노선에는 현재 400kW 대응 충전기가 설치되어 있어, 10-80% 충전 시간을 15-20분으로 단축하고 있습니다. 하드웨어에는 수냉식 케이블과 대형 파워 모듈이 탑재되어 있어 단가는 높지만, 커넥터당 수익성은 향상되고 있습니다. 중출력(50-150kW) DC 충전 유닛은 2급 도시 및 교외 상업 중심지를 대상으로 하며, 설치 비용과 운전자의 편의성 사이에서 균형을 맞추고 있습니다.
기타 혜택
- 엑셀 형식 시장 예측(ME) 시트
- 3개월간의 애널리스트 지원
자주 묻는 질문
목차
제1장 서론
제2장 조사 방법
제3장 주요 요약
제4장 시장 구도
제5장 시장 규모 및 성장 예측
제6장 경쟁 구도
제7장 시장 기회 및 향후 전망
KTH 26.09.10According to Mordor Intelligence, German EV charging infrastructure market size in 2026 is estimated at USD 1.75 billion, growing from 2025 value of USD 1.36 billion with 2031 projections showing USD 6.08 billion, growing at 28.35% CAGR over 2026-2031.
This report is Segmented by Charging Site (Commercial and Residential), Charger Type (DC High Power, and More), Power Output (Up To 22 KW, and More), Connector Type (CCS2, and More), Mounting Configuration (Wall-Mounted, and More), Vehicle Type (Passenger Cars, and More), and German Federal State. The Market Forecasts are Provided in Terms of Value (USD).
Germany EV Charging Infrastructure Market Trends and Insights
National Policy Targets (Masterplan Ladeinfrastruktur II)
Germany is committed to building a nationwide EV charging network. Through the Deutschlandnetz initiative, the government invests heavily in fast-charger deployment to ensure reliable and widespread accessibility for EV users. These targets enhance consumer confidence and drive private-sector participation, accelerating the shift to electric mobility. Mandatory 60 km fast-charging intervals on TEN-T routes shift deployment from market-led clustering to systematic coverage, stabilizing demand for high-power hardware. Federal-state program stacking, such as Baden-Wurttemberg's Charge@BW, minimizes funding gaps and drives procurement scale economies. The resulting certainty in utilization encourages private operators to invest in 400-600 kW equipment despite higher capex. Local permitting agencies increasingly mirror federal targets, reducing approval lead times and lowering project risk.
Growing BEV Adoption Rates
Q1 2025 battery-electric registrations attained record highs, with total-cost-of-ownership parity versus combustion vehicles tipping decisively in favor of EVs. Each incremental EV lifts average daily charging demand, reinforcing the feedback loop between infrastructure expansion and vehicle sales. Commercial fleet electrification exerts an outsized load on public networks because vans and trucks draw higher currents and occupy bays longer. Urban-rural adoption asymmetry shapes investment logic: metropolitan areas prioritize home and workplace chargers, while intercity corridors prioritize ultra-fast hubs to support weekend and holiday travel surges. Automakers' sales targets for 2030 create a predictable pipeline of EVs that underpins multi-year volume forecasts for charging operators.
Urban Grid-Capacity Bottlenecks
Grid limitations increasingly constrain urban fast-charging expansion. Distribution system operators in major cities report that many proposed sites face capacity bottlenecks, challenging the deployment of high-powered chargers at scale. Medium-voltage feeders often lack spare headroom during evening peak demand, the window when commuters require charging. Interim mitigations-smart charging, battery buffering, and time-of-use pricing-can defer but not eliminate the need for reinforcement. DSOs presently coordinate upgrades on a project-by-project basis, stretching lead times. Policy discussions are underway to integrate charging infrastructure planning into urban development plans, but alignment on funding responsibility between municipalities, DSOs, and private operators remains unresolved.
Other drivers and restraints analyzed in the detailed report include:
- Private-Utility Investment Boom
- Freight-Corridor Electrification Incentives
- Heritage-Site Permitting Delays
For complete list of drivers and restraints, kindly check the Table Of Contents.
Segment Analysis
Commercial sites accounted for 60.72% of the German EV charging infrastructure market share in 2025, propelled by highway corridors, retail destinations, and logistics hubs. Utilization rates at these locations reach 20-25 sessions daily, supporting profitable tariff structures even after grid-upgrade outlays. Fleet electrification, notably among logistics providers, fuels demand for dedicated depots with>=350 kW dispensers and onsite storage. Destination charging at hotels and supermarkets leverages dwell times of 60-120 minutes, enabling operators to deploy mid-power 50-150 kW units and capture incremental retail spend.
Residential installations are scaling rapidly at a CAGR of 28.84% through 2031, as WEG reforms remove legal barriers in multi-unit buildings, although project coordination among apartment owners prolongs timelines. Private homes maintain high adoption where parking spaces and main-panel capacity are readily available. Collectively, the residential segment expands at 28.84% CAGR, its growth outpacing the larger commercial base but starting from a smaller installed-socket count. The shift rebalances load profiles toward overnight hours, which may ease some urban grid stress but heightens the need for smart-charging algorithms.
AC chargers continued to represent 55.62% of the German EV charging infrastructure market size 2025, favored for low capex and seamless integration with existing three-phase electrical systems. Workplace and residential settings, where vehicles remain parked nearly 8 hours, rely on 11-22 kW AC outlets that minimize grid-reinforcement needs. Equipment lifecycles of above 10 years and mature standards ensure predictable maintenance profiles.
DC fast chargers above 150 kW post a 30.02% CAGR through 2031, as automakers launch higher-voltage battery systems enabling 270-350 kW peak intake. Intercity routes now host 400 kW-capable dispensers, reducing 10-80% charge times to 15-20 minutes. The hardware incorporates liquid-cooled cables and larger power modules, keeping unit prices high but achieving better revenue per connector. Mid-power 50-150 kW DC units address Tier-2 cities and suburban commercial centers, offering a compromise between installation cost and driver convenience.
Complete Report Scope:
- By Charging Site
- Commercial Charging Stations
- Destination Charging Stations
- Highway Charging Stations
- Bus Charging Stations
- Fleet Charging Stations
- Other Commercial Sites
- Residential Charging Stations
- Private Houses
- Apartments
- Commercial Charging Stations
- By Charger Type
- DC High Power (Up to 150 kW)
- DC Low Power (50 - 150 kW)
- AC (Below 22 kW)
- By Power Output
- Up to 22 kW
- 23-99 kW
- 100-150 kW
- Above 150 kW (Ultra-fast)
- By Connector Type
- CCS2
- Type 2
- CHAdeMO
- Tesla (V3)
- Others
- By Mounting Configuration
- Wall-mounted
- Pedestal / Stand-alone
- Pantograph
- By Vehicle Type
- Passenger Cars
- Light Commercial Vehicles
- Buses and Coaches
- Medium and Heavy Trucks
- By Federal State
- Baden-Wurttemberg
- Bavaria
- Berlin
- Brandenburg
- Bremen
- Hamburg
- Hesse
- Lower Saxony
- Mecklenburg-Western Pomerania
- North Rhine-Westphalia
- Rhineland-Palatinate
- Saarland
- Saxony
- Saxony-Anhalt
- Schleswig-Holstein
- Thuringia
List of Companies Covered in this Report:
- EnBW Baden-Wurttemberg AG
- Ionity GmbH
- Allego B.V.
- Shell Plc
- ChargePoint Inc.
- Tesla Inc. (Supercharger Network)
- E.ON Drive GmbH
- ABB Ltd.
- Siemens AG
- EVBox Group
- Webasto Group
- Leviton Manufacturing Co.
- Compleo Charging Solutions AG
- BP Pulse (Germany)
- Fastned B.V.
- TotalEnergies SE
- EWE Go GmbH
- Stadtwerke Munchen GmbH
- SWARCO AG
- ADS-TEC Energy GmbH
Additional Benefits:
- The market estimate (ME) sheet in Excel format
- 3 months of analyst support
TABLE OF CONTENTS
1 Introduction
- 1.1 Study Assumptions & Market Definition
- 1.2 Scope of the Study
2 Research Methodology
3 Executive Summary
4 Market Landscape
- 4.1 Market Overview
- 4.2 Market Drivers
- 4.2.1 National Policy Targets (Masterplan Ladeinfrastruktur II)
- 4.2.2 Growing BEV Adoption Rates
- 4.2.3 Private-Utility Investment Boom
- 4.2.4 Grid Services Revenue (V2G, Load-Balancing)
- 4.2.5 Condominium Modernization Funding (WEG Reforms)
- 4.2.6 Freight-Corridor Electrification Incentives
- 4.3 Market Restraints
- 4.3.1 High Install and Grid-Upgrade Costs
- 4.3.2 Urban Grid-Capacity Bottlenecks
- 4.3.3 Heritage-Site Permitting Delays
- 4.3.4 Cyber-Security Compliance Costs (IT-Sig 3.0)
- 4.4 Value / Supply-Chain Analysis
- 4.5 Regulatory Landscape
- 4.6 Technological Outlook
- 4.7 Porter's Five Forces
- 4.7.1 Bargaining Power of Suppliers
- 4.7.2 Bargaining Power of Buyers/Consumers
- 4.7.3 Threat of New Entrants
- 4.7.4 Threat of Substitute Products
- 4.7.5 Intensity of Competitive Rivalry
5 Market Size and Growth Forecasts (Value (USD))
- 5.1 By Charging Site
- 5.1.1 Commercial Charging Stations
- 5.1.1.1 Destination Charging Stations
- 5.1.1.2 Highway Charging Stations
- 5.1.1.3 Bus Charging Stations
- 5.1.1.4 Fleet Charging Stations
- 5.1.1.5 Other Commercial Sites
- 5.1.2 Residential Charging Stations
- 5.1.2.1 Private Houses
- 5.1.2.2 Apartments
- 5.1.1 Commercial Charging Stations
- 5.2 By Charger Type
- 5.2.1 DC High Power (Up to 150 kW)
- 5.2.2 DC Low Power (50 - 150 kW)
- 5.2.3 AC (Below 22 kW)
- 5.3 By Power Output
- 5.3.1 Up to 22 kW
- 5.3.2 23-99 kW
- 5.3.3 100-150 kW
- 5.3.4 Above 150 kW (Ultra-fast)
- 5.4 By Connector Type
- 5.4.1 CCS2
- 5.4.2 Type 2
- 5.4.3 CHAdeMO
- 5.4.4 Tesla (V3)
- 5.4.5 Others
- 5.5 By Mounting Configuration
- 5.5.1 Wall-mounted
- 5.5.2 Pedestal / Stand-alone
- 5.5.3 Pantograph
- 5.6 By Vehicle Type
- 5.6.1 Passenger Cars
- 5.6.2 Light Commercial Vehicles
- 5.6.3 Buses and Coaches
- 5.6.4 Medium and Heavy Trucks
- 5.7 By Federal State
- 5.7.1 Baden-Wurttemberg
- 5.7.2 Bavaria
- 5.7.3 Berlin
- 5.7.4 Brandenburg
- 5.7.5 Bremen
- 5.7.6 Hamburg
- 5.7.7 Hesse
- 5.7.8 Lower Saxony
- 5.7.9 Mecklenburg-Western Pomerania
- 5.7.10 North Rhine-Westphalia
- 5.7.11 Rhineland-Palatinate
- 5.7.12 Saarland
- 5.7.13 Saxony
- 5.7.14 Saxony-Anhalt
- 5.7.15 Schleswig-Holstein
- 5.7.16 Thuringia
6 Competitive Landscape
- 6.1 Market Concentration
- 6.2 Strategic Moves
- 6.3 Market Share Analysis
- 6.4 Company Profiles (Includes Global & Market Level Overview, Core Segments, Financials, Strategic Info, Market Share, Products, Service & Recent Developments)
- 6.4.1 EnBW Baden-Wurttemberg AG
- 6.4.2 Ionity GmbH
- 6.4.3 Allego B.V.
- 6.4.4 Shell Plc
- 6.4.5 ChargePoint Inc.
- 6.4.6 Tesla Inc. (Supercharger Network)
- 6.4.7 E.ON Drive GmbH
- 6.4.8 ABB Ltd.
- 6.4.9 Siemens AG
- 6.4.10 EVBox Group
- 6.4.11 Webasto Group
- 6.4.12 Leviton Manufacturing Co.
- 6.4.13 Compleo Charging Solutions AG
- 6.4.14 BP Pulse (Germany)
- 6.4.15 Fastned B.V.
- 6.4.16 TotalEnergies SE
- 6.4.17 EWE Go GmbH
- 6.4.18 Stadtwerke Munchen GmbH
- 6.4.19 SWARCO AG
- 6.4.20 ADS-TEC Energy GmbH