

|
시장보고서
상품코드
2119882
유럽의 산업 폐기물 관리 시장 : 점유율 분석, 업계 동향과 통계, 성장 예측(2026-2031년)Europe Industrial Waste Management - Market Share Analysis, Industry Trends & Statistics, Growth Forecasts (2026 - 2031) |
||||||
 Mordor Intelligence
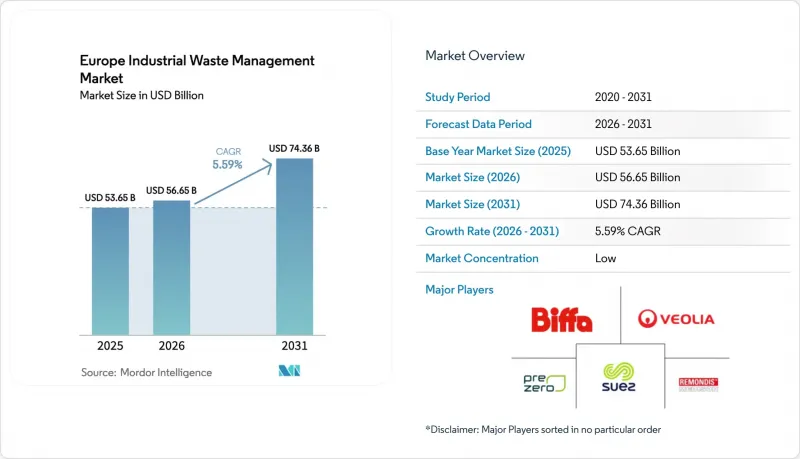
Mordor Intelligence에 의하면, 2026년 유럽 산업 폐기물 관리 시장 규모는 566억 5,000만 달러로 추정되고 있어 2025년 536억 5,000만 달러에서 확대해, 2031년에는 743억 6,000만 달러에 이를 것으로 예측됩니다.
2026년부터 2031년까지의 연평균 성장률(CAGR)은 5.59%가 될 것으로 전망됩니다.
본 보고서는 서비스별(수집, 운송 및 물류, 기타), 처리 방법별(매립, 재활용, 소각·에너지 회수), 폐기물 유형별(비유해 폐기물, 유해 폐기물), 산업별(화학제품 및 석유화학제품, 석유 및 가스, 기타), 지역별(영국, 독일, 기타)로 분류되어 있습니다. 시장 전망은 금액(달러) 기준으로 제시되어 있습니다.
유럽 산업 폐기물 관리 시장 동향 및 인사이트
EU의 엄격한 폐기물 관리 지침
새로운 EU 규정은 회수율 향상과 완벽한 추적성 실현을 위한 결정적인 추진력이 되고 있습니다. 2025년 2월에 발효되는 ‘포장 및 포장 폐기물 규정’은 2030년까지 모든 포장을 재활용 가능하도록 의무화하고, 2040년까지 15%의 재사용을 의무화하고 있습니다. 개정된 ‘폐기물 기본 지침’은 확대 생산자 책임 제도를 강화함과 동시에, 국경을 넘는 이동을 원활하게 하기 위해 분류 코드를 표준화하고 있습니다. 한편, ‘폐기물 운송 규정’에서는 2026년 11월부터 비OECD 국가로의 플라스틱 폐기물 수출이 금지되며, DIWASS 시스템을 통한 디지털 추적이 의무화됩니다. 이러한 법률에 따라 산업 폐기물 발생 사업자는 엄격한 목표를 달성할 수 있는 인증된 제공업체와의 제휴를 강요받고 있으며, 그 결과 재활용, 에너지 회수, 유해폐기물 무해화 등 고부가가치 분야가 직접적으로 확대되고 있습니다. 회원국별로 시행 상황에는 여전히 편차가 나타나고 있지만, 이러한 규제의 누적적인 추진으로 인해 유럽 산업 폐기물 관리 시장 예측 연평균 성장률(CAGR)은 1.8포인트 상승했습니다.
산업 폐기물 발생량 증가
유럽의 공장, 화학 산업 단지, 건설 현장에서는 생산량 증가와 제품 수명 주기의 단축에 따라 폐기물 발생량이 계속 증가하고 있습니다. 유해 폐기물은 2010년부터 2024년 사이에 연평균 2.25% 증가했으며, 독일의 라인-룰 지역이나 네덜란드의 화학제품 및 석유화학제품 산업 거점에서는 전문적인 처리가 필요한 복잡한 제품별 폐기물의 대부분이 발생하고 있습니다. 건축자재 제조만 해도 주로 무해한 잔해가 연간 4억 톤 가까이 배출되고 있어, 고도의 분리·회수 서비스에 대한 수요를 부추기고 있습니다. 전자기기 제조업체들은 희토류 원소와 귀금속을 풍부하게 함유하고 있어 처리가 어려운 소형 부품들을 시장에 방출함으로써 이러한 추세를 더욱 강화하고 있습니다. ‘산업 배출 지침’에 따라 공장은 폐기물 최소화를 위해 이용 가능한 최선의 기술을 채택해야 할 의무가 있지만, 배터리 및 재생 에너지 공급망의 확충으로 인해 그 감축 효과는 상쇄되고 있습니다. 전반적으로 산업 생산량 증가는 유럽 산업 폐기물 관리 시장의 처리량 확대를 직접적으로 견인하고 있으며, 사업자들은 처리 능력 확대, 기술 업그레이드, 물류 네트워크 최적화가 요구되고 있습니다.
첨단 처리 시설에는 막대한 설비 투자가 필요
최첨단 재활용 시설 및 폐기물 발전 시설의 건설에는 막대한 자본 투자가 필요합니다. 일반적인 플랜트의 건설 비용은 1MW당 400만-1,000만 달러이지만, 첨단 재활용 시설의 경우 규모에 따라 5,400만-2억 1,800만 달러(5,000만-2억 유로)가 소요됩니다. 리요넬바셀의 독일 내 화학 재활용 프로젝트는 EU로부터 4,360만 달러(4,000만 유로)의 자금 지원을 확보했으며,CIRCTEC은 유럽 최대 규모의 타이어 열분해 플랜트 건설을 위해 1억 6,350만 달러(1억 5,000만 유로)를 조달했습니다. 이산화탄소 포집(CCS) 개조 공사에는 CO₂ 처리 능력 1톤당 109-164달러의 비용이 듭니다. 동유럽에서는 현지 금융기관들이 폐기물 관련 자산을 고위험 자산으로 간주하고 있어, 이러한 자금 조달에 어려움을 겪고 있으며 도입 속도가 둔화되고 있습니다. 그 결과, 유럽 산업 폐기물 관리 시장의 성장률은 0.8퍼센트 포인트 하락했습니다.
부문별 분석
2025년, 유럽 산업 폐기물 관리 시장에서 ‘처리·처분’ 부문은 시장 점유율의 53.78%를 차지하며, 유해 폐기물의 무해화 및 기존 인프라를 뒷받침하는 핵심적인 역할을 확고히 다졌습니다. 이러한 우위는 독일, 네덜란드, 벨기에에서 가동 중인 소각로, 물리화학적 처리 플랜트, 그리고 안전한 매립지에 대한 막대한 매몰 투자에 기인합니다. 대규모 화학 산업 클러스터는 미처리 유해 폐기물 배출을 금지하는 EU 지침을 준수하기 위해 이러한 시설에 의존하고 있습니다. 배기가스 정화 장치 및 탄소 포집 장치 등의 꾸준한 업그레이드를 통해 규제 준수가 유지되며, 이는 안정적인 현금 흐름의 기반이 되고 있습니다. 수집 및 물류 서비스는 규모는 작지만, 처리량 증가와 유독 폐기물 전문 운송 요건의 확대로 인해 혜택을 보고 있습니다. 디지털을 통한 경로 최적화와 곧 도입될 DIWASS 플랫폼은 국경을 넘는 서류 절차를 효율화하여 유럽 산업 폐기물 관리 시장 전체에서 서비스의 부가가치를 높이고 있습니다.
‘재활용·자원 회수’는 2031년까지 연평균 성장률(CAGR)이 6.72%로 가장 빠르게 성장하는 서비스 분야이며, 순환형 모델로의 전환을 반영하고 있습니다. 리요네르바셀(Lyonerbasel)사의 독일 내 화학물질 재활용 플랜트나 CIRCTEC사의 타이어 열분해 설비와 같은 프로젝트는 폴리머와 고무의 가치를 끌어내기 위해 필요한 자본 집약도와 혁신의 깊이를 보여줍니다. 산업 공생 네트워크는 한 기업의 폐기물을 다른 기업의 원료로 전환함으로써, 특히 케미컬 파크에서 원료 공급량을 비약적으로 늘리고 있습니다. PPWR에 기반한 EU의 확대 생산자 책임(EPR) 제도는 포장재에 재활용 소재의 최소 함유율을 의무화하고 있어 지속적인 수요를 견인하고 있습니다. 이러한 동향에 따라 유럽 산업 폐기물 관리 시장 전체에서 이 부문의 점유율은 상승하고 있으며, 기술적 장벽이 높음에도 불구하고 주식 자본을 유치하고 있습니다.
2025년, 매립 처리는 기존의 처리 능력, 간편한 인허가 절차, 그리고 동유럽 일부 지역의 낮은 수용 요금에 힘입어 유럽 산업 폐기물 관리 시장 규모의 44.32%를 계속 차지했습니다. 그러나 매립세 인상, 오염 기준 강화, 일반 시민들의 반대로 인해 오랫동안 유지되어 온 그 우위는 서서히 사라지고 있습니다. 사업자에게는 메탄 회수나 침출수 모니터링과 같은 의무가 점점 더 부과되고 있어 운영비 증가로 이어지고 있습니다. 일부 사업자는 규모를 축소하거나 사용되지 않는 매립 구역을 태양광 발전소로 전환하는 방안을 선택하고 있으며, 이로 인해 수익원은 다각화되고 있지만 유럽 산업 폐기물 관리 시장의 순수 매립 처리량은 감소하고 있습니다.
‘소각·에너지 회수’ 분야는 연평균 성장률(CAGR) 7.31%로 가장 빠른 성장세를 보이고 있으며, 유럽 전역에서 연간 21억 8,000만 달러(20억 유로) 이상이 신규 폐기물 발전 시설에 투자되고 있는 것이 그 원동력이 되고 있습니다. SUEZ사가 15억 3,000만 달러(14억 유로)를 투자해 건설한, 탄소 포집 기술을 통합한 툴루즈 시설은 배출 기준의 발전과 재생 가능 전력 인증서를 통한 추가 수익의 실제 사례를 보여주고 있습니다. 폐기물 유래 연료(RDF) 프로그램은 시멘트 가마공급원이 되고 있으며, 화석 연료에 의한 열 수요의 최대 85%를 대체할 가능성이 있습니다. 열 발전소의 효율 향상과 지역 열 공급 네트워크와의 연계로 그 매력이 높아지고 있으며, 매립 처분되는 폐기물의 양을 점차 줄여가며 유럽 산업 폐기물 관리 시장에서 에너지 회수 경로의 입지를 강화하고 있습니다.
기타 혜택:
- 엑셀 형식 시장 예측(ME) 시트
- 3개월간의 애널리스트 지원
자주 묻는 질문
목차
제1장 서론
제2장 조사 방법
제3장 개요
제4장 시장 구도
제5장 시장 규모와 성장 예측
제6장 경쟁 구도
제7장 시장 기회와 향후 전망
JHS 26.09.03According to Mordor Intelligence, the European industrial waste management market size in 2026 is estimated at USD 56.65 billion, growing from 2025 value of USD 53.65 billion with 2031 projections showing USD 74.36 billion, growing at 5.59% CAGR over 2026-2031.
This report is Segmented by Service (Collection, Transportation & Logistics, and More), by Disposal Method (Landfill, Recycling and Incineration & Energy Recovery), by Waste Type (Non-Hazardous and Hazardous), by Industry (Chemicals & Petrochemicals, Oil & Gas, and More), and by Geography (United Kingdom, Germany, and More). The Market Forecasts are Provided in Terms of Value (USD).
Europe Industrial Waste Management Market Trends and Insights
Stringent EU Waste Management Directives
New EU rules create a decisive pull toward higher recovery rates and full traceability. The Packaging and Packaging Waste Regulation, effective February 2025, requires all packaging to be recyclable by 2030 and sets a 15% reuse mandate by 2040. The updated Waste Framework Directive tightens extended-producer-responsibility schemes and standardizes classification codes to ease cross-border movements. Meanwhile, the Waste Shipments Regulation bans exports of plastic waste to non-OECD states from November 2026 and enforces digital tracking via the DIWASS system. These laws push industrial generators to partner with certified providers capable of meeting stringent targets, which directly expands high-value segments such as recycling, energy recovery, and hazardous-waste neutralization. Although enforcement still varies across member states, the cumulative regulatory push adds 1.8 percentage points to the forecast CAGR of the European industrial waste management market.
Increasing Industrial Waste Generation Volumes
Europe's factories, chemical parks, and construction sites continue to produce larger waste streams as output grows and product cycles shorten. Hazardous waste climbed 2.25% per year between 2010 and 2024, with chemical and petrochemical hubs in Germany's Rhine-Ruhr region and the Netherlands generating the bulk of complex by-products requiring specialized treatment. Construction-material manufacturing alone discharges close to 400 million tonnes of largely non-hazardous debris annually, reinforcing demand for advanced sorting and recovery services. Electronics producers amplify the trend by releasing difficult-to-process miniaturized components rich in rare earth elements and precious metals. Although the Industrial Emissions Directive obliges plants to adopt best available techniques for waste minimization, the build-out of battery and renewable-energy supply chains offsets reduction gains. Overall, greater industrial output directly fuels volume growth in the European industrial waste management market, prompting operators to expand capacity, upgrade technology, and refine logistics networks.
High CAPEX for Advanced Treatment Facilities
Building state-of-the-art recycling or waste-to-energy assets is capital-intensive. A typical plant costs USD 4-10 million per MW, while advanced recycling installations run USD 54-218 million (EUR 50-200 million) depending on scale. LyondellBasell's German chemical-recycling project secured USD 43.6 million (EUR 40 million) in EU funding, and CIRCTEC raised USD 163.5 million (EUR 150 million) for Europe's largest tire-pyrolysis unit. Carbon-capture retrofits add USD 109-164 per tonne of CO2 capacity. Eastern Europe struggles to mobilize such funding because local financiers view waste assets as higher-risk, slowing deployment, and shaving 0.8 percentage points off the European industrial waste management market growth rate.
Other drivers and restraints analyzed in the detailed report include:
- Demand for Secondary Raw Materials in EV Battery Supply Chains
- Growing Corporate Sustainability & ESG Pressure
- Skilled-Labor Shortage in Eastern Europe
For complete list of drivers and restraints, kindly check the Table Of Contents.
Segment Analysis
Treatment & Disposal accounted for 53.78% of the European industrial waste management market share in 2025, cementing its role as the backbone of hazardous-waste neutralization and legacy infrastructure. This dominance stems from significant sunk investment in incinerators, physicochemical plants, and secure landfills that serve Germany, the Netherlands, and Belgium. Large chemical clusters rely on these facilities to comply with EU directives that forbid untreated hazardous output. Steady upgrades such as flue-gas cleaning and carbon-capture units maintain regulatory conformity and underpin stable cash flows. Collection and logistics services, though smaller, benefit from rising volume and specialized transport mandates for toxic streams. Digital route optimization and the impending DIWASS platform streamline cross-border documentation and elevate service value across the European industrial waste management market.
Recycling & Material Recovery is the fastest-growing service at a 6.72% CAGR through 2031, reflecting the pivot to circular models. Projects like LyondellBasell's German chemical-recycling plant and CIRCTEC's tire-pyrolysis unit illustrate capital intensity and innovation depth needed to unlock polymer and rubber value. Industrial symbiosis networks multiply feedstock availability by turning one firm's waste into another's input, especially in chemical parks. EU extended-producer-responsibility schemes under the PPWR mandate minimum recycled content in packaging, driving sustained demand. These dynamics propel the segment's share upward across the European industrial waste management market and attract equity capital despite high technical hurdles.
Landfill maintained a 44.32% slice of the European industrial waste management market size in 2025, anchored in historical capacity, simple permitting, and lower gate fees in parts of Eastern Europe. Yet escalating landfill taxes, stricter contamination thresholds, and public opposition have begun to erode its long-held lead. Operators face mounting obligations to capture methane and monitor leachate, inflating operational expenditures. Some choose to downsize or retrofit inactive cells into solar farms, diversifying revenue but shrinking pure landfill tonnage within the European industrial waste management market.
Incineration & Energy Recovery displays the quickest expansion at 7.31% CAGR, buoyed by more than USD 2.18 billion (EUR 2 billion) invested annually in new waste-to-energy units across the continent. SUEZ's USD 1.53 billion (EUR 1.4 billion) Toulouse facility, which integrates carbon capture, showcases evolving emission standards and added revenue through renewable-electricity certificates. Refuse-derived-fuel programs supply cement kilns, potentially displacing up to 85% of fossil heat needs. Enhanced thermal-plant efficiencies and co-location with district-heating networks boost attractiveness, progressively drawing volumes away from landfill and raising the profile of energy-recovery routes within the European industrial waste management market.
Complete Report Scope:
- By Service
- Collection
- Transportation & Logistics
- Treatment & Disposal
- Recycling & Material Recovery
- By Disposal Method
- Landfill
- Recycling
- Incineration & Energy Recovery (RDF, SRF, WtE)
- By Waste Type
- Non-hazardous
- Hazardous
- By Industry
- Chemicals & Petrochemicals
- Oil & Gas
- Power Generation
- Metal & Mining
- Food & Beverage Processing
- Pharmaceuticals
- Electrical & Electronics
- Construction Materials
- By Geography
- United Kingdom
- Germany
- France
- Italy
- Spain
- BENELUX (Belgium, Netherlands, and Luxembourg)
- NORDICS (Denmark, Finland, Iceland, Norway, and Sweden)
- Rest of Europe
List of Companies Covered in this Report:
- Veolia
- Suez
- Remondis
- PreZero International
- Biffa PLC
- Urbaser
- FCC Environment
- AVR
- Renewi
- Indaver
- ALBA Group
- Viridor
- Saubermacher Dienstleistungs AG
- Ragn-Sells
- Norsk Gjenvinning
- Paprec Group
- SARP Industries
- Derichebourg Environnement
- Tradebe
Additional Benefits:
- The market estimate (ME) sheet in Excel format
- 3 months of analyst support
TABLE OF CONTENTS
1 Introduction
- 1.1 Study Assumptions & Market Definition
- 1.2 Scope of the Study
2 Research Methodology
3 Executive Summary
4 Market Landscape
- 4.1 Market Overview
- 4.2 Market Drivers
- 4.2.1 Increasing industrial waste generation volumes
- 4.2.2 Stringent EU waste-management directives
- 4.2.3 Growing corporate sustainability & ESG pressure
- 4.2.4 Digital tracking & blockchain for waste traceability
- 4.2.5 Industrial symbiosis parks for waste-to-input exchange
- 4.2.6 Demand for secondary raw materials in EV battery supply chains
- 4.3 Market Restraints
- 4.3.1 High CAPEX for advanced treatment facilities
- 4.3.2 Fragmented regulatory enforcement across EU
- 4.3.3 Skilled-labour shortage in Eastern Europe
- 4.3.4 Volatile prices for recycled industrial materials
- 4.4 Value / Supply-Chain Analysis
- 4.5 Regulatory Landscape & Government Initiatives
- 4.6 Technological Outlook
- 4.7 Industry Attractiveness - Porter's Five Force Analysis
- 4.7.1 Threat of New Entrants
- 4.7.2 Bargaining Power of Suppliers
- 4.7.3 Bargaining Power of Buyers
- 4.7.4 Threat of Substitutes
- 4.7.5 Intensity of Competitive Rivalry
- 4.8 Insights on Industrial Waste Production
5 Market Size & Growth Forecasts (Values, In USD Billion)
- 5.1 By Service
- 5.1.1 Collection
- 5.1.2 Transportation & Logistics
- 5.1.3 Treatment & Disposal
- 5.1.4 Recycling & Material Recovery
- 5.2 By Disposal Method
- 5.2.1 Landfill
- 5.2.2 Recycling
- 5.2.3 Incineration & Energy Recovery (RDF, SRF, WtE)
- 5.3 By Waste Type
- 5.3.1 Non-hazardous
- 5.3.2 Hazardous
- 5.4 By Industry
- 5.4.1 Chemicals & Petrochemicals
- 5.4.2 Oil & Gas
- 5.4.3 Power Generation
- 5.4.4 Metal & Mining
- 5.4.5 Food & Beverage Processing
- 5.4.6 Pharmaceuticals
- 5.4.7 Electrical & Electronics
- 5.4.8 Construction Materials
- 5.5 By Geography
- 5.5.1 United Kingdom
- 5.5.2 Germany
- 5.5.3 France
- 5.5.4 Italy
- 5.5.5 Spain
- 5.5.6 BENELUX (Belgium, Netherlands, and Luxembourg)
- 5.5.7 NORDICS (Denmark, Finland, Iceland, Norway, and Sweden)
- 5.5.8 Rest of Europe
6 Competitive Landscape
- 6.1 Market Concentration
- 6.2 Strategic Moves
- 6.3 Market Share Analysis
- 6.4 Company Profiles (includes Global level Overview, Market level overview, Core Segments, Financials as available, Strategic Information, Products & Services, and Recent Developments)
- 6.4.1 Veolia
- 6.4.2 Suez
- 6.4.3 Remondis
- 6.4.4 PreZero International
- 6.4.5 Biffa PLC
- 6.4.6 Urbaser
- 6.4.7 FCC Environment
- 6.4.8 AVR
- 6.4.9 Renewi
- 6.4.10 Indaver
- 6.4.11 ALBA Group
- 6.4.12 Viridor
- 6.4.13 Saubermacher Dienstleistungs AG
- 6.4.14 Ragn-Sells
- 6.4.15 Norsk Gjenvinning
- 6.4.16 Paprec Group
- 6.4.17 SARP Industries
- 6.4.18 Derichebourg Environnement
- 6.4.19 Tradebe
7 Market Opportunities & Future Outlook
- 7.1 White-space & Unmet-need Assessment


