|
시장보고서
상품코드
2119914
인공지능(AI) 데이터센터 시장 : 점유율 분석, 업계 동향과 통계, 성장 예측(2026-2031년)Artificial Intelligence (AI) Data Center - Market Share Analysis, Industry Trends & Statistics, Growth Forecasts (2026 - 2031) |
||||||
 Mordor Intelligence
Mordor Intelligence에 의하면, 인공지능(AI) 데이터센터 시장 규모는 2025년 394억 9,000만 달러에서 2026년에는 494억 9,000만 달러로 확대되어 2026년부터 2031년까지 CAGR 25.32%로 성장을 지속하여, 2031년까지 1,529억 1,000만 달러에 이를 것으로 예측됩니다.
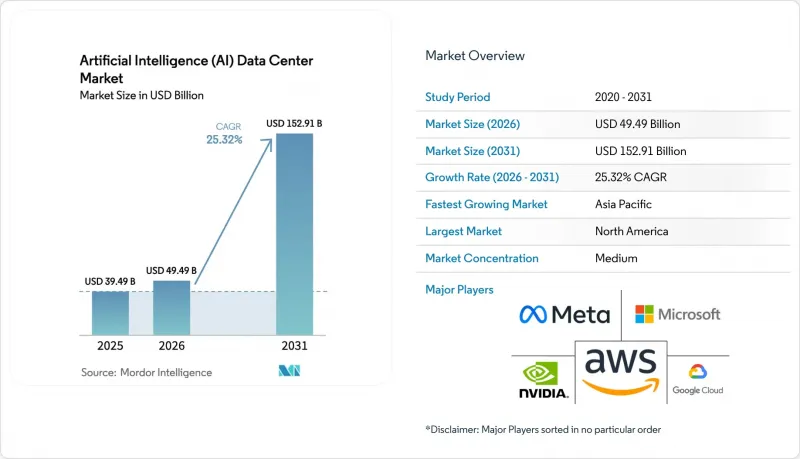
본 보고서는 데이터센터의 유형(클라우드 서비스 제공업체, 코로케이션 데이터센터 등), 구성 요소(하드웨어, 소프트웨어, 서비스), 티어 기준(Tier III 및 Tier IV), 최종 사용자 산업(IT 및 ITES, 인터넷 및 디지털 미디어, 통신 사업자 등) 및 지역별로 분류되어 있습니다. 시장 예측은 금액(달러)으로 표시됩니다.
세계 AI(인공지능) 데이터센터 시장 동향 및 인사이트
AI 모델 학습에 필요한 컴퓨팅 리소스의 폭발적인 증가
GPT-4급 네트워크와 같은 최첨단 모델의 훈련에는 2만 5,000대 이상의 NVIDIA H100 GPU가 연속 가동되는 경우가 있으며, 이로 인해 랙당 전력 소비량이 100kW를 초과하여 기존 시설의 한계를 넘어설 수 있습니다. 사업자는 NVLink나 InfiniBand와 같이 전용으로 설계된 상호 연결 패브릭을 도입해야 하며, 이로 인해 전용 화이트 스페이스 레이아웃이 요구됩니다. Meta는 10만 대 이상의 H100 GPU를 갖춘 클러스터를 구축하고 있으며, 이는 매개변수 규모가 물리적 용량 요구 사항과 직결됨을 여실히 보여줍니다. Mixture-of-experts(MOE) 아키텍처는 토큰의 총 처리량을 향상시키지만, 아이러니하게도 인프라의 점유 면적을 확대시켜 버립니다. 모델 훈련이 클라우드 제공업체 간의 주요 차별화 요소로 부상함에 따라, AI 지원 용량에는 수년에 걸친 예약 주기가 형성되고 있습니다. 이러한 예약으로 인해 기존 CPU 워크로드로 되돌릴 수 없는 수요가 고정화되어, 장기적인 가동률이 확고해지고 있습니다.
AI 가속기를 통합한 하이퍼스케일 클라우드 서비스의 보급 확대
Amazon EC2 P5 인스턴스는 노드당 8개의 H100 GPU를 통합하고 있으며, Microsoft Azure는 맞춤형 Maia 칩과 NVIDIA 장치를 결합하여 시설 설계를 이기종 가속기 베이로 전환하고 있습니다. Google의 TPU v5 포드에는 x86 랙 구성과는 다른 독자적인 냉각 루프와 고전류 버스웨이가 필요합니다. AI-as-a-Service 모델은 GPU의 지속적인 가동을 가져오며, 이것이 자본 집약적인 인프라 구축을 정당화하는 요인이 되고 있습니다. 마이크로소프트가 OpenAI에 대한 130억 달러 규모의 투자는 수년에 걸친 AI 워크로드를 확보하는 것의 중요성을 여실히 보여줍니다. 그 결과, 코어 수가 아닌 가속기의 가용성, 저지연 상호 연결, 그리고 지역적 커버리지를 통해 차별화를 꾀하는 용량 경쟁이 펼쳐지고 있습니다.
전기 요금 급등과 전력망 혼잡
2024년, 독일의 피크 시간대 전력 가격은 1kWh당 0.40유로(0.43달러)에 달하고,, 수개월에 걸친 훈련 실행의 경제성을 저해하고 있습니다. 버지니아주 북부의 전력 회사는 50MW를 초과하는 상호 연결을 동결하고 있어, 새로운 하이퍼스케일 시설의 건설이 지연되고 있습니다. 캘리포니아 ISO는 AI 훈련 피크 시간에 플렉스 경보를 발령하고 있으며, 이는 끊임없이 가동되는 GPU 클러스터가 지역 전력망에 얼마나 큰 부담을 주는지를 보여줍니다. 사업자 측은 온사이트 배터리 저장 장치나 부하 이동 알고리즘으로 대응하고 있지만, 이는 설비 투자 부담을 가중시킵니다. 대규모 전력 계약이 없는 중소규모 기업들은 불균형한 비용 압박에 직면하고 있으며, 그 결과 AI 연구개발이 자금력이 있는 소수의 업체에 집중될 우려가 있습니다.
부문 분석
2025년, 하이퍼스케일러 각사가 실리콘 직접 조달 경로와 독자적인 네트워크 패브릭을 활용한 결과, 클라우드 서비스 제공업체는 인공지능 데이터센터 시장의 55.12% 점유율을 차지했습니다. 한편, 코로케이션은 연평균 성장률(CAGR) 27.29%를 나타낼 것으로 예측되는데, 이는 시설을 소유하지 않으면서도 저지연 AI 추론을 원하는 기업 수요를 반영한 것입니다. 하이퍼스케일러가 캐리어 중립적인 캠퍼스 내 도매형 스위트를 임대하고, 훈련 백엔드를 데이터 중력 근처에 배치하는 하이브리드 전략도 부상하고 있습니다.
코로케이션 사업자들은 50kW 이상의 전력 용량을 가진 랙을 수용할 수 있도록 수냉식 플로어 레이아웃을 최적화하고, 크로스 커넥트를 AI 지원 서비스 카탈로그에 통합하고 있습니다. 예측 유지보수 및 실시간 개인화를 시행하는 기업들은 이러한 근접성의 이점을 적극적으로 활용하고 있습니다. Tier 2 도시의 엣지 로케이션은 AI의 적용 범위를 자율주행차 테스트베드와 산업용 IoT 게이트웨이까지 확대하고 있으며, 이에 따라 코로케이션 사업자들은 모듈형 냉각기와 400V 전력 트렁크에 대한 투자를 진행하고 있습니다. 계약에서는 단순한 공간이나 전력뿐만 아니라 지연 시간의 허용 범위가 규정되는 사례가 늘어나고 있으며, 이는 성능 지표가 임대 계약 관행을 어떻게 변화시키고 있는지를 보여줍니다. 인공지능 데이터센터 시장은 하이퍼스케일 지역을 대체하기보다는 이를 보완하는 이러한 분산형 인프라의 확충으로부터 혜택을 받고 있습니다.
2025년에는 조직들이 프레임워크 및 오케스트레이션 스택의 시범 도입을 추진함에 따라 소프트웨어가 45.12%의 점유율을 차지하며 시장을 주도했습니다. 그러나 가속기 및 고효율 전력 인프라 조달에 힘입어 하드웨어는 연평균 성장률(CAGR) 26.95%로 성장할 전망입니다. 전류 손실을 줄이기 위해 배전 장치는 208V에서 415V로 업그레이드되고 있으며, AI용 UPS 시스템에는 부분 부하 시 효율 향상을 위해 실리콘 카바이드 인버터가 탑재되고 있습니다.
운영자가 CRAH 장치를 더 높은 랙 밀도를 실현하는 후면 도어형 열교환기나 침지 탱크로 교체함에 따라 냉각 관련 지출이 증가하고 있습니다. 이러한 개조를 통해 인공지능 데이터센터 시장의 하드웨어 관련 시장 규모가 확대되고 있습니다. 이어서 서비스 수익도 증가하고 있습니다. 이는 기업 시설 관리 팀에 필요한 기술이 부족한 액체 루프의 설계, 시운전 및 유지보수를 통합 업체가 담당하고 있기 때문입니다. 플랫폼 벤더는 냉각 매니폴드를 통합한 턴키 랙을 번들로 제공함으로써 도입 기간을 단축하는 동시에 특정 가속기 유형을 중심으로 한 생태계를 강화하고 있습니다.
지역별 분석
북미는 성숙한 하이퍼스케일 캠퍼스, 견조한 벤처 자금, 그리고 송전망 업그레이드에 650억 달러를 투자하는 등 지원적인 정책 환경 덕분에 2025년에는 37.35%의 점유율을 차지했습니다. 버지니아주 북부와 실리콘 밸리에서는 송전 용량이 컴퓨팅 수요를 따라가지 못하는 제약이 발생하고 있어, 신규 건설은 텍사스주와 태평양 연안 북서부 지역으로 이동하고 있습니다. 수력 발전 자원이 풍부한 캐나다의 주들은 저탄소 전력을 추구하는 교육 클러스터를 유치하고 있는 반면, 멕시코는 공급망 위험을 완화하는 니어쇼어링 전략의 혜택을 받고 있습니다.
중국, 일본, 인도가 국가 디지털 아젠다에 AI 역량 목표를 포함하고 있는 만큼, 아시아태평양은 2031년까지 연평균 성장률(CAGR) 26.12%를 기록할 전망입니다. 베이징은 데이터 주권을 확보하기 위해 국내 GPU 개발 및 전용 캠퍼스에 연간 500억 달러 이상을 투자하고 있습니다. 도쿄는 지역 열 공급 루프에 연결된 수냉식 시설을 지원함으로써 총 에너지 비용과 온실가스 배출 강도를 낮추고 있습니다. 인도의 ‘디지털 인디아 2.0’ 프로그램은 2급 도시의 지역 AI 구역에 자금을 지원하여 기존 IT 허브를 넘어선 잠재 수요를 확대되고 있습니다.
유럽에서는 그 확대 속도가 완만하지만 꾸준합니다. 높은 전력 가격과 수자원 제약이 사업자들에게 과제로 대두되고 있지만, GDPR(EU 개인정보보호규정)(일반 데이터 보호 규정) 준수에 따라 기밀성이 높은 개인 데이터를 처리하는 AI 워크로드가 요구되고 있습니다. 독일과 영국은 풍력 발전과 지역 열 재사용을 동력원으로 하는 탄소 중립 캠퍼스에 대한 투자를 주도하고 있는 반면, 프랑스는 주권 클라우드 의무화를 활용하여 공공 부문의 AI를 현지화하고 있습니다. 북유럽은 낮은 기온과 풍부한 수력 발전이라는 강점을 바탕으로, 70kW 규모의 랙에서도 PUE를 1.2 이하로 유지하고 있습니다.
기타 혜택:
- 엑셀 형식 시장 예측(ME) 시트
- 3개월간의 애널리스트 지원
목차
제1장 서론
제2장 조사 방법
제3장 개요
제4장 시장 구도
제5장 시장 규모와 성장 예측
제6장 경쟁 구도
제7장 시장 기회와 향후 전망
JHSAccording to Mordor Intelligence, the artificial intelligence data center market size is expected to grow from USD 39.49 billion in 2025 to USD 49.49 billion in 2026 and is forecast to reach USD 152.91 billion by 2031 at 25.32% CAGR over 2026-2031.
This report is Segmented by Data Center Type (Cloud Service Providers, Colocation Data Centers, and More), Component (Hardware, Software, and Services), Tier Standard (Tier III and Tier IV), End-User Industry (IT and ITES, Internet and Digital Media, Telecom Operators, and More), and Geography. The Market Forecasts are Provided in Terms of Value (USD).
Global Artificial Intelligence (AI) Data Center Market Trends and Insights
Explosive Growth in AI Model-Training Compute Requirements
Training frontier models such as GPT-4 class networks can involve more than 25,000 NVIDIA H100 GPUs operating continuously, pushing per-rack power above 100 kW and outstripping legacy facility limits. Operators must deploy purpose-built interconnect fabrics, such as NVLink or InfiniBand, which dictate dedicated white-space layouts. Meta is constructing clusters with over 100,000 H100 GPUs, underscoring how parameter scale directly converts to physical capacity needs. Mixture-of-experts architectures increase total token throughput, paradoxically enlarging the infrastructure footprint. As model training becomes a primary differentiation lever among cloud providers, AI-ready capacity experiences multi-year reservation cycles. Those reservations lock in demand that cannot revert to traditional CPU workloads, cementing long-run utilization.
Rising Adoption of Hyperscale Cloud Services Integrating AI Accelerators
Amazon EC2 P5 instances integrate eight H100 GPUs per node, while Microsoft Azure combines custom Maia chips with NVIDIA devices, shifting facility design toward heterogeneous accelerator bays. Google's TPU v5 pods call for unique cooling loops and high-amperage busways that diverge from x86 rack profiles. AI-as-a-Service models result in continuous GPU occupancy, which justifies capital-intensive builds. Microsoft's USD 13 billion outlay with OpenAI illustrates the stakes in securing multi-year AI workloads. The result is a capacity arms race where differentiation hinges on accelerator availability, low-latency interconnects, and regional coverage rather than core count.
Soaring Electricity Costs and Grid Congestion
Peak power in Germany hit EUR 0.40 per kWh (USD 0.43) in 2024, eroding the economics of multi-month training runs. Northern Virginia utilities have frozen interconnections exceeding 50 MW, delaying new hyperscale builds. California ISO issued flex alerts during AI training peaks, illustrating how unrelenting GPU clusters can strain regional grids. Operators respond with on-site battery storage and load-shifting algorithms; however, these add to capital expenses. Smaller firms lacking bulk-power contracts face disproportionate cost pressure, potentially concentrating AI R&D within a handful of well-capitalized players.
Other drivers and restraints analyzed in the detailed report include:
- Government Incentives for Green and Energy-Efficient Data Centers
- Emergence of AI-Specific Liquid Cooling Shaping Facility Design
- Supply-Chain Constraints for High-End GPUs and Power Electronics
For complete list of drivers and restraints, kindly check the Table Of Contents.
Segment Analysis
Cloud Service Providers controlled 55.12% of the Artificial Intelligence Data Center market share in 2025 as hyperscalers capitalized on direct silicon supply lines and proprietary network fabrics. Colocation, however, is projected to log a 27.29% CAGR, reflecting enterprise appetite for low-latency AI inference without owning facilities. Hybrid strategies emerge where hyperscalers lease wholesale suites inside carrier-neutral campuses to place training backends near data gravity.
Colocation operators refine liquid-cooling floor layouts to host racks with power capacities of 50 kW or more and bundle cross-connects into AI-ready service catalogs. Enterprises running predictive maintenance or real-time personalization prefer these proximity advantages. Edge locations in tier-2 cities extend AI coverage to autonomous vehicle testbeds and industrial IoT gateways, prompting colocation landlords to invest in modular chillers and 400V power trunks. Contracts are increasingly stipulating latency budgets, rather than just space and power, demonstrating how performance metrics are reshaping leasing norms. The Artificial Intelligence Data Center market benefits from this distributed build-out, which complements rather than replaces hyperscale regions.
Software dominated the market with a 45.12% share in 2025, as organizations experimented with frameworks and orchestration stacks. However, hardware is slated to expand at a 26.95% CAGR, driven by the procurement of accelerators and high-efficiency power infrastructure. Power distribution units are upgraded from 208 V to 415 V to reduce amperage losses, while AI-class UPS systems incorporate silicon-carbide inverters for improved part-load efficiency.
Cooling spend increases as operators replace CRAH units with rear-door heat exchangers and immersion tanks, which enable higher rack densities. These retrofits elevate the Artificial Intelligence Data Center market size for hardware wallets. Services revenue follows, as integrators design, commission, and maintain liquid loops that enterprise facilities teams lack the skill to support. Platform vendors bundle turnkey racks with integrated cooling manifolds, compressing deployment timelines and reinforcing ecosystems around specific accelerator types.
Complete Report Scope:
- By Data Center Type
- Cloud Service Providers
- Colocation Data Centers
- Enterprise / On-Premises / Edge
- By Component
- Hardware
- Power Infrastructure
- Cooling Infrastructure
- IT Equipment
- Racks and Other Hardware
- Software
- Technology
- Machine Learning
- Deep Learning
- Natural Language Processing
- Computer Vision
- Services
- Managed Services
- Professional Services
- Hardware
- By Tier Standard
- Tier III
- Tier IV
- By End-user Industry
- IT and ITES
- Internet and Digital Media
- Telecom Operators
- Banking, Financial Services and Insurance (BFSI)
- Healthcare and Life Sciences
- Manufacturing and Industrial IoT
- Government and Defense
- By Geography
- North America
- United States
- Canada
- Mexico
- South America
- Brazil
- Argentina
- Chile
- Rest of South America
- Europe
- Germany
- United Kingdom
- France
- Italy
- Spain
- Rest of Europe
- Asia-Pacific
- China
- Japan
- South Korea
- India
- Australia
- Singapore
- Malaysia
- Rest of Asia-Pacific
- Middle East and Africa
- Middle East
- Saudi Arabia
- United Arab Emirates
- Turkey
- Rest of Middle East
- Africa
- South Africa
- Nigeria
- Rest of Africa
- Middle East
- North America
Geography Analysis
North America controlled a 37.35% share in 2025 owing to mature hyperscale campuses, strong venture funding, and a supportive policy backdrop that includes USD 65 billion for grid upgrades. Constraints surface in Northern Virginia and Silicon Valley, where transmission capacity lags compute demand, steering new builds toward Texas and the Pacific Northwest. Canada's hydro-rich provinces attract training clusters seeking low-carbon power, while Mexico benefits from near-shoring strategies that reduce supply-chain risk.
Asia-Pacific is on course for a 26.12% CAGR through 2031 as China, Japan, and India embed AI capacity targets in national digital agendas. Beijing funnels more than USD 50 billion annually into domestic GPU development and purpose-built campuses that secure data sovereignty. Tokyo incentivizes liquid-cooled facilities connected to district heating loops, thereby lowering total energy costs and greenhouse gas intensity. India's Digital India 2.0 program funds regional AI zones in tier-2 cities, widening addressable demand beyond legacy IT hubs.
Europe experiences slower but steady expansion. High electricity prices and water constraints pose challenges for operators, yet GDPR compliance requires AI workloads to process sensitive personal data. Germany and the United Kingdom spearhead investments in carbon-neutral campuses powered by wind and district heat reuse, while France leverages sovereign cloud mandates to localize public-sector AI. The Nordic region distinguishes itself through low ambient temperatures and abundant hydropower, keeping PUE below 1.2, even for 70 kW racks.
- Amazon Web Services Inc.
- Microsoft Corporation
- Alphabet Inc. (Google Cloud)
- NVIDIA Corporation
- Meta Platforms Inc.
- International Business Machines Corporation
- Oracle Corporation
- Alibaba Group Holding Limited (Alibaba Cloud)
- Tencent Holdings Limited (Tencent Cloud)
- Equinix Inc.
- Digital Realty Trust Inc.
- CyrusOne LLC
- Switch Inc.
- GDS Holdings Limited
- NTT Global Data Centers
- Huawei Technologies Co. Ltd.
- Baidu Inc. (Baidu AI Cloud)
- KDDI Corporation (Telehouse)
- OVH Groupe SA
- Iron Mountain Incorporated
Additional Benefits:
- The market estimate (ME) sheet in Excel format
- 3 months of analyst support
TABLE OF CONTENTS
1 INTRODUCTION
- 1.1 Study Assumptions and Market Definition
- 1.2 Scope of the Study
2 RESEARCH METHODOLOGY
3 EXECUTIVE SUMMARY
4 MARKET LANDSCAPE
- 4.1 Market Overview
- 4.2 PESTEL Analysis
- 4.3 Market Drivers
- 4.3.1 Explosive growth in AI model-training compute requirements
- 4.3.2 Rising adoption of hyperscale cloud services integrating AI accelerators
- 4.3.3 Government incentives for green and energy-efficient data centers
- 4.3.4 Emergence of AI-specific liquid cooling shaping facility design
- 4.3.5 Substation-level grid-edge AI forecasting enabling higher DC power density
- 4.3.6 Monetization of waste heat from AI clusters in district energy systems
- 4.4 Market Restraints
- 4.4.1 Soaring electricity costs and grid congestion
- 4.4.2 Supply-chain constraints for high-end GPUs and power electronics
- 4.4.3 Water-usage restrictions in drought-prone regions impacting cooling choices
- 4.4.4 Local community resistance to land and noise footprint in edge deployments
- 4.5 Impact on Sustainability and Carbon-Neutral Energy Goals
- 4.5.1 Sustainable Power Source and Management
- 4.5.1.1 Renewable vs Non-Renewable Sources of Power (Green DCs and AI Innovations)
- 4.5.1.2 Carbon-Footprint Reduction (Heat Pumps, District Cooling and Heating, others)
- 4.5.2 Sustainable Cooling Solutions and Management
- 4.5.2.1 Efficient Cooling Solutions for AI-Optimized DCs
- 4.5.2.2 PUE Ratio, WUE Ratio - Analysis
- 4.5.1 Sustainable Power Source and Management
- 4.6 Industry Ecosystem Analysis
- 4.7 Regulatory or Technological Outlook
- 4.8 Porter's Five Forces Analysis
- 4.8.1 Threat of New Entrants
- 4.8.2 Bargaining Power of Suppliers
- 4.8.3 Bargaining Power of Buyers
- 4.8.4 Threat of Substitutes
- 4.8.5 Intensity of Competitive Rivalry
5 MARKET SIZE AND GROWTH FORECASTS (VALUE)
- 5.1 By Data Center Type
- 5.1.1 Cloud Service Providers
- 5.1.2 Colocation Data Centers
- 5.1.3 Enterprise / On-Premises / Edge
- 5.2 By Component
- 5.2.1 Hardware
- 5.2.1.1 Power Infrastructure
- 5.2.1.2 Cooling Infrastructure
- 5.2.1.3 IT Equipment
- 5.2.1.4 Racks and Other Hardware
- 5.2.2 Software
- 5.2.2.1 Technology
- 5.2.2.2 Machine Learning
- 5.2.2.3 Deep Learning
- 5.2.2.4 Natural Language Processing
- 5.2.2.5 Computer Vision
- 5.2.3 Services
- 5.2.3.1 Managed Services
- 5.2.3.2 Professional Services
- 5.2.1 Hardware
- 5.3 By Tier Standard
- 5.3.1 Tier III
- 5.3.2 Tier IV
- 5.4 By End-user Industry
- 5.4.1 IT and ITES
- 5.4.2 Internet and Digital Media
- 5.4.3 Telecom Operators
- 5.4.4 Banking, Financial Services and Insurance (BFSI)
- 5.4.5 Healthcare and Life Sciences
- 5.4.6 Manufacturing and Industrial IoT
- 5.4.7 Government and Defense
- 5.5 By Geography
- 5.5.1 North America
- 5.5.1.1 United States
- 5.5.1.2 Canada
- 5.5.1.3 Mexico
- 5.5.2 South America
- 5.5.2.1 Brazil
- 5.5.2.2 Argentina
- 5.5.2.3 Chile
- 5.5.2.4 Rest of South America
- 5.5.3 Europe
- 5.5.3.1 Germany
- 5.5.3.2 United Kingdom
- 5.5.3.3 France
- 5.5.3.4 Italy
- 5.5.3.5 Spain
- 5.5.3.6 Rest of Europe
- 5.5.4 Asia-Pacific
- 5.5.4.1 China
- 5.5.4.2 Japan
- 5.5.4.3 South Korea
- 5.5.4.4 India
- 5.5.4.5 Australia
- 5.5.4.6 Singapore
- 5.5.4.7 Malaysia
- 5.5.4.8 Rest of Asia-Pacific
- 5.5.5 Middle East and Africa
- 5.5.5.1 Middle East
- 5.5.5.1.1 Saudi Arabia
- 5.5.5.1.2 United Arab Emirates
- 5.5.5.1.3 Turkey
- 5.5.5.1.4 Rest of Middle East
- 5.5.5.2 Africa
- 5.5.5.2.1 South Africa
- 5.5.5.2.2 Nigeria
- 5.5.5.2.3 Rest of Africa
- 5.5.5.1 Middle East
- 5.5.1 North America
6 COMPETITIVE LANDSCAPE
- 6.1 Market Concentration
- 6.2 Strategic Moves
- 6.3 Market Share Analysis
- 6.4 Company Profiles (includes Global level Overview, Market level overview, Core Segments, Financials as available, Strategic Information, Market Rank/Share for key companies, Products and Services, and Recent Developments)
- 6.4.1 Amazon Web Services Inc.
- 6.4.2 Microsoft Corporation
- 6.4.3 Alphabet Inc. (Google Cloud)
- 6.4.4 NVIDIA Corporation
- 6.4.5 Meta Platforms Inc.
- 6.4.6 International Business Machines Corporation
- 6.4.7 Oracle Corporation
- 6.4.8 Alibaba Group Holding Limited (Alibaba Cloud)
- 6.4.9 Tencent Holdings Limited (Tencent Cloud)
- 6.4.10 Equinix Inc.
- 6.4.11 Digital Realty Trust Inc.
- 6.4.12 CyrusOne LLC
- 6.4.13 Switch Inc.
- 6.4.14 GDS Holdings Limited
- 6.4.15 NTT Global Data Centers
- 6.4.16 Huawei Technologies Co. Ltd.
- 6.4.17 Baidu Inc. (Baidu AI Cloud)
- 6.4.18 KDDI Corporation (Telehouse)
- 6.4.19 OVH Groupe SA
- 6.4.20 Iron Mountain Incorporated
7 MARKET OPPORTUNITIES AND FUTURE OUTLOOK
- 7.1 White-Space and Unmet-Need Assessment