

|
시장보고서
상품코드
2120336
전자 유량계 : 시장 점유율 분석, 업계 동향 및 통계, 성장 예측(2026-2031년)Electromagnetic Flowmeter - Market Share Analysis, Industry Trends & Statistics, Growth Forecasts (2026 - 2031) |
||||||
 Mordor Intelligence
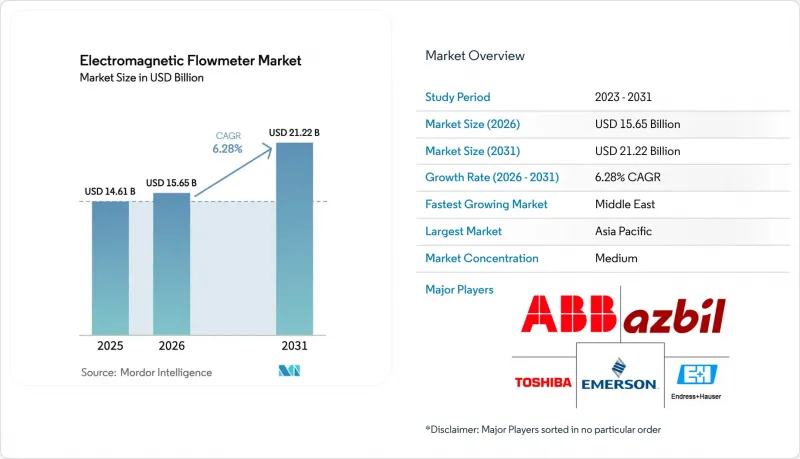
에 의하면, 전자 유량계 시장 규모는 2025년에 146억 1,000만 달러로 평가되었습니다. 2026년 156억 5,000만 달러에서 2031년까지 212억 2,000만 달러에 이를 것으로 예상되며, 예측 기간(2026-2031년) CAGR은 6.28%를 나타낼 전망입니다.
본 보고서는 제품 유형(인라인형 전자 유량계, 저유량용 전자 유량계 등), 구성 부품(유량관, 트랜스미터, 라이너), 라이너 재질(PTFE, PFA, 고무,세라믹), 통신 프로토콜(4-20 mA/HART, Profibus/Profinet 등), 최종 사용자 산업(상하수도, 석유 및 가스, 화학, 기타) 및 지역별로 분류되어 있습니다. 시장 예측은 금액(미 달러) 기준으로 제시되어 있습니다.
세계의 전자 유량계 시장 동향 및 인사이트
물 부족 심화가 유량계 도입을 촉진
지방 자치단체의 상수도 유틸리티자들은 신흥국에서 평균 30%에 달하며 연간 수익에서 약 390억 달러의 손실을 초래하는 무수익수 손실을 억제하기 위해 기계식 유량계를 전자기식 유량계로 교체하고 있습니다. 중국의 ‘남수북조’ 프로젝트에서는 1,432곳에 대한 지속적인 모니터링이 요구되고 있는 반면,인도에서는 15개 주에 걸쳐 약 2,000대의 ABB사 ‘AquaMaster’ 유량계가 설치되어, 방갈로르의 누수율이 18개월 만에 35%에서 22%로 감소했습니다. 미국 환경보호청(EPA)의 ‘WaterSense’ 프로그램에서는 현재 15분 간격으로 데이터를 전송하는 계측 기기에 대한 보조금이 지급되고 있어, 연간 120만 대에 달하는 교체 주기가 가속화되고 있습니다. 그러나 지역별 자금 배분의 불균형으로 인해 아프리카의 유틸리티자는 자본 예산의 4% 미만을 계량 기기에 할당하고 있으며, 공급업체는 대량 생산형 저가 기기부터 고도의 진단 기능을 갖춘 프리미엄 모델에 이르기까지 아우르는 다층적인 제품 라인업을 전개할 수밖에 없는 상황입니다.
엄격한 폐수 배출 규제
EU의 도시 하수 처리 지침 2024/3019에서는 2045년까지 에너지 중립적인 처리장 실현과 분기별 유량 보고가 의무화되어 있으며, 1만 8,000곳의 시설에 대해 데이터 로깅 기능이 탑재된 전자 유량계의 도입이 요구되고 있습니다. 미국의 사업자는 국가 오염 물질 배출 배제 시스템(NPDES)에 따른 위반 시 하루 최대 3만 7,500달러의 벌금이 부과되는 반면,캘리포니아주의 재생수 정책에서는 2030년까지 412개 시설에서 거래용 정밀도(Custody Transfer)에 따른 유량 검증이 의무화되어 있습니다. 중국은 섬유 산업 지역의 화학적 산소 요구량(COD) 기준치를 50 mg/L로 하향 조정하여, 8,200곳에서 설비 개조를 촉발했습니다. 이러한 정책들이 맞물리면서, 기존의 초음파식이나 차압식 계측기에서 영양염 제거 자동화에 대응하는 고정밀 자기 기술로의 수년 단위의 교체 주기가 가속화되고 있습니다.
비전도성 유체의 측정 능력 한계
실지 시험에 따르면, 전도도가 0.1µS/cm 미만을 72시간 동안 유지할 경우 정확도가 ±2% 이상 변동하는 것으로 밝혀졌으며, 이에 따라 바이오의약품 제조업체들은 일회용 어셈블리 방식의 광학식 센서로 전환을 추진하고 있습니다.
부문 분석
인라인 부문은 2025년 매출의 68%를 차지했으며, 그 주력은 ISO 4064에 기반한 계량 정확도 확보에 필수적인 ±0.5% 이내의 풀보어 정확도를 필요로 하는 상수도 유틸리티, 화학 처리 라인 및 식품 용도입니다. 한편, 저유량 부문은 일회용 바이오리액터 및 소규모 전해조 스키드의 성장에 힘입어 2031년까지 연평균 성장률(CAGR) 8.90%를 나타낼 것으로 예측됩니다. 주요 제약 시설에서는 생산을 중단하지 않고 현장에서 진단을 수행하는 엔드레스 하우저(Endress+Hauser)사의 ‘Promag W 800’을 도입한 결과, 검증 비용을 40% 절감할 수 있었다고 보고되었습니다.
삽입형 유량계는 풀보어형이 경제적으로 부적합한 24인치를 초과하는 대구경 파이프라인에 대응합니다. 애리조나주와 상파울루의 유틸리티자들은 자본 예산을 절약하기 위해 이 프로브를 선호하며, 비수익 유량에 대해 ±2%의 불확실성을 수용하고 있습니다. 한편, 초음파식 클램프온형 장치도 같은 시장에서 경쟁하고 있지만, 폭기나 고형물 부하가 증가하면 성능이 저하되기 때문에 슬러리 용도에서 삽입형 유량계 시장 점유율은 유지되고 있습니다. ABB의 모듈식 ‘ProcessMaster FEP620’은 이러한 추세를 뒷받침하는 기반이 되고 있습니다. 교체 가능한 라이너와 전극을 통해 여러 거점에서 사업을 운영하는 턴키 계약업체의 경우 예비 부품 재고를 35% 절감할 수 있습니다.
플로우 튜브는 2025년 부품 매출의 46%를 차지했으나, 저비용 아시아계 공급업체에 의한 상품화로 인해 OEM의 이익률이 압박받고 있으며, 그 결과 2031년까지 연평균 성장률(CAGR) 9.30%를 나타낼 것으로 예측되는 센서 및 코일 전자 기기로의 가치 전환이 진행되고 있습니다. 에머슨의 AMS 디바이스 매니저는 현재 전 세계적으로 120만 개의 코일을 추적하고 있으며, 고장 발생 전에 저항값의 편차를 감지함으로써 예기치 않은 가동 중단을 18% 줄이고 있습니다.
트랜스미터는 2025년 총 매출의 28%를 차지하며, 펌웨어 수명이 10년 이상으로 연장되었습니다. 지멘스가 2024년에 도입한 엣지 컴퓨팅 모듈은 로컬에서 이상 분석을 실행함으로써 데이터 주권 관련 규정 준수를 용이하게 할 뿐만 아니라, 클라우드 이용료를 60% 절감하고 있습니다. 엔들리스 하우저가 선구적으로 개발한 하이브리드 PTFE-세라믹 라이너는 전체 세라믹 튜브와 같은 막대한 비용을 들이지 않고도 슬러리 사용 기간을 5년으로 연장했으며, 모듈식 상태 인식 서브시스템으로 향하는 컴포넌트의 진화를 입증하고 있습니다.
지역별 분석
아시아태평양은 2025년 매출의 39%를 차지했습니다. 이는 중국의 분수로 프로젝트와 인도의 지역별 계량기 도입 프로젝트에 힘입은 결과로, 이를 통해 연간 출하 대수는 총 5만 8,000대에 달했습니다. 그러나 해당 지역의 가격 압박으로 인해 매출 총이익률은 18%로 축소되었으며, 세계 브랜드들은 교정 서비스와 사이버 보안의 신뢰성을 통해 차별화를 꾀할 수밖에 없는 상황입니다. 일본과 한국에서는 선진적인 도입 사례를 볼 수 있습니다. K-Water의 4만 2,000대의 스마트 계량기 덕분에 미수금률은 7%까지 낮아져 세계 최저 수준을 달성했습니다.
중동은 지역별로는 가장 빠른 성장을 기록하고 있으며, 그 원동력은 UAE 및 사우디아라비아의 수소 로드맵과 하루 1,150만 m3로 확대되는 해수 담수화 능력입니다. 높은 주변 온도에 대응하기 위해 IP68 및 NEMA 4X 규격의 케이스가 요구되고 있으며, 이로 인해 자재비는 증가하지만 저사양 수입품에 대한 기술적 진입 장벽은 높아지고 있습니다. 유럽 시장 점유율은 90억 유로의 수소 예산과 1만 8,000곳에서 실시간 유량 기록을 의무화하는 폐수 지침에 힘입어 유지되고 있습니다. 북미는 EPA의 ‘WaterSense’ 리베이트 제도를 중심으로 이에 뒤를 잇고 있습니다.
남미와 아프리카는 모두 재정적 제약에 직면해 있어 장비 교체 주기가 15년에 달하지만, 브라질의 사베스프(Sabesp)와 남아프리카의 랜드 워터(Rand Water)는 40% 이상의 누수를 해결하기 위해 여전히 전자기식 장치를 도입하고 있습니다. 각 공급업체들은 예산이 제한된 이러한 지역에 진출하기 위해 하이브리드형 자금 조달 및 구독 모델을 목표로 삼고 있습니다.
기타 혜택 :
- 엑셀 형식 시장 예측(ME) 시트
- 3개월간의 애널리스트 지원
자주 묻는 질문
목차
제1장 서론
제2장 조사 방법
제3장 주요 요약
제4장 시장 구도
제5장 시장 규모 및 성장 예측
제6장 경쟁 구도
제7장 시장 기회 및 향후 전망
KTH 26.09.10According to Mordor Intelligence, the electromagnetic flowmeter market size was valued at USD 14.61 billion in 2025 and is estimated to grow from USD 15.65 billion in 2026 to reach USD 21.22 billion by 2031, at a CAGR of 6.28% during the forecast period (2026-2031).
This report is Segmented by Product Type (In-Line Magnetic, Low-Flow Magnetic, and More), Component (Flow Tube, Transmitter, and Liner), Liner Material (PTFE, PFA, Rubber, and Ceramic), Communication Protocol (4-20 MA/HART, Profibus/Profinet, and More), End-User Industry (Water and Wastewater, Oil and Gas, Chemicals, and More), and Geography. The Market Forecasts are Provided in Terms of Value (USD).
Global Electromagnetic Flowmeter Market Trends and Insights
Rising Water Scarcity Driving Meter Adoption
Municipal utilities are replacing mechanical meters with electromagnetic units to curb non-revenue water losses that average 30% in emerging economies, draining an estimated USD 39 billion in annual revenue. China's South-to-North Water Diversion transfers demand continuous monitoring at 1,432 points, while India has installed about 2,000 ABB AquaMaster meters across 15 states, cutting leak rates in Bengaluru from 35% to 22% within 18 months. The U.S. EPA WaterSense program now subsidizes instruments that transmit 15-minute data, accelerating a 1.2 million-unit yearly replacement cycle. Regional funding asymmetry, however, means African utilities allocate less than 4% of capital budgets to metering, compelling vendors to field tiered portfolios that span high-volume, low-cost devices and premium, diagnostics-rich models.
Strict Wastewater-Discharge Regulations
The EU Urban Wastewater Treatment Directive 2024/3019 mandates energy-neutral plants by 2045 and quarterly flow reporting, forcing 18,000 facilities to adopt data-logging electromagnetic meters. U.S. operators face daily fines up to USD 37,500 for breaches under the National Pollutant Discharge Elimination System, while California's Recycled Water Policy requires custody-transfer-grade flow verification at 412 plants by 2030. China tightened chemical oxygen demand limits to 50 mg/L for textile zones, sparking retrofits across 8,200 sites. These policies together underpin a multiyear replacement cycle from legacy ultrasonic and differential-pressure devices toward high-accuracy magnetic technology compliant with nutrient-removal automation.
Limited Ability to Measure Non-Conductive Fluids
Field tests show accuracy drifts beyond +-2% when levels fall below 0.1 µS/cm for 72 hours, prompting biopharma producers to switch to optical sensors in single-use assemblies .
Other drivers and restraints analyzed in the detailed report include:
- Industrial Digitization and IIoT Integration
- Hydrogen Economy Projects Requiring Precise Electrolyzer Flow Control
- High Initial Installation Costs in Brownfield Plants
For complete list of drivers and restraints, kindly check the Table Of Contents.
Segment Analysis
The in-line segment commanded 68% of 2025 revenue, anchored by municipal water works, chemical processing lines, and food applications that need full-bore accuracy within +-0.5%, a capability vital to safeguarding billing integrity under ISO 4064. Yet the low-flow class is forecast to grow at 8.90% CAGR to 2031, energized by single-use bioreactors and small-scale electrolyzer skids. Leading pharmaceutical sites report validation cost savings of 40% after adopting Endress+Hauser Promag W 800, which runs in-situ diagnostics without halting production.
Insertion meters address large-diameter pipelines above 24 inches where full-bore models become uneconomical. Utilities in Arizona and Sao Paulo prefer the probes to stretch capital budgets, accepting +-2% uncertainty on non-revenue flows. Meanwhile, ultrasonic clamp-on devices vie for the same space but lose ground when aeration or solids load rise, preserving insertion share in slurry services. ABB's modular ProcessMaster FEP620 underpins this convergence: interchangeable liners and electrodes cut spare-parts inventory 35% for turnkey contractors managing multi-site roll-outs.
Flow tubes retained 46% of 2025 component revenue; however, commoditization from low-cost Asian vendors is eroding OEM margins, prompting value migration to sensor and coil electronics that will post a 9.30% CAGR through 2031. Emerson's AMS device manager now tracks 1.2 million coils worldwide, flagging resistance drift before failures and trimming unscheduled outages 18%.
Transmitters claimed 28% of the 2025 tally and enjoy firmware life extensions beyond a decade. Edge-computing modules introduced by Siemens in 2024 execute anomaly analytics locally, easing data-sovereignty compliance while slicing cloud charges 60%. Hybrid PTFE-ceramic liners pioneered by Endress+Hauser extend slurry service to five years without the full cost of all-ceramic tubes, evidencing component evolution toward modular, condition-aware subsystems.
Complete Report Scope:
- By Product Type
- In-line Magnetic Flowmeters
- Low-Flow Magnetic Flowmeters
- Insertion Magnetic Flowmeters
- By Component
- Flow Tube
- Transmitter
- Sensor and Coil Assembly
- Liner
- By Liner Material
- PTFE
- PFA
- Rubber
- Ceramic
- By Communication Protocol
- 4-20 mA / HART
- Modbus
- Profibus / Profinet
- Foundation Fieldbus
- By End-User Industry
- Water and Wastewater
- Oil and Gas
- Chemicals and Petrochemicals
- Power Generation
- Metals and Mining
- Food and Beverages
- Pulp and Paper
- Pharmaceuticals
- By Geography
- North America
- United States
- Canada
- Mexico
- South America
- Brazil
- Argentina
- Rest of South America
- Europe
- Germany
- United Kingdom
- France
- Italy
- Rest of Europe
- Asia-Pacific
- China
- Japan
- India
- South Korea
- Rest of Asia-Pacific
- Middle East
- Saudi Arabia
- United Arab Emirates
- Rest of Middle East
- Africa
- South Africa
- Egypt
- Rest of Africa
- North America
Geography Analysis
Asia-Pacific contributed 39% of 2025 revenues, driven by China's diversion canals and India's district-meter projects that collectively lifted annual unit shipments to 58,000. Yet the region's price pressure compresses gross margins to 18%, compelling global brands to differentiate on calibration services and cybersecurity credentials. Japan and South Korea showcase advanced deployments: K-Water's 42,000 smart meters cut non-revenue water to 7%, the world's lowest.
The Middle East records the fastest regional growth, catalyzed by the UAE and Saudi hydrogen roadmaps and desalination capacity scaling to 11.5 million m3/day. High ambient temperatures demand IP68, NEMA 4X enclosures, increasing material cost but raising technical barriers against low-spec imports. Europe's market share is buoyed by a EUR 9 billion hydrogen budget and wastewater directives mandating real-time flow logging at 18,000 sites. North America followed, anchored by EPA WaterSense rebates.
South America and Africa jointly face fiscal constraints that elongate replacement cycles to 15 years, yet Brazil's Sabesp and South Africa's Rand Water still deploy electromagnetic units to combat leakage topping 40%. Suppliers target hybrid financing and subscription models to penetrate these budget-limited geographies.
- ABB Ltd.
- Azbil Corporation
- Badger Meter, Inc.
- Burkert Fluid Control Systems
- Danaher Corporation (Hach)
- Emerson Electric Co.
- Endress+Hauser Group Services AG
- Fuji Electric Co., Ltd.
- GEA Group Aktiengesellschaft
- Honeywell International Inc.
- KROHNE Messtechnik GmbH
- McCrometer, Inc.
- Omega Engineering Inc. (Spectris plc)
- Schneider Electric SE
- Siemens Aktiengesellschaft
- SICK AG
- Spirax-Sarco Engineering plc (M&M International)
- Toshiba Corporation
- Yokogawa Electric Corporation
Additional Benefits:
- The market estimate (ME) sheet in Excel format
- 3 months of analyst support
TABLE OF CONTENTS
1 INTRODUCTION
- 1.1 Study Assumptions and Market Definition
- 1.2 Scope of the Study
2 RESEARCH METHODOLOGY
3 EXECUTIVE SUMMARY
4 MARKET LANDSCAPE
- 4.1 Market Overview
- 4.2 Market Drivers
- 4.2.1 Rising Water Scarcity Driving Meter Adoption
- 4.2.2 Strict Wastewater-Discharge Regulations
- 4.2.3 Industrial Digitization and IIoT Integration
- 4.2.4 Hydrogen Economy Projects Requiring Precise Electrolyzer Flow Control
- 4.2.5 Adoption in Biopharma Single-Use Systems
- 4.2.6 Emergence of Flowmeter-as-a-Service Business Models
- 4.3 Market Restraints
- 4.3.1 Limited Ability to Measure Non-Conductive Fluids
- 4.3.2 High Initial Installation Costs in Brownfield Plants
- 4.3.3 Rare-Earth Magnet Supply-Chain Price Volatility
- 4.3.4 Cybersecurity Concerns in Connected Devices
- 4.4 Industry Supply Chain Analysis
- 4.5 Regulatory Landscape
- 4.6 Technological Outlook
- 4.7 Porter's Five Forces Analysis
- 4.7.1 Bargaining Power of Suppliers
- 4.7.2 Bargaining Power of Buyers
- 4.7.3 Threat of New Entrants
- 4.7.4 Threat of Substitutes
- 4.7.5 Intensity of Competitive Rivalry
- 4.8 Impact of Macroeconomic Factors on the Global Electromagnetic Flowmeter Market
5 MARKET SIZE AND GROWTH FORECASTS (VALUE)
- 5.1 By Product Type
- 5.1.1 In-line Magnetic Flowmeters
- 5.1.2 Low-Flow Magnetic Flowmeters
- 5.1.3 Insertion Magnetic Flowmeters
- 5.2 By Component
- 5.2.1 Flow Tube
- 5.2.2 Transmitter
- 5.2.3 Sensor and Coil Assembly
- 5.2.4 Liner
- 5.3 By Liner Material
- 5.3.1 PTFE
- 5.3.2 PFA
- 5.3.3 Rubber
- 5.3.4 Ceramic
- 5.4 By Communication Protocol
- 5.4.1 4-20 mA / HART
- 5.4.2 Modbus
- 5.4.3 Profibus / Profinet
- 5.4.4 Foundation Fieldbus
- 5.5 By End-User Industry
- 5.5.1 Water and Wastewater
- 5.5.2 Oil and Gas
- 5.5.3 Chemicals and Petrochemicals
- 5.5.4 Power Generation
- 5.5.5 Metals and Mining
- 5.5.6 Food and Beverages
- 5.5.7 Pulp and Paper
- 5.5.8 Pharmaceuticals
- 5.6 By Geography
- 5.6.1 North America
- 5.6.1.1 United States
- 5.6.1.2 Canada
- 5.6.1.3 Mexico
- 5.6.2 South America
- 5.6.2.1 Brazil
- 5.6.2.2 Argentina
- 5.6.2.3 Rest of South America
- 5.6.3 Europe
- 5.6.3.1 Germany
- 5.6.3.2 United Kingdom
- 5.6.3.3 France
- 5.6.3.4 Italy
- 5.6.3.5 Rest of Europe
- 5.6.4 Asia-Pacific
- 5.6.4.1 China
- 5.6.4.2 Japan
- 5.6.4.3 India
- 5.6.4.4 South Korea
- 5.6.4.5 Rest of Asia-Pacific
- 5.6.5 Middle East
- 5.6.5.1 Saudi Arabia
- 5.6.5.2 United Arab Emirates
- 5.6.5.3 Rest of Middle East
- 5.6.6 Africa
- 5.6.6.1 South Africa
- 5.6.6.2 Egypt
- 5.6.6.3 Rest of Africa
- 5.6.1 North America
6 COMPETITIVE LANDSCAPE
- 6.1 Strategic Moves
- 6.2 Market Share Analysis
- 6.3 Company Profiles (includes Global Level Overview, Market Level Overview, Core Segments, Financials as available, Strategic Information, Market Rank/Share for Key Companies, Products and Services, and Recent Developments)
- 6.3.1 ABB Ltd.
- 6.3.2 Azbil Corporation
- 6.3.3 Badger Meter, Inc.
- 6.3.4 Burkert Fluid Control Systems
- 6.3.5 Danaher Corporation (Hach)
- 6.3.6 Emerson Electric Co.
- 6.3.7 Endress+Hauser Group Services AG
- 6.3.8 Fuji Electric Co., Ltd.
- 6.3.9 GEA Group Aktiengesellschaft
- 6.3.10 Honeywell International Inc.
- 6.3.11 KROHNE Messtechnik GmbH
- 6.3.12 McCrometer, Inc.
- 6.3.13 Omega Engineering Inc. (Spectris plc)
- 6.3.14 Schneider Electric SE
- 6.3.15 Siemens Aktiengesellschaft
- 6.3.16 SICK AG
- 6.3.17 Spirax-Sarco Engineering plc (M&M International)
- 6.3.18 Toshiba Corporation
- 6.3.19 Yokogawa Electric Corporation
7 MARKET OPPORTUNITIES AND FUTURE OUTLOOK
- 7.1 White-Space and Unmet-Need Assessment


