

|
시장보고서
상품코드
2120380
콘 크러셔 : 시장 점유율 분석, 업계 동향 및 통계, 성장 예측(2026-2031년)Cone Crusher - Market Share Analysis, Industry Trends & Statistics, Growth Forecasts (2026 - 2031) |
||||||
 Mordor Intelligence
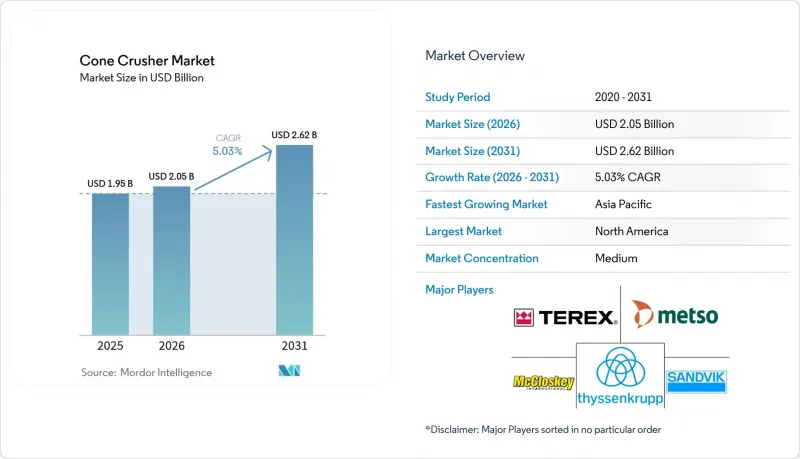
Mordor Intelligence에 의하면, 콘 크러셔 시장 규모는 2025년 19억 5,000만 달러로 평가되었습니다. 2026년에는 20억 5,000만 달러로 확대되어 2026년부터 2031년에 걸쳐 CAGR 5.03%로 성장을 지속하여, 2031년에는 26억 2,000만 달러에 이를 것으로 예측됩니다.
본 보고서는 유형별(사이먼스식, 유압식, 자이레터리식 등), 제공 형태별(이동식 파쇄기, 휴대용 파쇄기, 고정식 파쇄기),동력원별(전기 연결, 디젤 연결, 듀얼 연결), 최종 사용자용도별(광업 및 야금, 건설, 골재 처리, 해체 등), 지역별로 분류되어 있습니다. 시장 예측은 금액(달러) 기준으로 제시되어 있습니다.
세계의 콘 크러셔 시장 동향 및 인사이트
신흥국 광업 부문 수요 증가
브라질은 2024년부터 2028년까지 640억 달러 규모의 광업 투자를 계획하고 있으며, 이 중 153억 8,000만 달러는 리튬 및 니켈과 같은 전략적 광물에 할당되어 있습니다. 인도네시아의 알루미나 생산량은 국내 가공을 의무화하는 규제로 인해 현지 분쇄 능력이 중시된 것을 배경으로, 2025년에는 850만 톤에 달했습니다. 인도에서는 80곳 이상의 알루미늄 광산이 가동 중이며, 건설 지출은 1조 달러에 육박하고 있습니다. 이로 인해 2차 분쇄 처리 능력의 안정적인 공급이 필수적입니다. 이러한 동향은 정확한 제품 크기를 유지하고, 가동 중지 시간을 최소화하며, 하류 선광 공정과 통합할 수 있는 콘 크러셔에 대한 지속적인 수요를 뒷받침하고 있습니다. 따라서 정제 광석에는 엄격한 급광 입도 분포가 요구되는데, 이를 확실하게 실현할 수 있는 것은 최신 유압식 유닛뿐이므로, 콘 크러셔 시장은 정책 주도형 선광 이니셔티브로부터 직접적인 혜택을 받고 있습니다.
전 세계 인프라 및 건설 활동의 성장
중국, 미국, 인도, 인도네시아, 러시아, 캐나다, 멕시코 등 7개국은 2025년까지 전 세계 건설 성장의 72%를 차지했습니다. 중국과 인도만 해도 2025년까지 2억 7,000만 호의 신규 주택이 필요했으며, 한편 아시아의 도시화율은 2030년까지 55%를 넘어 골재 수요를 끌어올릴 것으로 보입니다. 주택 분야 외에도 브라질은 철도, 항만, 도로 현대화에 103억 6,000만 달러를 책정하고 있어, 이로 인해 벌크 자재 수요가 더욱 증가하고 있습니다. 케냐의 채석 업계에서는 2023년에 4,500만 톤의 골재가 처리되었으며, 그중 60%는 이동식 분쇄기를 통해 처리되었습니다. 대규모이며 여러 현장에 걸쳐 진행되는 프로젝트가 급증함에 따라, 신속하게 이동할 수 있고 프로젝트별 사양에 맞출 수 있는 이동식 콘 크러셔가 선호되고 있으며, 이는 콘 크러셔 시장의 성장을 뒷받침하고 있습니다.
엄격한 배기가스 및 소음 규제
EPA의 NSPS 서브파트 OOO는 2008년 4월 이후 건설된 플랜트에 대해 입자상 물질 배출 한도를 0.032 g/dscm으로 강화하고, 허용되는 비산 불투명도를 12%로 낮추고 있습니다. 규정을 준수하기 위해서는 대부분의 경우 백필터(baghouse)를 도입해야 하며, 이로 인해 플랜트의 에너지 소비량이 16-19% 증가합니다. 텍사스주에서는 임시 설치된 분쇄기에 대해 200피트의 세트백을 의무화하고 있으며, 분류에 따라 처리 능력을 125-250 t/h로 제한하고 있습니다. EPA 방법 5, 17 및 9를 사용한 초기 성능 시험은 가동 개시 후 180일 이내에 완료해야 하며, 5년마다 반복하여 실시해야 합니다. 이로 인해 행정적 및 재정적 부담이 발생하며, 이는 콘 크러셔 시장의 단기적인 확장을 억제하는 요인이 되고 있습니다.
부문 분석
유압식 모델은 2025년 매출의 45.12%를 차지했고 연평균 성장률(CAGR) 6.51%를 나타낼 것으로 예측되어, 다른 모든 카테고리를 능가하는 실적을 보이고 있습니다. 유압식 플랫폼의 자동 설정 조정 기능과 캐비티 청소 기능을 통해 이물질 혼입 시 다운타임을 단축하고 제품 품질의 안정성을 유지합니다. 기존의 사이먼스식 스프링 방식 기계는 비용 중심의 운영에서 틈새 수요를 유지하고 있지만, 정교한 제어 로직이 부족합니다. 연속 운전형 자이로트리 크러셔는 초고처리 능력이 요구되는 1차 파쇄 공정에서 활용되고 있지만, 새롭게 등장한 진동 구동형 개념은 여전히 실험 단계에 머물러 있습니다. 콘 크러셔 시장은 메초(Metso)사의 차세대 모델인 ‘Nordberg HPe’와 같은 OEM 각사의 투자 혜택을 받고 있습니다. 이 모델에는 광업 및 골재 처리를 위해 강화된 유압 시스템과 디지털 센서가 탑재되어 있습니다.
대규모 광산에서 원격 제어 센터의 활용이 확대됨에 따라 유압식 채택이 더욱 진전되고 있습니다. 운영자는 몇 초 만에 CSS 설정을 미세 조정하여 회로의 안정성과 분쇄기의 처리 능력을 향상시킬 수 있습니다. 이러한 기능은 유압식 설계의 경쟁 우위를 강화하고, 2031년까지의 콘 크러셔 시장 규모 전망에서 그 점유율을 확대시키고 있습니다.
2025년에는 이동식 분쇄기가 전 세계 판매의 58.05%를 차지했으며, 연평균 성장률(CAGR)은 6.74%를 기록할 전망입니다. 시공 업체들은 48시간 이내에 플랜트를 접고, 이전하고, 재가동할 수 있다는 점을 높이 평가하고 있으며, 이를 통해 고정 시설에 수반되는 운송 도로 비용 및 환경 허가 취득을 피할 수 있습니다. 바퀴가 달린 휴대용 유닛은 중간 수준의 요구를 충족시키며, 초기 투자 비용은 낮지만 외부 발전기나 상용 전원이 필요합니다. 규모의 경제가 지배적인 처리량이 매우 많은 채석장에서는 여전히 상설 설비가 주류를 이루고 있지만, 이러한 도입 사례에서도 토목 공사를 단축하기 위해 모듈식 스키드가 채택되고 있습니다.
전동화는 이동식 설비의 가치 제안을 더욱 매력적으로 만들고 있습니다. Kleemann사의 MOBICONE MCO 110 PRO는 차량용 축전 시스템을 통합하고 있어, 열차 전체가 단일 케이블 급전으로 가동될 수 있으므로, 전력망이 재생에너지에서 공급되는 경우 현장에서의 배출량을 제로로 억제할 수 있습니다. 이러한 혁신을 통해 콘 크러셔 시장의 이동식 부문에서 선도적인 입지를 유지하고 있습니다.
지역별 분석
2025년, 북미는 전 세계 매출의 38.60%를 차지했습니다. 이는 애리조나주, 온타리오주, 치와와주의 성숙한 광업 부문과 더불어, 구매자들을 밀폐형 자동화 플랜트로 이끄는 EPA(미국 환경보호청)의 엄격한 미세먼지 배출 규제에 힘입은 결과입니다. 교량 교체부터 배터리 공장 건설에 이르기까지 미국의 인프라 갱신은 골재 생산의 안정적인 기반을 제공하며, 콘 크러셔 시장 수요를 뒷받침하고 있습니다. 캐나다의 경암 광산에서는 겨울철 외딴 지역에서도 가동 가능한 견고한 유압식 기계가 선호됩니다. 한편, 멕시코의 건설 회랑은 몬테레이에서 멕시코만까지 뻗어 있으며, 국경을 넘는 물류 번거로움을 덜어주는 이동식 기계군이 도입되고 있습니다.
아시아태평양은 2031년까지 연평균 성장률(CAGR)이 6.55%로 가장 빠른 성장세를 기록하고 있으며, 중국, 인도, 인도네시아가 합쳐서 수조 달러 규모의 자금을 주택, 교통, 에너지 분야에 투입하고 있습니다. 인도네시아의 건설 지출만 보더라도, 신수도 ‘누산타라’와 섬 간 고속도로 건설을 원동력으로 연간 7.5%의 속도로 증가하고 있습니다. 국내에서 광석 선광을 의무화하는 정책에 따라 파쇄·분쇄 공정에 대한 수요가 크게 증가하고 있습니다. 유럽은 규제 주도형의 안정적인 시장으로, 순환 경제 관련 법규에 따라 건설 및 해체(C&D) 폐기물의 재활용이 의무화되어 있습니다. 독일과 네덜란드의 도시 지역 건설 현장에서는 소음 상한선이 70dB로 설정되어 있어, 전기식 또는 하이브리드식 파쇄기가 선호되고 있습니다. 중동 및 아프리카에서는 구리, 금, 인프라 회랑과 관련된 프로젝트에 연동된 적당한 수요가 나타나고 있지만, 정치적 리스크로 인해 입찰이 정체될 가능성이 있습니다. 남미에서는 브라질의 640억 달러 규모 광업 로드맵이 호재로 작용하고 있으며, 칠레의 리튬과 페루의 구리도 부수적인 성장 동력을 제공합니다.
기타 혜택 :
- 엑셀 형식 시장 예측(ME) 시트
- 3개월간의 애널리스트 지원
자주 묻는 질문
목차
제1장 서론
제2장 조사 방법
제3장 주요 요약
제4장 시장 구도
제5장 시장 규모 및 성장 예측
제6장 경쟁 구도
제7장 시장 기회 및 향후 전망
KTH 26.09.10According to Mordor Intelligence, the cone crusher market size is expected to grow from USD 1.95 billion in 2025 to USD 2.05 billion in 2026 and is forecast to reach USD 2.62 billion by 2031 at 5.03% CAGR over 2026-2031.
This report is Segmented by Type (Symons, Hydraulics, Gyratory, and More), Offering (Mobile Crushers, Portable Crushers, and Stationary Crushers), Power Source (Electric Connection, Diesel Connection, and Dual Connection), End-User Application (Mining and Metallurgy, Construction, Aggregate Processing, Demolition, and More), and Geography. The Market Forecasts are Provided in Terms of Value (USD).
Global Cone Crusher Market Trends and Insights
Rising Demand from Mining Sector in Emerging Economies
Brazil plans USD 64 billion of mining investment for 2024-2028, including USD 15.38 billion for strategic minerals such as lithium and nickel. Indonesia's alumina output reached 8.5 million t in 2025 on the back of domestic-processing mandates that favor localized crushing capacity. India operates more than 80 aluminum mines and is approaching a USD 1 trillion construction spend, together necessitating consistent secondary crushing throughput. These developments underpin sustained uptake of cone crushers that can maintain precise product sizing, minimize downtime, and integrate with downstream beneficiation. The cone crusher market therefore benefits directly from policy-driven beneficiation initiatives, as refined ores require tight feed gradations that only modern hydraulic units reliably deliver.
Growth of Global Infrastructure and Construction Activities
Seven nations, China, the United States, India, Indonesia, Russia, Canada, and Mexico, are projected to generate 72% of global construction growth through 2025. China and India alone need 270 million new homes by 2025, while Asia's urbanization rate will exceed 55% by 2030, elevating aggregate demand. Beyond housing, Brazil earmarked USD 10.36 billion to modernize railways, ports, and roads, reinforcing bulk-material requirements. Kenya's quarry sector processed 45 million t of aggregates in 2023, of which 60% came from mobile crushers. The surge in large-scale, multi-site projects favors mobile cone crushers that can relocate quickly and conform to project-specific specifications, propelling the cone crusher market.
Stringent Emission and Noise Regulations
EPA NSPS Subpart OOO tightens particulate limits to 0.032 g/dscm for plants built after April 2008 and reduces allowable fugitive opacity to 12%. Compliance often requires baghouses that add 16-19% to a plant's energy draw. Texas mandates 200-ft setbacks for temporary crushers and caps throughput between 125-250 t/h depending on classification. Initial performance tests using EPA Methods 5, 17, and 9 must be completed within 180 days of start-up and repeated every five years, imposing administrative and financial burdens that moderate the cone crusher market's near-term expansion.
Other drivers and restraints analyzed in the detailed report include:
- Rapid Adoption of Automated and Digitalized Cone Crushers
- Increasing Shift Toward Mobile Crushing Solutions
- High Capital and Maintenance Costs
For complete list of drivers and restraints, kindly check the Table Of Contents.
Segment Analysis
Hydraulic models captured 45.12% of 2025 revenue and are projected to post a 6.51% CAGR, outperforming all other categories. The hydraulic platform's automatic setting regulation and cavity-clearing cut downtime during tramp events, preserving product consistency. Traditional Symons-style spring machines retain niche demand in cost-sensitive operations but lack advanced control logic. Continuous-duty gyratory crushers serve ultra-high-throughput primary positions, while nascent vibration-driven concepts remain experimental. The cone crusher market benefits from OEM investments such as Metso's next-generation Nordberg HPe, which embeds reinforced hydraulics and digital sensors for mining and aggregates duty.
The rising use of remote-operation centers in large mines amplifies hydraulic adoption. Operators can tweak CSS settings in seconds, improving circuit stability and grinding-mill throughput. These capabilities reinforce the competitive advantage of hydraulic designs and enlarge their share of cone crusher market size forecasts through 2031.
Mobile crushers represented 58.05% of global sales in 2025 and are tracking a 6.74% CAGR. Contractors favor the ability to fold up, relocate, and recommission plants in under 48 hours, sidestepping haul-road costs and environmental permitting tied to fixed sites. Wheeled portable units fill intermediate needs, offering lower capital costs but requiring external generators or line power. Permanent installations still dominate extremely high-volume quarries where economies of scale prevail, yet even these deployments adopt modular skids to shorten civil works.
Electrification sweetens the mobile value proposition. Kleemann's MOBICONE MCO 110 PRO integrates on-board power storage so the entire train can run via a single cable feed, cutting onsite emissions to zero when the grid is green. Such innovations sustain the mobile segment's leadership within the cone crusher market.
Complete Report Scope:
- By Type
- Symons
- Hydraulics
- Gyratory
- Other Types
- By Offering
- Mobile Crushers
- Portable Crushers
- Stationary Crushers
- By Power Source
- Electric Connection
- Diesel Connection
- Dual Connection
- By End-user Application
- Mining and Metallurgy
- Construction
- Aggregate Processing
- Demolition
- Other End-user Applications
- By Geography
- North America
- United States
- Canada
- Mexico
- South America
- Brazil
- Argentina
- Chile
- Rest of South America
- Europe
- Germany
- United Kingdom
- France
- Italy
- Netherlands
- Rest of Europe
- Asia-Pacific
- China
- India
- Japan
- South Korea
- Rest of Asia-Pacific
- Middle East and Africa
- Middle East
- Saudi Arabia
- United Arab Emirates
- Turkey
- Rest of Middle East
- Africa
- South Africa
- Nigeria
- Rest of Africa
- Middle East
- North America
Geography Analysis
North America held 38.60% of global turnover in 2025, anchored by mature mining sectors in Arizona, Ontario, and Chihuahua and by rigorous EPA particulate limits that steer buyers toward enclosed, automated plants. U.S. infrastructure renewal, from bridge replacements to battery-factory build-outs, provides a steady base for aggregates output, underpinning cone crusher market demand. Canadian hard-rock mines favor rugged hydraulic machines capable of remote winter operation, whereas Mexico's construction corridor stretches from Monterrey to the Gulf, absorbing mobile fleets that bypass border logistics.
Asia-Pacific logs the swiftest growth at 6.55% CAGR through 2031 as China, India, and Indonesia collectively channel multi-trillion-dollar funding into housing, transport, and energy. Indonesia's construction outlay alone is rising 7.5% annually, driven by the new Nusantara capital and trans-island highways. Policy mandates pushing ore beneficiation within national borders create outsized demand for crush-grind circuits. Europe presents a stable, regulation-driven arena where circular-economy statutes compel C&D recycling. Urban job sites in Germany and the Netherlands impose 70 dB noise caps, favoring electric or hybrid crushers. The Middle East and Africa record moderate, project-linked uptake tied to copper, gold, and infrastructure corridors, though political risk can stall tenders. South America receives impetus from Brazil's USD 64 billion mining roadmap, with ancillary momentum in Chilean lithium and Peruvian copper.
- Metso Corporation
- Sandvik AB
- Terex Corporation
- Astec Industries Inc.
- Thyssenkrupp AG
- FLSmidth and Co. A/S
- McCloskey International Ltd.
- WESTPRO Machinery Inc.
- Puzzolana Machinery Fabricators LLP
- Keestrack NV
- Tesab Engineering Ltd.
- The Weir Group PLC
- Wirtgen Group (GmbH)
- KPI-JCI and Astec Mobile Screens Inc.
- Sepro Mineral Systems Corp.
- Minyu Machinery Corp.
- Zhejiang MP Mining Equipment Co., Ltd.
- Nanchang Mineral Systems Co., Ltd.
- Superior Industries Inc.
- Shanghai Zenith Mineral Co., Ltd.
- Propel Industries Pvt Ltd.
- Tesab Engineering Ltd.
Additional Benefits:
- The market estimate (ME) sheet in Excel format
- 3 months of analyst support
TABLE OF CONTENTS
1 INTRODUCTION
- 1.1 Study Assumptions and Market Definition
- 1.2 Scope of the Study
2 RESEARCH METHODOLOGY
3 EXECUTIVE SUMMARY
4 MARKET LANDSCAPE
- 4.1 Market Overview
- 4.2 Market Drivers
- 4.2.1 Rising demand from mining sector in emerging economies
- 4.2.2 Growth of global infrastructure and construction activities
- 4.2.3 Rapid adoption of automated and digitalised cone crushers
- 4.2.4 Increasing shift toward mobile crushing solutions
- 4.2.5 Surge in recycled-aggregate demand (circular-economy push)
- 4.2.6 Remote monitoring and predictive-maintenance integration
- 4.3 Market Restraints
- 4.3.1 Stringent emission and noise regulations
- 4.3.2 High capital and maintenance costs
- 4.3.3 Manganese-steel supply-chain volatility
- 4.3.4 Competition from energy-efficient alternative comminution
- 4.4 Industry Value Chain Analysis
- 4.5 Regulatory Landscape
- 4.6 Technological Outlook
- 4.7 Porter's Five Forces Analysis
- 4.7.1 Bargaining Power of Suppliers
- 4.7.2 Bargaining Power of Buyers
- 4.7.3 Threat of New Entrants
- 4.7.4 Threat of Substitutes
- 4.7.5 Intensity of Competitive Rivalry
- 4.8 Investment Analysis
5 MARKET SIZE AND GROWTH FORECASTS (VALUE)
- 5.1 By Type
- 5.1.1 Symons
- 5.1.2 Hydraulics
- 5.1.3 Gyratory
- 5.1.4 Other Types
- 5.2 By Offering
- 5.2.1 Mobile Crushers
- 5.2.2 Portable Crushers
- 5.2.3 Stationary Crushers
- 5.3 By Power Source
- 5.3.1 Electric Connection
- 5.3.2 Diesel Connection
- 5.3.3 Dual Connection
- 5.4 By End-user Application
- 5.4.1 Mining and Metallurgy
- 5.4.2 Construction
- 5.4.3 Aggregate Processing
- 5.4.4 Demolition
- 5.4.5 Other End-user Applications
- 5.5 By Geography
- 5.5.1 North America
- 5.5.1.1 United States
- 5.5.1.2 Canada
- 5.5.1.3 Mexico
- 5.5.2 South America
- 5.5.2.1 Brazil
- 5.5.2.2 Argentina
- 5.5.2.3 Chile
- 5.5.2.4 Rest of South America
- 5.5.3 Europe
- 5.5.3.1 Germany
- 5.5.3.2 United Kingdom
- 5.5.3.3 France
- 5.5.3.4 Italy
- 5.5.3.5 Netherlands
- 5.5.3.6 Rest of Europe
- 5.5.4 Asia-Pacific
- 5.5.4.1 China
- 5.5.4.2 India
- 5.5.4.3 Japan
- 5.5.4.4 South Korea
- 5.5.4.5 Rest of Asia-Pacific
- 5.5.5 Middle East and Africa
- 5.5.5.1 Middle East
- 5.5.5.1.1 Saudi Arabia
- 5.5.5.1.2 United Arab Emirates
- 5.5.5.1.3 Turkey
- 5.5.5.1.4 Rest of Middle East
- 5.5.5.2 Africa
- 5.5.5.2.1 South Africa
- 5.5.5.2.2 Nigeria
- 5.5.5.2.3 Rest of Africa
- 5.5.5.1 Middle East
- 5.5.1 North America
6 COMPETITIVE LANDSCAPE
- 6.1 Market Concentration
- 6.2 Strategic Moves
- 6.3 Market Share Analysis
- 6.4 Company Profiles (includes Global level Overview, Market level Overview, Core Segments, Financials as available, Strategic Information, Market Rank/Share, Products and Services, Recent Developments)
- 6.4.1 Metso Corporation
- 6.4.2 Sandvik AB
- 6.4.3 Terex Corporation
- 6.4.4 Astec Industries Inc.
- 6.4.5 Thyssenkrupp AG
- 6.4.6 FLSmidth and Co. A/S
- 6.4.7 McCloskey International Ltd.
- 6.4.8 WESTPRO Machinery Inc.
- 6.4.9 Puzzolana Machinery Fabricators LLP
- 6.4.10 Keestrack NV
- 6.4.11 Tesab Engineering Ltd.
- 6.4.12 The Weir Group PLC
- 6.4.13 Wirtgen Group (GmbH)
- 6.4.14 KPI-JCI and Astec Mobile Screens Inc.
- 6.4.15 Sepro Mineral Systems Corp.
- 6.4.16 Minyu Machinery Corp.
- 6.4.17 Zhejiang MP Mining Equipment Co., Ltd.
- 6.4.18 Nanchang Mineral Systems Co., Ltd.
- 6.4.19 Superior Industries Inc.
- 6.4.20 Shanghai Zenith Mineral Co., Ltd.
- 6.4.21 Propel Industries Pvt Ltd.
- 6.4.22 Tesab Engineering Ltd.
7 MARKET OPPORTUNITIES AND FUTURE OUTLOOK
- 7.1 White-space and Unmet-Need Assessment


