

|
시장보고서
상품코드
2120469
화재 안전 시스템 : 시장 점유율 분석, 업계 동향 및 통계, 성장 예측(2026-2031년)Fire Safety Systems - Market Share Analysis, Industry Trends & Statistics, Growth Forecasts (2026 - 2031) |
||||||
 Mordor Intelligence
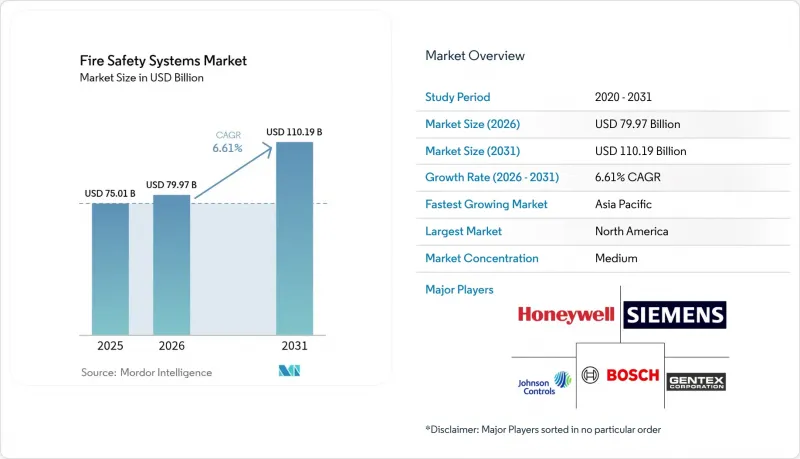
Mordor Intelligence에 의하면, 2026년 화재 안전 시스템 시장 규모는 799억 7,000만 달러로 추정되고 2025년 750억 1,000만 달러에서 확대해, 2031년에는 1,101억 9,000만 달러에 이를 것으로 예측됩니다.
2026-2031년 동안의 연평균 성장률(CAGR)은 6.61%를 나타낼 전망입니다.
본 보고서는 기술별(수동형 화재 안전 시스템, 능동형 화재 안전 시스템), 제품별(가스·거품 등을 이용한 소화 설비, 기타), 최종 사용자별(상업, 산업, 기타), 연결 방식별(유선 시스템, 무선 시스템), 지역별(북미, 남미, 기타)로 분류되어 있습니다. 시장 전망은 금액(달러) 기준으로 제시되어 있습니다.
세계의 화재 안전 시스템 시장 동향 및 인사이트
정부의 엄격한 화재 안전 규제
NFPA 72의 2025년판에서는 상업용 패널에 대한 클라우드 연결형 모니터링이 의무화되어, 이로 인해 구형 시스템의 업그레이드가 촉진되는 한편, 입주 계약 갱신 시 규정을 준수하지 않는 소유주에게 벌칙이 부과되게 되었습니다. 2024년판 ‘국제 방화 규정(International Fire Code)’에서는 수용 인원 300명을 초과하는 집회 시설에 자동 소화 시스템 설치가 의무화되었으며, 지금까지 적용 대상에서 제외되었던 중규모 행사장으로도 적용 범위가 확대되었습니다. 중국에서는 높이 100미터를 초과하는 고층 주택에 스프링클러 설치가 의무화되어, 이에 따라 1선 도시에서 개보수 공사가 활발해지고 있습니다. 일본에서는 주소 지정형 시스템의 점검 주기가 3년에서 5년으로 연장됨에 따라, 유지보수 방문 빈도를 줄일 수 있는 고신뢰성 부품에 대한 수요가 증가하고 있습니다. 아랍에미리트(UAE)에서는 성능 기준에 따른 설계가 채택되어 CFD 모델링이 허용되는 한편, 인증 비용 증가와 프로젝트 기간 장기화를 초래하고 있습니다. 위반 목록 공개로 인해 평판 리스크가 높아지면서, 법정 최저 기준을 초과하는 자발적인 규정 준수가 촉진되고 있습니다.
급속한 도시화와 고층 건축 붐
유엔의 예측에 따르면, 2030년까지 도시 거주율은 68%로 상승할 것이며, 화재 위험은 더 높은 건물에 집중될 것입니다. 아시아태평양은 신규 고층 건축 착공 건수의 절반 이상을 차지하고 있으며, 그 대부분을 인도와 인도네시아가 차지하고 있습니다. 이 지역의 메가시티 건축 면적은 2020년부터 2024년 사이 12% 확대된 반면, 소방서 밀도는 고작 3%만 증가하여 현장 진화 활동에 대한 의존도가 높아지고 있습니다. 두바이와 리야드의 복합용도 타워에는 각각 서로 다른 건축 기준을 준수해야 하는 구역이 포함되어 있어 통합이 복잡해지고 시스템 비용이 상승하고 있습니다. OECD의 분석에 따르면, 사하라 사막 이남 아프리카의 인프라 지연이 화재 예방 대책의 격차를 확대시키고 있으며, 보험사는 인수 심사 시 화재 예방 대책을 중점적으로 지적하고 있습니다. 교통역 등의 지하 시설은 더욱 복잡하여 고성능 배연 설비나 열 감지 어레이의 설치가 요구되고 있습니다.
높은 도입 및 유지 관리 비용
네트워크 연결 기능을 갖춘 주소 지정형 패널은 호주의 중규모 빌딩의 경우 1만 5,000-4만 5,000호주달러(9,800-2만 9,400달러)의 비용이 들어 시설 예산을 압박하고 있습니다. 무선식 감지기의 가격은 대당 180-320 달러이지만, 3선식 유선 장치와 비교할 때 보험을 통한 비용 부담이 없는 지역에서는 도입의 장벽이 되고 있습니다. 펌웨어 업데이트에는 인증된 기술자가 필요하기 때문에 연간 유지보수 계약 비용은 설치 비용의 8-12%에 달할 전망입니다. 오래된 건물에 사후 설치 공사를 할 경우, 대부분의 경우 새로운 배관이 필요하거나 장치 설치 밀도를 타협할 수밖에 없어 설비 투자(CAPEX)가 증가합니다. 저소득 지역의 법규 집행 미비로 인해 규정 준수 압력이 약화되어, 업그레이드 진행이 더욱 지연되고 있습니다. 농촌 지역에서는 시공업체가 부족하여 인건비가 30-50% 높아지며, 비용 대비 효과가 더욱 악화되고 있습니다.
부문별 분석
2025년 매출 중 능동형 시스템이 62.58%를 차지했으며, 2031년까지 연평균 7.69%의 성장률을 보일 전망입니다. 이는 소유주들이 손실 발생을 최대 80%까지 억제하는 자동적인 위험 완화 조치를 선호하는 경향을 반영한 것입니다. 수동형 대책은 구획화 측면에서 여전히 필수적이지만, 보험료 절감을 위해 보험사가 모니터링 기능이 탑재된 소화 시스템 도입을 요구함에 따라 그 점유율은 감소하고 있습니다. 고층 주택의 통합형 설비는 내화 샤프트와 가압 팬을 결합한 것으로, 이러한 복합적인 접근 방식을 구현하고 있습니다. 하이브리드형 도입의 경우, 내화벽에 구멍을 뚫지 않는 무선식 감지기를 사용하여 방화벽의 무결성을 유지함으로써, 노후 건물의 개보수율을 높이고 있습니다. 국제 건축 기준(IBC)에서는 현재 3층을 초과하는 아트리움에 소화 설비의 설치를 의무화하고 있으며, 이로 인해 화재 안전 시스템 시장의 확대가 촉진되고 있습니다.
능동형 플랫폼에는 위험 확산을 예측하는 분석 기능이 점점 더 많이 통합되고 있으며, 소프트웨어 성능에 따라 공급업체 간의 차별화가 진행되고 있습니다. 리튬 이온 배터리실용 배터리 구동식 스프레이는 화재 안전 시스템 시장의 전문적인 틈새 시장의 한 예입니다. 수동형 솔루션 제공업체들은 색상 변화를 통해 수명 종료 시점을 알리는 팽창성 도료 등, 보다 스마트한 소재로 대응하고 있습니다. 그러나 서비스 계약이 지속적인 현금 흐름을 가져오기 때문에 자금은 능동형 솔루션 포트폴리오에 집중되고 있으며, 이는 연금 수입을 목표로 하는 통합업체들에게 매력적인 요소로 작용하고 있습니다. 수동형만 포함하는 설계에서 벗어나면서, 예측 기간 동안 능동형 솔루션과 관련된 화재 안전 시스템 시장 규모는 확대될 전망입니다.
2025년에는 화재 감지가 47.78%를 차지하며 주요 수익원으로 자리매김했습니다. 이는 경보 발생원을 특정하고 최초 대응자의 조치를 신속하게 하는 주소 지정형 패널에 힘입은 결과입니다. 무선 감지기는 7.97%의 연평균 성장률(CAGR)을 기록하고 있으며, 메시 네트워크를 통해 유인 공간에서의 설치 작업량이 감소함에 따라 화재 안전 시스템 시장 전체를 상회하는 성장세를 보이고 있습니다. 가스 소화 시스템은 물 사용이 허용되지 않을 정도의 피해 위험을 초래하는 미술관이나 데이터센터와 같은 민감한 환경에서 주류를 이루고 있습니다. 발포 소화 시스템은 석유화학 시설에서 여전히 주도적인 위치를 유지하고 있으나, 환경 규제로 인해 요구되는 불소 무함유 전환이라는 과제에 직면해 있습니다.
감지 데이터와 소화 데이터가 통합 대시보드에 집계됨으로써 예측 유지보수가 촉진되어, 시범 운영 사무실에서는 오경보를 30% 줄이는 데 성공했습니다. 현재 7만 5,000제곱피트가 넘는 시설에서 의무화되어 있는 음성 대피 유도 경보기는 사고 발생 시 이용자의 대피를 개선합니다. 연기, 열, 일산화탄소(CO) 감지 기능을 통합한 감지기는 미립자가 많은 공장에서의 오감지를 줄이고 관리자의 신뢰도를 높입니다. 이러한 발전으로 인해 고성능 감지 기기에 기반한 화재 안전 시스템 시장 규모가 확대되고 있으며, 소프트웨어 고도화 측면에서 벤더 간의 차별화가 더욱 강화되고 있습니다.
지역별 분석
북미는 2025년 매출의 35.68%를 차지했으며, 이는 엄격한 NFPA(미국 화재방지협회) 개정안과 모니터링 기능이 탑재된 소화 시스템에 대해 보험료를 최대 20% 인하하는 보험 인센티브의 영향을 반영한 것입니다. 미국 해안 지역의 고층 건물과 캘리포니아주의 산불 대책 개보수 공사가 수주를 견인하고 있습니다. 캐나다의 성능 기준에 따른 건축 기준법에 따라 고밀도 주거 타워에 미스트 시스템 도입이 가속화되고 있습니다. 멕시코의 니어쇼어링은 새로운 산업 거점에서의 주소 지정형 제어반에 대한 수요를 뒷받침하고 있습니다.
아시아태평양은 도시화와 고층 빌딩 증가로 인해 2031년까지 연평균 성장률(CAGR) 8.55%로 가장 높은 성장세가 예상됩니다. 중국의 건축 기준에 따르면 높이 100미터를 초과하는 고층 빌딩에 스프링클러 설치가 의무화되어 있어, 베이징과 상하이에서 개보수 주기가 활발해지고 있습니다. 인도에서는 높이 15미터를 초과하는 주거용 건물에 주소 지정형 감지 장치 설치가 의무화되어 있지만, 시행 상황에는 편차가 있습니다. 일본에서는 신뢰성이 높은 부품에 대해 점검 주기 연장이라는 우대 조치가 취해지고 있으며, 이로 인해 시스템의 초기 투자가 증가하고 있습니다. 호주의 2025년 건축 기준에서는 상호 연동형 연기 감지기의 설치가 의무화되어 있어, 이에 따라 무선식 감지기의 보급이 촉진되고 있습니다. 한국에서는 11층을 초과하는 아파트에 스프링클러 설치가 의무화되어 있으며, 동결 방지 대책에 드는 비용에도 불구하고 습식 스프링클러의 도입이 진행되고 있습니다.
유럽에서는 기준이 제각각이기 때문에 현지 시스템 통합사업자에 이점이 주어지고 있습니다. 독일의 DGNB 인증에서는 고도의 방화 대책에 대해 평가 점수가 부여되므로, 자발적인 설비 갱신이 촉진되고 있습니다. 중동에서는 마스터 플랜에 성능 기반 설계를 반영한 메가 프로젝트에서의 수요가 활발하며, 아랍에미리트(UAE)의 규정에서는 CFD 모델링이 권장되고 있습니다. 아프리카의 도입 상황은 여전히 편차가 있어, 남아프리카공화국이나 케냐가 선도하고 있는 반면, 기타 중동 및 아프리카에서는 시공 업체 부족으로 인해 보급이 제한되고 있습니다.
기타 혜택
- 엑셀 형식 시장 예측(ME) 시트
- 3개월간의 애널리스트 지원
자주 묻는 질문
목차
제1장 서론
제2장 조사 방법
제3장 주요 요약
제4장 시장 구도
제5장 시장 규모 및 성장 예측
제6장 경쟁 구도
제7장 시장 기회 및 향후 전망
KTH 26.09.04According to Mordor Intelligence, fire safety systems market size in 2026 is estimated at USD 79.97 billion, growing from 2025 value of USD 75.01 billion with 2031 projections showing USD 110.19 billion, growing at 6.61% CAGR over 2026-2031.
This report is Segmented by Technology (Passive Fire Safety Systems, and Active Fire Safety Systems), Product (Fire Suppression With Gas, Foam, and More), End-User (Commercial, Industrial, and More), Connectivity (Wired Systems, and Wireless Systems), and Geography (North America, South America, and More). The Market Forecasts are Provided in Terms of Value (USD).
Global Fire Safety Systems Market Trends and Insights
Stringent Government Fire-Safety Mandates
The 2025 edition of NFPA 72 mandates cloud-connected monitoring for commercial panels, prompting legacy upgrades and penalizing noncompliant owners during occupancy renewals. The 2024 International Fire Code now requires automatic suppression in assembly occupancies above 300 persons, expanding coverage to mid-sized venues previously exempt. China requires sprinklers in residential towers over 100 meters, sparking retrofit activity in tier-one cities. Japan extended inspection cycles for addressable systems from three to five years, raising demand for higher-reliability components that offset maintenance visits. The UAE adopted performance-based design, permitting CFD modeling but adding certification costs and lengthening project timelines. Publicly posted violation lists intensify reputational risk, nudging voluntary compliance beyond statutory minimums.
Rapid Urbanization and High-Rise Construction Boom
The United Nations forecasts that urban residency will rise to 68% by 2030, concentrating fire risk in taller structures. Asia Pacific represents more than half of new high-rise starts, with India and Indonesia contributing the bulk of units. Built-up area in the region's megacities expanded 12% between 2020 and 2024, while fire-station density increased only 3%, elevating reliance on on-site suppression. Mixed-use towers in Dubai and Riyadh include zones that require distinct code compliance, complicating integration and raising system costs. OECD analysis notes that infrastructure lag in sub-Saharan Africa widens protection gaps, prompting insurers to flag fire safety in underwriting. Underground facilities such as transit stations introduce further complexity, demanding premium smoke-extraction and heat-detection arrays.
High Installation and Maintenance Costs
Addressable panels with network connectivity cost AUD 15,000-45,000 (USD 9,800-29,400) for mid-sized Australian buildings, stretching facility budgets. Wireless detectors list at USD 180-320 each triple wired units posing adoption hurdles where insurance offsets are absent. Annual service contracts run 8-12% of installed cost because certified technicians are needed for firmware updates. Retrofitting older buildings often requires new conduit or compromise on device density, inflating capex. Enforcement gaps in lower-income regions limit compliance pressure, further slowing upgrades. Rural areas face 30-50% higher labor rates owing to scarce contractors, worsening affordability.
Other drivers and restraints analyzed in the detailed report include:
- Growing Adoption of Wireless IoT-Enabled Detection Systems
- Expansion of Data Centers Requiring Specialized Suppression
- Supply-Chain Volatility in Electronic Components
For complete list of drivers and restraints, kindly check the Table Of Contents.
Segment Analysis
Active systems captured 62.58% of 2025 revenue and are set to expand at 7.69% through 2031, reflecting owners' preference for automatic mitigation that curbs loss events by up to 80%. Passive measures remain essential for compartmentation but surrender share as insurers insist on monitored suppression for premium relief. Integrated installations in high-rise residences pair fire-rated shafts with pressurization fans, exemplifying the combined approach. Hybrid deployments preserve barrier integrity by using wireless detectors that avoid drilling through rated walls, boosting retrofit rates in older stock. The International Building Code now obliges suppression in atriums taller than three stories, broadening the Fire Safety Systems market.
Active platforms increasingly embed analytics that predict hazard escalation, differentiating vendors on software prowess. Battery-powered sprays for lithium-ion battery rooms illustrate specialized niches within the Fire Safety Systems market. Passive providers respond with smarter materials, such as intumescent coatings that signal end-of-life status through color change. Yet funding gravitates toward active portfolios because service contracts yield recurring cash flows, an attraction for integrators pursuing annuity revenue. The migration from passive-only designs elevates the Fire Safety Systems market size tied to active solutions throughout the forecast.
Fire detection remained the chief revenue driver at 47.78% in 2025, anchored by addressable panels that pinpoint alarm origin and speed first-responder action. Wireless detectors, posting an 7.97% CAGR, outpace the broader Fire Safety Systems market as mesh networks trim installation labor in occupied spaces. Gas suppression dominates sensitive environments like museums and data halls where water presents unacceptable damage risk. Foam systems retain leadership in petrochemical sites yet grapple with fluorine-free transitions demanded by environmental rules.
The convergence of detection and suppression data within unified dashboards fosters predictive maintenance, a feature that cuts nuisance alarms by 30% in pilot offices. Voice-evacuation alarms, now demanded in properties exceeding 75,000 square feet, improve occupant guidance during incidents. Detectors integrating smoke, heat, and CO inputs reduce false positives in high-particulate plants, enhancing management confidence. These advances enlarge the Fire Safety Systems market size attached to premium detection gear and reinforce vendor differentiation on software sophistication.
Complete Report Scope:
- By Technology
- Passive Fire Safety Systems
- Active Fire Safety Systems
- By Product
- Fire Detector
- Detectors
- Alarms
- Fire Suppression
- Gas
- Foam
- Other Fire Suppression Products
- Fire Detector
- By End-User
- Commercial
- Industrial
- Government
- Other End-Users
- By Connectivity
- Wired Systems
- Wireless Systems
- By Geography
- North America
- United States
- Canada
- Mexico
- South America
- Brazil
- Argentina
- Rest of South America
- Europe
- United Kingdom
- Germany
- France
- Spain
- Italy
- Rest of Europe
- Asia Pacific
- China
- India
- Japan
- Australia
- South Korea
- Rest of Asia Pacific
- Middle East and Africa
- Middle East
- Saudi Arabia
- United Arab Emirates
- Turkey
- Rest of Middle East
- Africa
- South Africa
- Kenya
- Rest of Africa
- Middle East
- North America
Geography Analysis
North America accounted for 35.68% of 2025 revenue, reflecting the impact of rigorous NFPA updates and insurance incentives that reduced premiums by up to 20% for monitored suppression. High-rise construction along U.S. coasts, and wildfire retrofits in California, sustain orders. Canada's performance-based building code accelerates the adoption of water-mist systems in dense residential towers. Nearshoring in Mexico fuels demand for addressable panels in new industrial hubs.
Asia Pacific is set for the fastest 8.55% CAGR through 2031 on urbanization and high-rise proliferation. Chinese codes require sprinklers in towers above 100 meters, igniting retrofit cycles in Beijing and Shanghai. India mandates addressable detection in residential blocks over 15 meters, although enforcement varies. Japan rewards reliable components with extended inspection intervals, lifting upfront system spend. Australia's 2025 code demands interlinked smoke alarms, stimulating wireless detector uptake. South Korea enforces sprinklers in apartments taller than 11 stories, compelling wet-pipe adoption despite freeze-protection costs.
Europe shows fragmented standards that benefit local integrators. Germany's DGNB certification awards credits for advanced protection, nudging voluntary upgrades. The Middle East experiences brisk demand from mega-projects that embed performance-based design in master plans, with UAE regulations endorsing CFD modeling. Africa's adoption remains uneven, with South Africa and Kenya leading but limited penetration elsewhere due to contractor shortages.
- Johnson Controls International PLC
- Honeywell International Inc.
- Siemens AG
- Bosch Sicherheitssysteme GmbH
- Gentex Corporation
- Halma PLC
- Hochiki America Corporation
- Viking Group Inc.
- Victaulic Company
- Fike Corporation
- Securiton AG
- Carrier Global Corporation
- Nittan Company Limited
- Apollo Fire Detectors Limited
- Advanced Electronics Limited
- Minimax GmbH
- Robertshaw Controls Company
- Ravel Electronics Private Limited
- Panasonic Corporation
- Edwards Fire Safety (Carrier)
- Tyco Fire Protection Products
Additional Benefits:
- The market estimate (ME) sheet in Excel format
- 3 months of analyst support
TABLE OF CONTENTS
1 INTRODUCTION
- 1.1 Study Assumptions and Market Definition
- 1.2 Scope of the Study
2 RESEARCH METHODOLOGY
3 EXECUTIVE SUMMARY
4 MARKET LANDSCAPE
- 4.1 Market Overview
- 4.2 Industry Value Chain Analysis
- 4.3 Regulatory Landscape
- 4.4 Technological Outlook
- 4.5 Impact of Macroeconomic Factors on the Market
- 4.6 Porter's Five Forces Analysis
- 4.6.1 Bargaining Power of Suppliers
- 4.6.2 Bargaining Power of Consumers
- 4.6.3 Threat of New Entrants
- 4.6.4 Threat of Substitutes
- 4.6.5 Intensity of Competitive Rivalry
- 4.7 Market Drivers
- 4.7.1 Stringent Government Fire-Safety Mandates
- 4.7.2 Rapid Urbanization and High-Rise Construction Boom
- 4.7.3 Surge in Insurance Premium Discounts for Compliant Buildings
- 4.7.4 Growing Adoption of Wireless IoT-Enabled Detection Systems
- 4.7.5 Expansion of Data Centers Requiring Specialized Suppression
- 4.7.6 Emergence of ESG-Linked Facility Management Budgets
- 4.8 Market Restraints
- 4.8.1 High Installation and Maintenance Costs
- 4.8.2 Supply-Chain Volatility in Electronic Components
- 4.8.3 Limited Skilled Workforce for System Integration
- 4.8.4 Slow Retrofit Cycles in Price-Sensitive Emerging Markets
5 MARKET SIZE AND GROWTH FORECASTS (VALUE)
- 5.1 By Technology
- 5.1.1 Passive Fire Safety Systems
- 5.1.2 Active Fire Safety Systems
- 5.2 By Product
- 5.2.1 Fire Detector
- 5.2.1.1 Detectors
- 5.2.1.2 Alarms
- 5.2.2 Fire Suppression
- 5.2.2.1 Gas
- 5.2.2.2 Foam
- 5.2.2.3 Other Fire Suppression Products
- 5.2.1 Fire Detector
- 5.3 By End-User
- 5.3.1 Commercial
- 5.3.2 Industrial
- 5.3.3 Government
- 5.3.4 Other End-Users
- 5.4 By Connectivity
- 5.4.1 Wired Systems
- 5.4.2 Wireless Systems
- 5.5 By Geography
- 5.5.1 North America
- 5.5.1.1 United States
- 5.5.1.2 Canada
- 5.5.1.3 Mexico
- 5.5.2 South America
- 5.5.2.1 Brazil
- 5.5.2.2 Argentina
- 5.5.2.3 Rest of South America
- 5.5.3 Europe
- 5.5.3.1 United Kingdom
- 5.5.3.2 Germany
- 5.5.3.3 France
- 5.5.3.4 Spain
- 5.5.3.5 Italy
- 5.5.3.6 Rest of Europe
- 5.5.4 Asia Pacific
- 5.5.4.1 China
- 5.5.4.2 India
- 5.5.4.3 Japan
- 5.5.4.4 Australia
- 5.5.4.5 South Korea
- 5.5.4.6 Rest of Asia Pacific
- 5.5.5 Middle East and Africa
- 5.5.5.1 Middle East
- 5.5.5.1.1 Saudi Arabia
- 5.5.5.1.2 United Arab Emirates
- 5.5.5.1.3 Turkey
- 5.5.5.1.4 Rest of Middle East
- 5.5.5.2 Africa
- 5.5.5.2.1 South Africa
- 5.5.5.2.2 Kenya
- 5.5.5.2.3 Rest of Africa
- 5.5.5.1 Middle East
- 5.5.1 North America
6 COMPETITIVE LANDSCAPE
- 6.1 Market Concentration
- 6.2 Strategic Moves
- 6.3 Market Share Analysis
- 6.4 Company Profiles (includes Global level Overview, Market level overview, Core Segments, Financials as available, Strategic Information, Market Rank/Share for key companies, Products and Services, and Recent Developments)
- 6.4.1 Johnson Controls International PLC
- 6.4.2 Honeywell International Inc.
- 6.4.3 Siemens AG
- 6.4.4 Bosch Sicherheitssysteme GmbH
- 6.4.5 Gentex Corporation
- 6.4.6 Halma PLC
- 6.4.7 Hochiki America Corporation
- 6.4.8 Viking Group Inc.
- 6.4.9 Victaulic Company
- 6.4.10 Fike Corporation
- 6.4.11 Securiton AG
- 6.4.12 Carrier Global Corporation
- 6.4.13 Nittan Company Limited
- 6.4.14 Apollo Fire Detectors Limited
- 6.4.15 Advanced Electronics Limited
- 6.4.16 Minimax GmbH
- 6.4.17 Robertshaw Controls Company
- 6.4.18 Ravel Electronics Private Limited
- 6.4.19 Panasonic Corporation
- 6.4.20 Edwards Fire Safety (Carrier)
- 6.4.21 Tyco Fire Protection Products
7 MARKET OPPORTUNITIES AND FUTURE OUTLOOK
- 7.1 White-space and Unmet-Need Assessment


