
|
시장보고서
상품코드
2120490
X선 장비 제조 : 시장 점유율 분석, 업계 동향 및 통계, 성장 예측(2026-2031년)X-ray Machine Manufacturing - Market Share Analysis, Industry Trends & Statistics, Growth Forecasts (2026 - 2031) |
||||||
 Mordor Intelligence
Mordor Intelligence에 의하면, X선 장비 제조 시장 규모는 2025년에 187억 1,000만 달러로 평가되었습니다. 2026년 197억 2,000만 달러에서 2031년까지 256억 7,000만 달러에 이를 것으로 예상되며, 예측 기간(2026-2031년) CAGR은 5.41%를 나타낼 전망입니다.
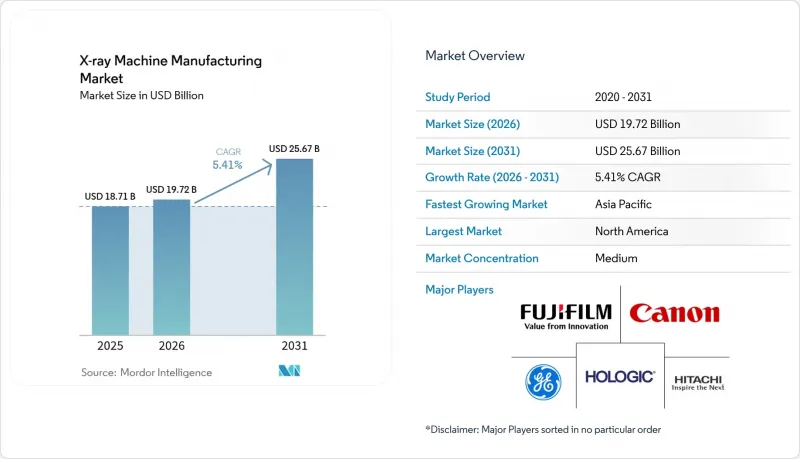
본 보고서는 제품 유형(고정형, 휴대형), 기술(아날로그, 디지털), 최종 사용자(의료시설, 운송 및 물류, 기타), 용도(의료용 영상 진단, 비파괴 검사·검사, 보안 검색, 치과용 영상 진단) 및 지역별로 분류되어 있습니다. 시장 예측은 금액(달러) 기준으로 제시되어 있습니다.
세계의 X선 장비 제조 시장 동향 및 인사이트
디지털 X선 시스템 도입 확대
현재 병원 및 외래 진료 센터에서는 디지털 X선 촬영을 영상의 선명도 측면보다는 임상 AI 플랫폼과의 상호 운용성 측면에서 중시하고 있습니다. GE 헬스케어와 NVIDIA는 2025년 3월, 검출기 수준의 데이터를 활용하여 알고리즘을 직접 학습시키고 촬영 중 이상을 감지하는 프로그램을 시작했습니다. 이를 통해 방사선과 의사의 판독 대기 시간이 단축되고 진단의 일관성이 향상됩니다. 또한 통합된 분석 기능을 통해 방사선 피폭량 추적도 자동화되어 있으며, 이 기능은 유럽과 북미에서 새롭게 도입되고 있는 규정 준수 요건을 충족합니다. 소프트웨어는 원격으로 업그레이드할 수 있으므로, 의료 기관은 장비의 수명을 연장하면서 새로운 임상 기능을 추가할 수 있으며, 고정 자산을 지속적으로 진화하는 의사 결정 지원 거점으로 탈바꿈시킬 수 있습니다. 이러한 네트워크 효과로 인해 아날로그 시스템이 아직 수명을 다하지 않은 시장에서도 디지털화로의 전환이 가속화되고 있습니다.
진단용 영상 검사가 필요한 만성 질환의 유병률 증가
고령화 사회에서 당뇨병, 심부전 및 암 사례의 발생률이 증가함에 따라 일상적인 방사선 촬영 건수가 늘어나고 있으며, 영상 진단의 수익 구조는 일회성 수익에서 구독형 수익으로 전환되고 있습니다. 예방 의료 분야에서는 미리 정해진 간격으로 흉부, 사지 및 혈관에 대한 추적 검사가 요구되고 있으며, 보험사는 증상이 나타나기 전에 병변을 감지하는 저선량 모달리티에 대한 보험 적용을 점점 더 확대되고 있습니다. 휴대용 발생기와 평판 검출기를 결합함으로써 진료소는 진단을 1차 의료 현장에 더 가깝게 가져올 수 있으며, 환자의 이동 부담을 줄이고, 진료 당일에 치료 계획을 수립할 수 있도록 지원합니다. 조기 발견을 통해 입원률이 감소하고, 의료 시스템의 자원이 확보됩니다. 이러한 성과 덕분에 캐나다, 일본 및 EU의 일부 회원국에서 공적 보험자가 포인트 오브 케어 기기에 지속적으로 투자하는 것이 정당화되고 있습니다.
X선 장비의 높은 초기 비용
구매 가격, 설치 장소 개조, 차폐, 직원 교육, 그리고 수년에 걸친 서비스 계약 등 수명 주기 동안의 총 비용은 구매자가 당초 예산에 계상했던 정가의 2배에 달할 가능성이 있습니다. 따라서 라틴아메리카나 아프리카의 소규모 진료소에서는 검사 건수에 따라 지불액이 변동하는 리스 계약이나 수익 분배 계약을 협상하기도 합니다. 이에 반해, 공급업체 측은 검출기 어레이나 소프트웨어를 나중에 추가할 수 있는 모듈식 콘솔을 제공함으로써, 향후 확장성을 저해하지 않으면서 도입 초기 지출을 줄이고 있습니다. 클라우드 기반 분석 기능 덕분에 현장의 IT 관련 비용은 더욱 절감되지만, 구독 요금에 대한 의존으로 인해 ROI(투자 회수 기간)가 장기화되기 때문에 자원이 제한된 환경에서는 도입이 주저되고 있습니다.
부문 분석
2025년에도 고정식 촬영실은 X선 장비 제조 시장의 60.40%를 차지했으며, 이는 3차 병원에 대한 확고한 투자를 반영합니다. 그러나 의료 네트워크가 분산형 모델로 전환됨에 따라 휴대용 장비는 연평균 성장률(CAGR) 5.62%를 나타낼 것으로 예측됩니다. 응급실 부문에서는 전자 차트와 원활하게 연동되는 배터리 구동식 카트를 도입한 결과, 내원부터 진단까지 걸리는 시간이 30분 단축되었다고 보고되었습니다. 이 부문의 성장에 힘입어 2031년까지 X선 장비 제조 시장 내 점유율이 확대되어, 기존 고정형 장비와의 격차가 좁혀질 전망입니다.
고사양 휴대용 장치와 중급 고정식 시스템 간의 성능 격차는 계속해서 줄어들고 있습니다. 지멘스 헬스인어즈의 ‘Luminos Q.namix’는 이동 가능한 디지털 감산 혈관조영 기능을 제공하여, 카테터실 이외의 장소에서도 혈관 중재술을 지원합니다. 이동식 영상 진단 장비 함대를 운영하는 서비스 제공업체는 원격 유지보수 대시보드를 활용하여 튜브 교체 시기를 예측하고, 자산의 수명을 연장하고 있습니다. 인도 농촌 지역에서는 민관 파트너십을 통해 매일 여러 마을을 순회하는 트럭 탑재형 X선 촬영 차량에 자금이 지원되고 있으며, 이는 농촌 지역의 검진률을 향상시키는 동시에 지역 병원으로의 환자 의뢰 흐름을 촉진하고 있습니다.
디지털 모달리티는 이미 77.20%의 점유율을 차지하고 있지만, 하드웨어 교체가 필요 없이 임상적 가치를 높이는 반복적인 소프트웨어 개선을 통해 그 점유율은 더욱 상승할 것으로 예측됩니다. 기흉 및 COVID-19 병변을 선별하는 AI 모듈은 영상 아카이브 시스템에 직접 통합되어 있으며, 종량제 라이선싱을 통해 의료 기관은 운영 비용을 쉽게 관리할 수 있게 되었습니다. 한편, 예산이 제한된 지역 진료소에서는 여전히 아날로그 시스템이 사용되고 있지만, 예비 부품의 입수 가능성이 낮아짐에 따라 그 폐기가 가속화되고 있습니다.
각 제조업체는 검출기의 메타데이터를 방사선 피폭량 대시보드로 변환하는 분석 기능을 번들로 제공하여, 캘리포니아주 및 EU의 더욱 엄격한 피폭량 보고 요건을 충족하고 있습니다. 클라우드 통합을 통해 여러 거점의 이미지를 통합할 수 있게 되어, 필름이나 컴퓨터 방사선 촬영(CR)으로는 어려웠던 전문 분야를 아우르는 원격 진료가 촉진되고 있습니다. 데이터 세트가 기하급수적으로 증가함에 따라, 각 벤더는 사이버 보안 및 DICOM 압축 알고리즘을 통해 차별화를 꾀하고 있으며, 병원들은 조달 주기에서 플랫폼의 지속성을 중시할 수밖에 없게 되었습니다.
지역별 분석
북미는 2025년, 1인당 의료비 수준이 높고 통합 의료 네트워크를 통한 AI 도입의 조기 의무화가 뒷받침되어 전 세계 매출의 51.40%를 차지했습니다. NYC Health and Hospitals는 230개의 방사선 촬영실을 업데이트하기 위해 2억 2,400만 달러를 투자하여, 해당 지역의 대규모 정기 업그레이드 시장의 중요성을 부각시켰습니다. 미국의 클라우드 원격 방사선 진단 허브는 원격 판독에 대응하는 검출기 형식에 대한 수요를 가속화하여 벤더 종속성과 계약 연장을 촉진하고 있습니다.
아시아태평양은 국내 조립형 검출기의 수입 관세를 인하하는 중국의 현지화 인센티브에 힘입어 6.03%라는 가장 높은 연평균 성장률(CAGR)을 기록하고 있습니다. 인도의 ‘국가 보건 미션(National Health Mission)’은 2선 도시에서 이동 진료 차량 도입을 지원하고 있으며, 이를 통해 접근성이 확대되고 장기적인 장비 및 서비스 관련 기반이 구축되고 있습니다. 일본은 고령자의 영상 진단 수요 증가에 직면해 있으며, 지역 병원들이 새로운 DR 콘솔에 통합된 방사선 피폭량 감사 소프트웨어에 대한 투자를 촉진하고 있습니다.
유럽에서는 EU의 ‘회복·탄력성 기금(Recovery and Resilience Facility)’이 이탈리아의 진단 장비 현대화에 26억 유로를 투입함에 따라 장비 갱신이 착실히 진행되고 있습니다. 이 지역의 엄격한 선량 규제로 인해 자동 노출 제어 도입률이 높아지고 있으며, 이는 고급 검출기 공급업체에게 호재가 되고 있습니다. 중동 및 아프리카에서는 영상 진단과 종양 센터를 통합한 병원 클러스터 프로그램이 시작되면서, 중가대 OEM 제조업체들에게 새로운 시장이 창출되고 있습니다. 걸프 지역 국가들의 의료 관광에 대한 의지도 유럽 및 미국의 인증 기준을 준수하는 AI 지원 플랫폼을 뒷받침하고 있습니다.
기타 혜택 :
- 엑셀 형식 시장 예측(ME) 시트
- 3개월간 애널리스트 지원
자주 묻는 질문
목차
제1장 서론
제2장 조사 방법
제3장 주요 요약
제4장 시장 구도
제5장 시장 규모 및 성장 예측
제6장 경쟁 구도
제7장 시장 기회 및 향후 전망
KTHAccording to Mordor Intelligence, the x-Ray machine manufacturing market size was valued at USD 18.71 billion in 2025 and estimated to grow from USD 19.72 billion in 2026 to reach USD 25.67 billion by 2031, at a CAGR of 5.41% during the forecast period (2026-2031).
This report is Segmented by Product Type (Stationary, and Portable), Technology (Analog, and Digital), End-User (Healthcare Facilities, Transportation and Logistics, and More), Application (Medical Imaging, Non-Destructive Testing and Inspection, Security Screening, Dental Imaging), and Geography. The Market Forecasts are Provided in Terms of Value (USD).
Global X-ray Machine Manufacturing Market Trends and Insights
Rise in Adoption of Digital X-ray Systems
Hospitals and ambulatory centers now value digital radiography less for image clarity and more for its interoperability with clinical AI platforms. GE HealthCare and NVIDIA launched a program in March 2025 that trains algorithms directly on detector-level data to flag abnormalities during acquisition, trimming radiologist reading queues, and elevating diagnostic consistency. Integrated analytics also automate radiation-dose tracking, a feature that meets emerging compliance mandates in Europe and North America. Because software can be upgraded remotely, facilities extend equipment life while layering new clinical functions, turning capital assets into evolving decision-support hubs. Those network effects accelerate digital replacement even in markets where analog systems have not yet reached end-of-life.
Growing Prevalence of Chronic Diseases Requiring Diagnostic Imaging
Incidence of diabetes, heart failure, and oncology cases in aging populations lifts routine radiography volumes, shifting imaging economics from episodic to subscription-like revenue. Preventive-care pathways require chest, extremity, and vascular follow-ups at predefined intervals, and payors increasingly reimburse for low-dose modalities that detect pathologies before symptom onset. Portable generators paired with flat-panel detectors let clinics move diagnostics closer to primary-care sites, cutting patient travel and supporting same-visit treatment planning. Early findings lower hospitalization rates, freeing system resources-outcomes that justify ongoing investment in point-of-care devices by public insurers across Canada, Japan, and several EU states.
High Capital Cost of X-ray Machines
Comprehensive lifetime expenses-purchase price, site retrofits, shielding, staff training, and multiyear service contracts-can double the sticker cost that buyers initially budget. Smaller clinics in Latin America and Africa therefore negotiate leasing or revenue-share arrangements where payments align with scan volumes. Vendors answer with modular consoles whose detector arrays and software can be added over time, lowering day-one outlays without sacrificing future scalability. Cloud-based analytics further reduce on-site IT spend, yet reliance on subscription fees lengthens ROI horizons, tempering uptake in resource-constrained settings.
Other drivers and restraints analyzed in the detailed report include:
- Government Funding to Upgrade Radiology Infrastructure
- Rising Demand for Point-of-Care and Portable Imaging
- Radiation-Dose Safety Regulations
For complete list of drivers and restraints, kindly check the Table Of Contents.
Segment Analysis
Stationary rooms still commanded 60.40% of the X-Ray Machine Manufacturing market in 2025, reflecting entrenched investments in tertiary hospitals. Yet portable units are forecast to post a 5.62% CAGR as health networks pivot to decentralized models. Emergency departments cite 30-minute reductions in door-to-diagnosis times after deploying battery-powered carts that interface seamlessly with electronic health records. The segment's uplift raises its portion of the X-Ray Machine Manufacturing market size by 2031, narrowing the gap with traditional installations.
Performance parity between high-end portables and mid-tier fixed systems continues to improve. Siemens Healthineers' Luminos Q.namix delivers digital subtraction angiography on wheels, supporting vascular interventions outside cath labs. Service providers running mobile imaging fleets leverage telemaintenance dashboards to predict tube replacements, extending asset life. In rural India, public-private partnerships finance truck-mounted radiography vans that cover multiple villages daily, boosting rural screening rates and feeding referral pipelines for district hospitals.
Digital modalities already hold 77.20% share yet are still anticipated to climb thanks to iterative software enhancements that add clinical value without hardware swaps. AI modules that triage pneumothorax or COVID-19 pathology splice directly into picture-archiving systems, and pay-per-use licensing helps facilities control operating costs. Conversely, analog systems linger in budget-restricted community clinics, but shrinking spare-part availability accelerates their retirement trajectory.
Manufacturers bundle analytics that convert detector metadata into radiation-dose dashboards, satisfying stricter exposure reporting mandates in California and the EU. Cloud integration enables multi-site image pooling, facilitating subspecialty teleconsults that were difficult with film or computed radiography. Because datasets grow exponentially, vendors differentiate on cybersecurity and DICOM-compression algorithms, compelling hospitals to favor platform continuity during procurement cycles.
Complete Report Scope:
- By Product Type
- Stationary
- Portable
- By Technology
- Analog
- Digital
- By End-user Industry
- Hospitals
- Diagnostic Imaging Centers
- Dental Clinics
- Orthopedic and Trauma Care Facilities
- Aircraft Maintenance Facilities
- Military Field Hospitals
- Security Screening Units
- Industrial and Manufacturing
- Government and Security
- Veterinary and Animal Care
- Other End-user Industries
- By Application
- Medical Imaging
- Non-destructive Testing and Inspection
- Security Screening
- Dental Imaging
- Geography
- North America
- United States
- Canada
- Europe
- Germany
- United Kingdom
- France
- Russia
- Rest of Europe
- Asia Pacific
- China
- Japan
- India
- South Korea
- Rest of Asia Pacific
- South America
- Brazil
- Argentina
- Rest of South America
- Middle East and Africa
- Gulf Cooperation Council (GCC)
- South Africa
- Rest of Middle East and Africa
- North America
Geography Analysis
North America retained 51.40% of global revenue in 2025, buoyed by high per-capita healthcare spend and early AI adoption mandates from integrated delivery networks. NYC Health and Hospitals committed USD 224 million to replace 230 radiography suites, underscoring the region's sizable recurring-upgrade market. Cloud teleradiology hubs in the United States accelerate demand for detector formats compatible with remote reads, reinforcing vendor lock-in and extension contracts.
Asia-Pacific records the fastest 6.03% CAGR, propelled by China's localization incentives that reduce import tariffs for domestically assembled detectors. India's National Health Mission subsidizes mobile vans in tier-2 cities, widening access and seeding long-term equipment-service relationships. Japan confronts rising geriatric imaging loads, spurring community hospitals to invest in radiation-dose audit software embedded within new DR consoles.
Europe shows steady equipment turnover as the EU Recovery and Resilience Facility channels EUR 2.6 billion into Italy's diagnostic modernizations. Dose-regulation rigor here inspires high adoption of automatic exposure control, benefiting premium detector suppliers. The Middle East and Africa begin hospital-cluster programs that bundle imaging with oncology centers, offering fresh territory to mid-price OEMs. Gulf states' medical-tourism aspirations likewise favor AI-ready platforms that align with Western accreditation standards.
- Canon Inc.
- Fujifilm Holdings Corporation
- GE HealthCare Technologies Inc.
- Hitachi Ltd. (Hitachi Healthcare)
- Hologic, Inc.
- Koninklijke Philips N.V.
- Shimadzu Corporation
- Siemens Healthineers AG
- Vision Medicaid Equipments Pvt. Ltd.
- Hindrays (Hind High Vacuum Company Pvt. Ltd.)
- Carestream Health, Inc.
- Agfa-Gevaert N.V.
- Varex Imaging Corporation
- Konica Minolta, Inc.
- Samsung Electronics Co., Ltd. (Samsung Medison)
- Shenzhen Mindray Bio-Medical Electronics Co., Ltd.
- DENTSPLY SIRONA Inc.
- Comet Group AG (Yxlon International GmbH)
- Rigaku Corporation
- Teledyne Technologies Incorporated (Teledyne DALSA)
- Spellman High Voltage Electronics Corporation
- Varian Medical Systems, Inc.
Additional Benefits:
- The market estimate (ME) sheet in Excel format
- 3 months of analyst support
TABLE OF CONTENTS
1 INTRODUCTION
- 1.1 Study Assumptions and Market Definition
- 1.2 Scope of the Study
2 RESEARCH METHODOLOGY
3 EXECUTIVE SUMMARY
4 MARKET LANDSCAPE
- 4.1 Market Overview
- 4.2 Market Drivers
- 4.2.1 Rise in adoption of digital X-ray systems
- 4.2.2 Growing prevalence of chronic diseases requiring diagnostic imaging
- 4.2.3 Government funding to upgrade radiology infrastructure
- 4.2.4 Rising demand for point-of-care and portable imaging
- 4.2.5 Integration of AI-enabled image optimisation and triage (under-the-radar)
- 4.2.6 Expansion of micro-focus X-ray in electronics QC (under-the-radar)
- 4.3 Market Restraints
- 4.3.1 High capital cost of X-ray machines
- 4.3.2 Radiation-dose safety regulations
- 4.3.3 Shortage of skilled radiologic technologists
- 4.3.4 Supply-chain bottlenecks in scintillator and FPD materials (under-the-radar)
- 4.4 Value / Supply-Chain Analysis
- 4.5 Regulatory Landscape
- 4.6 Technological Outlook
- 4.7 Porter's Five Forces Analysis
- 4.7.1 Threat of New Entrants
- 4.7.2 Bargaining Power of Buyers
- 4.7.3 Bargaining Power of Suppliers
- 4.7.4 Threat of Substitutes
- 4.7.5 Intensity of Competitive Rivalry
5 MARKET SIZE AND GROWTH FORECASTS (VALUE)
- 5.1 By Product Type
- 5.1.1 Stationary
- 5.1.2 Portable
- 5.2 By Technology
- 5.2.1 Analog
- 5.2.2 Digital
- 5.3 By End-user Industry
- 5.3.1 Hospitals
- 5.3.2 Diagnostic Imaging Centers
- 5.3.3 Dental Clinics
- 5.3.4 Orthopedic and Trauma Care Facilities
- 5.3.5 Aircraft Maintenance Facilities
- 5.3.6 Military Field Hospitals
- 5.3.7 Security Screening Units
- 5.3.8 Industrial and Manufacturing
- 5.3.9 Government and Security
- 5.3.10 Veterinary and Animal Care
- 5.3.11 Other End-user Industries
- 5.4 By Application
- 5.4.1 Medical Imaging
- 5.4.2 Non-destructive Testing and Inspection
- 5.4.3 Security Screening
- 5.4.4 Dental Imaging
- 5.5 Geography
- 5.5.1 North America
- 5.5.1.1 United States
- 5.5.1.2 Canada
- 5.5.2 Europe
- 5.5.2.1 Germany
- 5.5.2.2 United Kingdom
- 5.5.2.3 France
- 5.5.2.4 Russia
- 5.5.2.5 Rest of Europe
- 5.5.3 Asia Pacific
- 5.5.3.1 China
- 5.5.3.2 Japan
- 5.5.3.3 India
- 5.5.3.4 South Korea
- 5.5.3.5 Rest of Asia Pacific
- 5.5.4 South America
- 5.5.4.1 Brazil
- 5.5.4.2 Argentina
- 5.5.4.3 Rest of South America
- 5.5.5 Middle East and Africa
- 5.5.5.1 Gulf Cooperation Council (GCC)
- 5.5.5.2 South Africa
- 5.5.5.3 Rest of Middle East and Africa
- 5.5.1 North America
6 COMPETITIVE LANDSCAPE
- 6.1 Market Concentration
- 6.2 Strategic Moves
- 6.3 Market Share Analysis
- 6.4 Company Profiles (includes Global level Overview, Market level overview, Core Segments, Financials as available, Strategic Information, Market Rank/Share for key companies, Products and Services, and Recent Developments)
- 6.4.1 Canon Inc.
- 6.4.2 Fujifilm Holdings Corporation
- 6.4.3 GE HealthCare Technologies Inc.
- 6.4.4 Hitachi Ltd. (Hitachi Healthcare)
- 6.4.5 Hologic, Inc.
- 6.4.6 Koninklijke Philips N.V.
- 6.4.7 Shimadzu Corporation
- 6.4.8 Siemens Healthineers AG
- 6.4.9 Vision Medicaid Equipments Pvt. Ltd.
- 6.4.10 Hindrays (Hind High Vacuum Company Pvt. Ltd.)
- 6.4.11 Carestream Health, Inc.
- 6.4.12 Agfa-Gevaert N.V.
- 6.4.13 Varex Imaging Corporation
- 6.4.14 Konica Minolta, Inc.
- 6.4.15 Samsung Electronics Co., Ltd. (Samsung Medison)
- 6.4.16 Shenzhen Mindray Bio-Medical Electronics Co., Ltd.
- 6.4.17 DENTSPLY SIRONA Inc.
- 6.4.18 Comet Group AG (Yxlon International GmbH)
- 6.4.19 Rigaku Corporation
- 6.4.20 Teledyne Technologies Incorporated (Teledyne DALSA)
- 6.4.21 Spellman High Voltage Electronics Corporation
- 6.4.22 Varian Medical Systems, Inc.
7 MARKET OPPORTUNITIES AND FUTURE OUTLOOK
- 7.1 White-space and Unmet-need Assessment