

|
시장보고서
상품코드
2120523
재활용 소재 포장 솔루션 : 시장 점유율 분석, 업계 동향 및 통계, 성장 예측(2026-2031년)Recycled Materials Packaging Solutions - Market Share Analysis, Industry Trends & Statistics, Growth Forecasts (2026 - 2031) |
||||||
 Mordor Intelligence
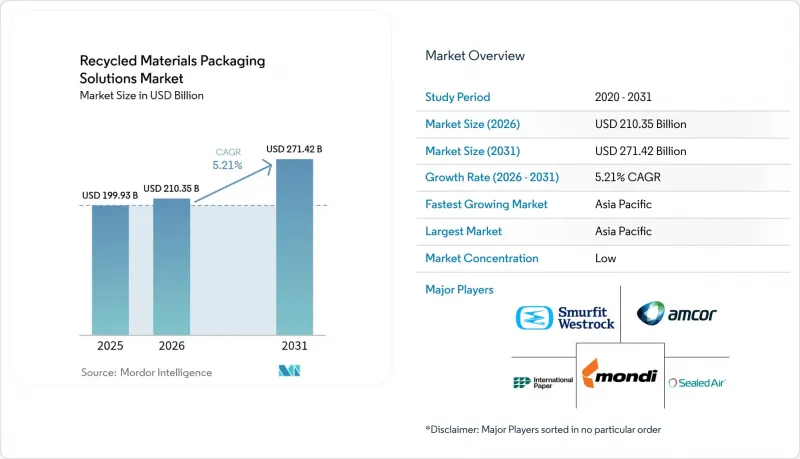
Mordor Intelligence에 의하면, 2026년 재활용 소재 포장 솔루션 시장 규모는 2,103억 5,000만 달러로 추정되고 2025년 1,999억 3,000만 달러에서 확대해, 2031년에는 2,714억 2,000만 달러에 이를 것으로 예측됩니다.
2026년부터 2031년까지 연평균 성장률(CAGR) 5.21%로 성장할 것으로 전망됩니다.

본 보고서는 소재 유형(플라스틱, 종이, 유리, 금속), 최종 사용자 산업(식품, 음료, 가정용품·퍼스널케어, 헬스케어 등), 포장 유형(경질 포장, 연질 포장), 재생 재료 조달원(소비 후 재생재, 산업용 재생재 등) 및 지역별로 분류되어 있습니다. 시장 전망은 금액(달러) 기준으로 제시되어 있습니다.
세계의 재활용 소재 포장 솔루션 시장 동향 및 인사이트
확대되는 생산자 책임 확대(EPR) 의무화
EPR 관련 법규에 따라, 사용 후 제품의 처리 비용이 지자체에서 생산자로 이전됨에 따라 재활용 소재의 사용이 경제적으로 매력적으로 변하고 있습니다. 베트남의 2024년 규정에서는 경질 PET 병에 대해 재활용률 22% 및 원료 회수율 40%를 의무화했으며, 이에 따라 설비의 급속한 현대화가 진행되고 있습니다. 한국에서는 PET 병에 대한 재활용 플라스틱 사용 의무 기준을 3%에서 10%로 상향 조정했으며, 2030년까지 30%를 목표로 하고 있습니다. 태국의 라벨리스 PET 이니셔티브는 오염을 줄이는 동시에 재생 수지에 대한 세액 공제를 검토하고 있습니다. EU의 ‘포장 및 포장 폐기물에 관한 규정’에서는 2030년까지 식품 포장에 재생 PET 사용률을 30%로할 것을 의무화하고 있습니다. 인도에서는 현재 식품 포장에 특정 재활용 플라스틱의 사용이 허용되고 있으며, 추적 가능성 표시가 의무화되어 있습니다.
브랜드 소유자의 2025년 재활용 소재 함유율 목표
세계 브랜드 기업들은 규제를 뛰어넘는 자발적인 노력을 추진하고 있습니다. 에스티 로더는 2030년까지 PCR(소비 후 재활용 플라스틱)을 최소 25% 사용하고, 버진 플라스틱 사용량을 절반으로 줄이는 것을 목표로 하고 있습니다. 마스(Mars)는 주요 과자 용기를 100% 재생 수지로 전환하여 연간 1,300톤의 버진 플라스틱 사용을 줄였습니다. 몬델리즈(Mondeliz)는 3억 개의 캐드버리 셰어링 바를 80%의 귀속 재활용 플라스틱으로 포장할 예정입니다. 캐드버리 호주는 데일리 밀크바를 위해 1,000톤의 화학적 재생 폴리프로필렌을 조달했습니다.
고품질 재생 원료 공급의 불안정성
재활용 PET 및 고밀도 폴리에틸렌의 가격은 크게 변동하고 있어, 가공업체들에게 예산 편성상의 과제가 되고 있습니다. 음료 브랜드의 경우 최근 식품 등급 rPET의 납기 기간이 6-8주 소요되는 반면, 버진 소재의 대체품은 3주 만에 입수할 수 있었습니다. 오염 문제로 인해 회수된 플라스틱의 15-25%가 식품 등급 테스트를 통과하지 못해, 일부 브랜드는 재생 소재 사용률 목표를 달성하지 못하는 상황에 몰리고 있습니다. 이러한 가격 변동은 특수 등급이 요구되는 배리어 소재 분야에서 가장 심각합니다.
부문 분석
2025년, 종이는 재활용 소재를 사용한 포장 솔루션 시장 점유율의 44.25%를 차지했습니다. 이는 북미의 성숙한 섬유 회수 시스템과 90% 이상의 골판지 회수율을 반영한 것입니다. 플라스틱의 경우, 화학적 재활용을 통해 식품 등급의 품질이 향상되고 새로운 용도가 개척됨에 따라 2031년까지 연평균 성장률(CAGR) 6.03%를 나타낼 것으로 예측됩니다. 유리는 브랜드 가치 측면에서 제품을 집었을 때 느껴지는 중후함이 중요시되는 고급 음료 및 화장품 틈새 시장에서 계속해서 사용되고 있습니다. 금속은 무한한 재활용 가능성을 자랑하며, 폐쇄형 재활용 시스템을 도입하는 기업들을 끌어들이고 있습니다. 취급량은 여전히 적지만, 에어로졸, 음료, 화장품 포장 분야에서 그 입지를 공고히 하고 있습니다.
종이는 전 세계 전자상거래의 확장에 힘입어 꾸준한 성장을 유지하고 있지만, 플라스틱에는 향후 성장 여지가 예상됩니다. 80억 달러가 넘는 투자를 통해 화학적 재활용이 가속화되어, 식품 등급 rPET공급 부족을 보완할 것으로 기대됩니다. 이스트만(Eastman)사의 ‘제미니 컴팩트(Gemini Compact)’와 같은 사례는 분자 수준에서 재활용된 수지를 활용한 화장품 분야로의 플라스틱 진출을 뒷받침하고 있습니다. 그 결과, 재활용 소재를 활용한 포장 솔루션 시장에서는 종이와 플라스틱 솔루션의 소재 구성이 점진적으로 수렴될 것으로 전망됩니다.
식품 용도는 2025년 수요의 36.20%를 차지했으나, 규제상의 안전 기준이 성장을 제약하고 있습니다. 인도에서는 엄격한 추적성 관리 하에 식품 포장에 특정 재활용 플라스틱의 사용이 새롭게 허용되면서 장벽이 다소 완화되었습니다. 펩시코(PepsiCo)와 같은 음료 브랜드들은 재활용 폴리프로필렌을 50% 사용한 스낵 팩을 선보이며, 성능이 허용하는 한 더 광범위한 채택이 진행될 것임을 시사하고 있습니다.
가정용 및 퍼스널케어 분야는 소비자들이 저탄소 제품에 대해 다소 높은 가격을 수용하게 됨에 따라 연평균 성장률(CAGR) 6.58%로 성장할 전망입니다. 볼 코퍼레이션은 메도우사에 비누 및 샴푸용 완전 재활용 가능한 알루미늄 카트리지 출시를 위한 자금을 지원함으로써, 브랜드 측이 신속하게 소재를 전환할 준비가 되어 있음을 보여주고 있습니다. 또한, 전자상거래 및 산업용 포장 등 2차 산업 분야에서도 회수 네트워크가 성숙해짐에 따라 더 많은 PCR이 도입되고 있으며, 재활용 소재를 활용한 포장 솔루션 시장이 확대되고 있습니다.
지역별 분석
아시아태평양은 2025년에 재활용 소재 포장 솔루션 시장 규모의 45.80%를 차지했으며, 연평균 성장률(CAGR) 7.55%로 성장할 전망입니다. 베트남의 확대 생산자 책임(EPR) 목표, 한국의 재활용 함유율 기준, 태국의 세제 혜택과 같은 규제의 명확화가 투자 흐름을 뒷받침하고 있습니다. 아세안(ASEAN) 국가들의 인프라에 대한 자금 지원은 회수 병목 현상을 해소하고, 그동안 공급 안정성을 저해하던 과제를 극복하고 있습니다.
북미에서는 2017년 이후 발표된 80억 달러 규모의 재활용 사업 확대로 혜택을 보고 있으며, 연간 약 900만 톤의 폐기물을 처리할 수 있는 능력이 추가되었습니다. 2025년 7월에 시행된 오리건주 및 콜로라도주의 확대 생산자 책임(EPR) 법은 생산자 부담금을 명확히 하고, 재활용성을 중시한 제품 재설계를 촉진했습니다. 기업의 조달 약속을 통해 판로가 확보되어 안정적인 투자 전망을 뒷받침하고 있습니다. 유럽은 규제 측면에서 리더십을 유지하고 있습니다. 2030년까지 식품 포장재에서 재생 PET 사용률을 30%로 의무화하는 조치와 재활용을 고려한 설계(Design for Recycling) 기준이 혁신의 파이프라인을 촉진하고 있습니다. 4evergreen 및 FINAT과 같은 협력 플랫폼은 각각 종이 및 라벨 라이너 재활용을 위한 기술 지침을 수립하고 있습니다. 남미, 중동 및 아프리카의 완만한 성장은 새로 도입된 보조금과, 재활용 소재를 활용한 포장 솔루션 시장을 서서히 확대해 나가고 있는 초기 단계의 EPR(확대 생산자 책임) 체계를 반영하고 있습니다.
기타 혜택 :
- 엑셀 형식 시장 예측(ME) 시트
- 3개월간의 애널리스트 지원
자주 묻는 질문
목차
제1장 서론
제2장 조사 방법
제3장 주요 요약
제4장 시장 구도
제5장 시장 규모 및 성장 예측
제6장 경쟁 구도
제7장 시장 기회 및 향후 전망
KTH 26.09.10According to Mordor Intelligence, the recycled materials packaging solutions market size in 2026 is estimated at USD 210.35 billion, growing from 2025 value of USD 199.93 billion with 2031 projections showing USD 271.42 billion, growing at 5.21% CAGR over 2026-2031.
This report is Segmented by Material Type (Plastic, Paper, Glass, and Metal), End-User Industry (Food, Beverage, Home and Personal Care, Healthcare, and More), Packaging Type (Rigid Packaging, and Flexible Packaging), Source of Recycled Material (Post-Consumer Recyclate, Post-Industrial Recyclate, and More), and Geography. The Market Forecasts are Provided in Terms of Value (USD).
Global Recycled Materials Packaging Solutions Market Trends and Insights
Extended Producer Responsibility (EPR) Mandates Expansion
EPR statutes shift end-of-life costs from municipalities to producers, making recycled content economically attractive. Vietnam's 2024 rules require 22% recycling for rigid PET and 40% material recovery rates, sparking rapid equipment upgrades. South Korea is boosting the required recycled plastic in PET bottles from 3% to 10% and targets 30% by 2030. Thailand's label-free PET initiative trims contamination and considers tax credits for recycled resin. The EU Packaging and Packaging Waste Regulation mandates 30% recycled PET in food packaging by 2030. India now allows specified recycled plastics in food packaging, requiring traceability labelling.
Brand-Owner 2025 Recycled-Content Targets
Global brands are voluntarily outpacing regulation. Estee Lauder seeks at least 25% PCR and to halve virgin plastic by 2030. Mars moved key confectionery jars to 100% recycled resin, cutting 1,300 tonnes of virgin plastic each year. Mondelez will package 300 million Cadbury sharing bars in 80% attributable recycled plastic. Cadbury Australia sourced 1,000 tonnes of chemically recycled polypropylene for Dairy Milk bars.
Volatile Supply of High-Quality Recycled Feedstock
Pricing for recycled PET and high-density polyethylene swings widely, imposing budgeting challenges for converters. Beverage brands recently queued 6-8 weeks for food-grade rPET while virgin alternatives were available in 3 weeks. Contamination means 15-25% of collected plastics fail food-grade tests, forcing some brands to under-fulfill recycled-content pledges. The volatility is most acute for barrier materials that demand specialty grades.
Other drivers and restraints analyzed in the detailed report include:
- Advanced Sortation Technologies: Reducing Contamination
- Consumer Preference for Low-Carbon Packaging
- Competing Demand from Fiber-Based Substitute Packaging
For complete list of drivers and restraints, kindly check the Table Of Contents.
Segment Analysis
In 2025, paper commanded 44.25% of the recycled materials packaging solutions market share, reflecting mature fiber collection systems and corrugated recovery rates above 90% in North America. Plastic is projected to post a 6.03% CAGR through 2031 as chemical recycling improves food-grade quality and unlocks new applications. Glass continues serving premium beverage and cosmetic niches where brand equity values tactile heft. Metal offers infinite recyclability that attracts closed-loop purchasers, buttressing its role in aerosol, beverage, and cosmetics packaging even when volumes remain modest.
Paper maintains steady growth due to global e-commerce, but plastics claim future upside. Investment topping USD 8 billion accelerates chemical recycling to offset the shortfall in food-grade rPET. Examples such as Eastman's Gemini compact underscore plastics' progress into cosmetics using molecularly recycled resins. Consequently, the recycled materials packaging solutions market expects a gradual convergence in the material mix between paper and plastic solutions.
Food applications generated 36.20% of 2025 demand, but regulatory safety thresholds constrain growth. India's new allowance of specific recycled plastics in food packaging under strict traceability slightly relaxes barriers. Beverage brands such as PepsiCo demonstrate 50% recycled polypropylene snack packs, hinting at broader adoption where performance permits.
Home and personal care is set to rise at a 6.58% CAGR, as consumers accept premiums for low-carbon formats. Ball Corporation financed Meadow to launch fully recyclable aluminum cartridges for soaps and shampoos, showing brand readiness to switch materials swiftly. Secondary industries such as e-commerce and industrial packaging also incorporate more PCR as collection networks mature, broadening the recycled materials packaging solutions market.
Complete Report Scope:
- By Material Type
- Plastic
- Paper
- Glass
- Metal
- By End-User Industry
- Food
- Beverage
- Home and Personal Care
- Healthcare
- Other End-user Industries
- By Packaging Type
- Rigid Packaging
- Flexible Packaging
- By Source of Recycled Material
- Post-consumer Recyclate (PCR)
- Post-industrial Recyclate (PIR)
- Ocean-bound and Recovered Waste
- By Geography
- North America
- United States
- Canada
- Mexico
- South America
- Brazil
- Argentina
- Rest of South America
- Europe
- Germany
- France
- United Kingdom
- Italy
- Spain
- Rest of Europe
- Asia-Pacific
- China
- Japan
- India
- South Korea
- ASEAN Countries
- Australia and New Zealand
- Rest of Asia-Pacific
- Middle East and Africa
- Middle East
- Saudi Arabia
- United Arab Emirates
- Turkey
- Rest of Middle East
- Africa
- South Africa
- Nigeria
- Egypt
- Rest of Africa
- Middle East
- North America
Geography Analysis
Asia-Pacific held 45.80% of the recycled materials packaging solutions market size in 2025 and will grow at a 7.55% CAGR. Regulatory clarity, such as Vietnam's EPR targets, South Korea's recycled-content thresholds, and Thailand's tax incentives, is reinforcing investment flows. Infrastructure financing across ASEAN nations addresses collection bottlenecks, closing gaps that historically impeded supply consistency.
North America benefits from USD 8 billion in announced recycling expansions since 2017, adding capacity to process almost 9 million tonnes of waste annually. Extended Producer Responsibility laws in Oregon and Colorado that take effect in July 2025 clarify producer fees and spur redesign toward recyclability. Corporate procurement commitments secure offtake, supporting a stable investment outlook. Europe sustains regulatory leadership. Mandatory 30% recycled PET for food packaging by 2030 and design-for-recycling criteria foster innovation pipelines. Collaborative platforms such as 4evergreen and FINAT develop technical guidance for paper and label liner recycling, respectively. Moderate growth in South America and the Middle East & Africa reflects emerging grant funding and nascent EPR frameworks that gradually enlarge the recycled materials packaging solutions market.
- Amcor plc
- Kruger Inc.
- Smurfit WestRock plc
- Packaging Corporation of America
- Tetra Laval International S.A.
- International Paper Company
- Mondi plc
- Verallia SA
- Sealed Air Corporation
- Ardagh Group
- Plastipak Holdings, Inc.
- Billerud AB
- Stora Enso Oyj
- UPM-Kymmene Corporation
- Huhtamaki Oyj
- Graphic Packaging Holding Company
- Veolia Environnement S.A.
- Eco-Products, Inc.
- Loop Industries, Inc.
- Sonoco Products Company
Additional Benefits:
- The market estimate (ME) sheet in Excel format
- 3 months of analyst support
TABLE OF CONTENTS
1 INTRODUCTION
- 1.1 Study Assumptions and Market Definition
- 1.2 Scope of the Study
2 RESEARCH METHODOLOGY
3 EXECUTIVE SUMMARY
4 MARKET LANDSCAPE
- 4.1 Market Overview
- 4.2 Market Drivers
- 4.2.1 Extended Producer Responsibility (EPR) Mandates Expansion
- 4.2.2 Brand-Owner 2025 Recycled-Content Targets
- 4.2.3 Advanced Sortation Technologies: Reducing Contamination
- 4.2.4 Consumer Preference for Low-Carbon Packaging
- 4.2.5 Corporate Net-Zero Commitments Accelerating PCR Procurement
- 4.2.6 Surging Investment in Chemical Recycling Capacity
- 4.3 Market Restraints
- 4.3.1 Volatile Supply of High-Quality Recycled Feedstock
- 4.3.2 Competing Demand from Fiber-Based Substitute Packaging
- 4.3.3 Unfavorable Economics when Virgin Resin Prices Decline
- 4.3.4 Recycling Infrastructure Gaps in Emerging Markets
- 4.4 Industry Value Chain Analysis
- 4.5 Regulatory Landscape
- 4.6 Technological Outlook
- 4.7 Porter's Five Forces Analysis
- 4.7.1 Bargaining Power of Suppliers
- 4.7.2 Bargaining Power of Buyers
- 4.7.3 Threat of New Entrants
- 4.7.4 Threat of Substitutes
- 4.7.5 Intensity of Competitive Rivalry
- 4.8 Impact of Macroeconomic Factors on the Market
5 MARKET SIZE AND GROWTH FORECASTS (VALUE)
- 5.1 By Material Type
- 5.1.1 Plastic
- 5.1.2 Paper
- 5.1.3 Glass
- 5.1.4 Metal
- 5.2 By End-User Industry
- 5.2.1 Food
- 5.2.2 Beverage
- 5.2.3 Home and Personal Care
- 5.2.4 Healthcare
- 5.2.5 Other End-user Industries
- 5.3 By Packaging Type
- 5.3.1 Rigid Packaging
- 5.3.2 Flexible Packaging
- 5.4 By Source of Recycled Material
- 5.4.1 Post-consumer Recyclate (PCR)
- 5.4.2 Post-industrial Recyclate (PIR)
- 5.4.3 Ocean-bound and Recovered Waste
- 5.5 By Geography
- 5.5.1 North America
- 5.5.1.1 United States
- 5.5.1.2 Canada
- 5.5.1.3 Mexico
- 5.5.2 South America
- 5.5.2.1 Brazil
- 5.5.2.2 Argentina
- 5.5.2.3 Rest of South America
- 5.5.3 Europe
- 5.5.3.1 Germany
- 5.5.3.2 France
- 5.5.3.3 United Kingdom
- 5.5.3.4 Italy
- 5.5.3.5 Spain
- 5.5.3.6 Rest of Europe
- 5.5.4 Asia-Pacific
- 5.5.4.1 China
- 5.5.4.2 Japan
- 5.5.4.3 India
- 5.5.4.4 South Korea
- 5.5.4.5 ASEAN Countries
- 5.5.4.6 Australia and New Zealand
- 5.5.4.7 Rest of Asia-Pacific
- 5.5.5 Middle East and Africa
- 5.5.5.1 Middle East
- 5.5.5.1.1 Saudi Arabia
- 5.5.5.1.2 United Arab Emirates
- 5.5.5.1.3 Turkey
- 5.5.5.1.4 Rest of Middle East
- 5.5.5.2 Africa
- 5.5.5.2.1 South Africa
- 5.5.5.2.2 Nigeria
- 5.5.5.2.3 Egypt
- 5.5.5.2.4 Rest of Africa
- 5.5.5.1 Middle East
- 5.5.1 North America
6 COMPETITIVE LANDSCAPE
- 6.1 Market Concentration
- 6.2 Strategic Moves
- 6.3 Market Share Analysis
- 6.4 Company Profiles (includes Global level Overview, Market level overview, Core Segments, Financials as available, Strategic Information, Market Rank/Share for key companies, Products and Services, and Recent Developments)
- 6.4.1 Amcor plc
- 6.4.2 Kruger Inc.
- 6.4.3 Smurfit WestRock plc
- 6.4.4 Packaging Corporation of America
- 6.4.5 Tetra Laval International S.A.
- 6.4.6 International Paper Company
- 6.4.7 Mondi plc
- 6.4.8 Verallia SA
- 6.4.9 Sealed Air Corporation
- 6.4.10 Ardagh Group
- 6.4.11 Plastipak Holdings, Inc.
- 6.4.12 Billerud AB
- 6.4.13 Stora Enso Oyj
- 6.4.14 UPM-Kymmene Corporation
- 6.4.15 Huhtamaki Oyj
- 6.4.16 Graphic Packaging Holding Company
- 6.4.17 Veolia Environnement S.A.
- 6.4.18 Eco-Products, Inc.
- 6.4.19 Loop Industries, Inc.
- 6.4.20 Sonoco Products Company
7 MARKET OPPORTUNITIES AND FUTURE OUTLOOK
- 7.1 White-space and Unmet-need Assessment


