|
시장보고서
상품코드
2120530
유럽의 스마트 오피스 : 시장 점유율 분석, 업계 동향 및 통계, 성장 예측(2026-2031년)Europe Smart Office - Market Share Analysis, Industry Trends & Statistics, Growth Forecasts (2026 - 2031) |
||||||
 Mordor Intelligence
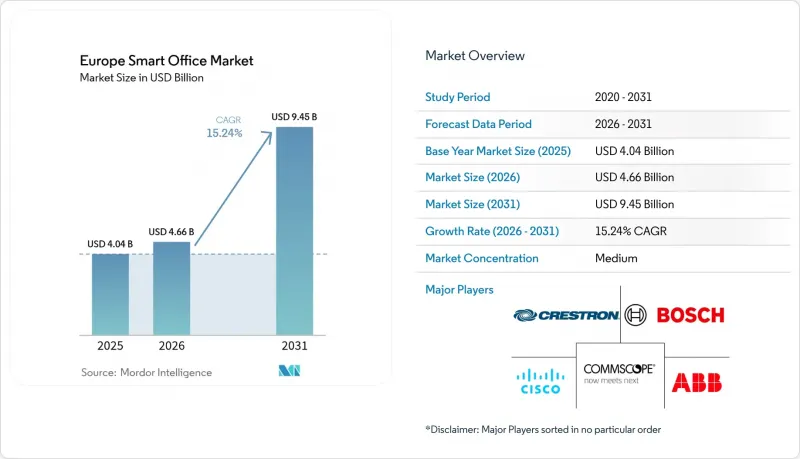
Mordor Intelligence에 의하면, 2026년 유럽의 스마트 오피스 시장 규모는 46억 6,000만 달러로 추정되고 2025년 40억 4,000만 달러에서 확대해, 2031년에는 94억 5,000만 달러에 이를 것으로 예측됩니다.
2026-2031년 동안 연평균 성장률(CAGR) 15.24%로 성장할 것으로 전망됩니다.
본 보고서는 제품 유형별(보안·출입 통제 시스템, 에너지 관리 시스템, 기타), 건축 유형별(리모델링, 신축 건물),연결 기술별(유선, 무선), 제공 형태별(하드웨어, 소프트웨어, 서비스), 최종 사용자 산업별(IT 및 통신, 은행, 금융서비스 및 보험(BFSI), 기타), 국가별로 분류되어 있습니다. 시장 예측은 금액(달러) 기준으로 제시되어 있습니다.
유럽의 스마트 오피스 시장 동향 및 인사이트
유럽연합(EU)의 엄격한 에너지 효율 규제
2024년에 개정된 ‘건물 에너지 성능에 관한 지침’에 따라, 모든 신규 상업용 건물은 2030년까지 탄소 중립을 달성해야 합니다. 독일은 AI를 활용한 에너지 최적화를 우선시하는 개보수 보조금으로 145억 유로(155억 달러)를 배정했습니다. 해당 지침에서는 건물 거주자의 요구 사항과 전력 계통 신호에 대한 대응 정도를 평가하는 ‘스마트 대응도 지표’가 도입되어, 고밀도 센서 네트워크에 대한 수요가 증가하고 있습니다. 프랑스의 RE2020 규정은 수명 주기 전반에 걸친 탄소 배출량을 제한하고 있으며, 개발업자들이 제어 기능이 내장된 조립식 모듈을 채택하도록 유도하고 있습니다. 이러한 규제들이 결합되면서, 단계적인 업그레이드 대신 조명, HVAC, 보안 시스템을 아우르는 완전한 디지털 통합이 실현되고 있습니다.
하이브리드형·유연한 근무 방식의 보급
2020년부터 2024년에 걸쳐 사무실의 평균 연면적은 18% 축소되었지만, 일일 가동률이 40%에서 70% 사이로 변동함에 따라 계획 수립에 불확실성이 발생하고 있습니다. 금융 규제 당국에 따르면, 영국 금융 기업의 82%가 현재 유연한 근무 정책을 도입하고 있으며, 핫데스크 및 분석 도구에 대한 투자가 가속화되고 있습니다. 실시간 데이터를 통해 시설 관리 팀은 사용되지 않는 층을 폐쇄하고 에너지 예산을 절감할 수 있게 됩니다. 또한, 활동 기반 근무 방식에는 기존 시스템에는 부족한 세밀한 쾌적성 제어가 요구됩니다.
리모델링 프로젝트에 필요한 막대한 초기 설비 투자
스마트 오피스 리모델링 비용은 평방미터당 150-400유로(160-426달러)에 달하며, 5,000평방미터 규모의 시설에서는 160만 유로의 비용이 발생합니다. 이탈리아의 관대한 ‘슈퍼 보너스’ 보조율이 110%에서 70%로 인하됨에 따라, 새로운 공제 조치가 도입될 때까지 도입 움직임은 주춤해졌습니다. 회수 기간이 7년을 초과한다는 점은 유럽투자은행(EIB)의 보조금 신청이 여전히 정원을 초과하고 있음에도 불구하고, 소규모 부동산 소유주들에게는 장벽이 되고 있습니다.
부문별 분석
2025년, 스마트 조명 시스템은 유럽의 스마트 오피스 시장 점유율의 28.12%를 차지했습니다. 업무 공간 분석 부문에서 유럽의 스마트 오피스 시장 규모는 실시간 공간 데이터에 대한 수요에 힘입어 연평균 성장률(CAGR) 15.73%로 성장할 전망입니다. 마이크로소프트의 ‘Viva Insights’는 3,200개 장소를 커버하며, ‘Azure 디지털 트윈’과 연동하여 예측 히트맵을 제공합니다. 생체 인증의 활용 확대에 따라 보안 및 접근 제어 시스템은 견조한 성장세를 유지하고 있습니다. 2024년 독일의 상업용 전력 가격이 kW시당 평균 0.28유로(0.30달러)를 기록한 데 따라, 에너지 관리 도구의 수주가 증가하고 있습니다.
하드웨어의 발전으로 인해 공간 오디오 및 자동 프레이밍 기능을 갖춘 오디오·비디오 시스템이 확산되는 한편, 화재 및 안전 제어 시스템은 건물 네트워크와의 통합이 더욱 진전되고 있습니다. 센서에 대한 상품화 압력으로 인해 공급업체들은 하드웨어와 분석 서비스 구독을 묶어 제공하는 방향으로 나아가고 있습니다. 유럽의 스마트 오피스 산업에서는 조명, HVAC, 보안 데이터가 단일 분석 계층으로 통합되도록 상호 운용성의 중요성이 계속해서 강조되고 있습니다.
기존 건물의 리모델링은 도입 사례의 54.84%를 차지하고 있지만, 인건비 급등이라는 과제에 직면해 있습니다. 유럽의 스마트 오피스 시장 규모(신축 건물)는 연평균 성장률(CAGR) 16.01%로 확대될 것으로 예측됩니다. 스칸스카(Skanska)사는 2024년 1월 이후 착공하는 모든 프로젝트에 AI 지원 빌딩 관리 시스템을 도입하고 있으며, 이로 인해 비용은 3% 증가하지만 임대료 프리미엄을 통해 8-12%의 수익 증가가 예상됩니다. 대규모 목조 건축물에서는 정밀한 습도 제어가 요구되고 있어, 스마트 센서의 조기 도입이 진행되고 있습니다.
2010년 이전에 건설된 사무실이 70%를 차지하며, 새로운 효율화 기준을 충족해야 하기 때문에 리모델링 공사 수요는 여전히 막대합니다. 그러나 예상치 못한 기존 배선 문제와 입주 중인 상태에서 설치가 필요하다는 점 때문에 투자 회수 기간이 길어지고 있습니다. 특히 독일, 프랑스, 북유럽 국가에서는 현지 규제에 따라 철거가 허용되는 경우, 개발업자들이 스마트 기능을 갖춘 재건축을 선택하는 경향이 강해지고 있습니다.
기타 혜택
- 엑셀 형식 시장 예측(ME) 시트
- 3개월간의 애널리스트 지원
자주 묻는 질문
목차
제1장 서론
제2장 조사 방법
제3장 주요 요약
제4장 시장 구도
제5장 시장 규모 및 성장 예측
제6장 경쟁 구도
제7장 시장 기회 및 향후 전망
KTH 26.09.04According to Mordor Intelligence, the Europe smart office market size in 2026 is estimated at USD 4.66 billion, growing from 2025 value of USD 4.04 billion with 2031 projections showing USD 9.45 billion, growing at 15.24% CAGR over 2026-2031.
This report is Segmented by Product Type (Security and Access Control Systems, Energy Management Systems, and More), Building Type (Retrofits, and New Buildings), Connectivity Technology (Wired, and Wireless), Offering (Hardware, Software, and Services), End-User Industry (IT and Telecom, BFSI, and More), and Country. The Market Forecasts are Provided in Terms of Value (USD).
Europe Smart Office Market Trends and Insights
Stringent European Union Energy Efficiency Regulations
The 2024 revision of the Energy Performance of Buildings Directive forces every new commercial building to reach zero-emission status by 2030. Germany set aside EUR 14.5 billion (USD 15.5 billion) in retrofit grants that favor AI-driven energy optimization. The directive introduces smart readiness indicators that score a building's response to occupant needs and grid signals, pushing demand for dense sensor networks. France's RE2020 code limits lifecycle carbon, steering developers toward prefabricated modules with embedded controls. Together, these rules replace incremental upgrades with full digital orchestration across lighting, HVAC, and security.
Growing Adoption of Hybrid and Flexible Work Models
Average office footprints shrank 18% between 2020 and 2024, yet daily occupancy swings from 40% to 70% create planning uncertainty. Finance regulators note that 82% of U.K. financial firms now run flexible policies, accelerating hot-desking and analytics investments. Real-time data lets facility teams shut unused floors and trim energy budgets. Activity-based working also demands granular comfort controls that legacy systems lack.
High Upfront Capital Expenditure for Retrofit Projects
Smart office retrofits can cost EUR 150-400 (USD 160-426) per square meter, placing a EUR 1.6 million bill on a 5,000 square-meter site. Italy's generous Superbonus fell from 110% to 70% coverage, slowing activity until fresh deductions arrived. Payback horizons stretching beyond seven years deter smaller landlords, even as European Investment Bank grants remain oversubscribed.
Other drivers and restraints analyzed in the detailed report include:
- Rapid Decline in IoT Sensor and Connectivity Costs
- Integration of Digital Twins for Predictive Workplace Management
- Heightened Data Privacy and Cybersecurity Concerns under GDPR
For complete list of drivers and restraints, kindly check the Table Of Contents.
Segment Analysis
Smart Lighting Systems held 28.12% of Europe Smart Office Market Share in 2025. Europe Smart Office Market Size for workplace analytics is on track to expand at 15.73% CAGR, driven by demand for real-time space data. Microsoft's Viva Insights covers 3,200 locations and links with Azure Digital Twins to offer predictive heatmaps. Security and access systems stay resilient due to growing biometric use. Energy management tools see rising orders as Germany's commercial power price averaged EUR 0.28 (USD 0.30) per kilowatt-hour in 2024.
Hardware advances spur audio-video systems with spatial audio and auto-framing, while fire and safety controls integrate deeper into building networks. Commodity pressure on sensors pushes suppliers toward bundling hardware with analytics subscriptions. The Europe Smart Office Industry continues to emphasize interoperability so that lighting, HVAC, and security data converge in one analytics layer.
Retrofits represented 54.84% of deployments yet face higher labor costs. Europe Smart Office Market Size for new buildings is projected to rise at 16.01% CAGR. Skanska embeds AI-ready building management in every project started after January 2024, adding 3% to cost but earning 8-12% rental premiums. Mass timber structures demand precise humidity control, pushing early adoption of smart sensors.
Retrofit activity remains vast because 70% of offices pre-date 2010 and must meet new efficiency rules. However, unforeseen legacy wiring issues and the need for live-occupied installation prolong payback. Developers increasingly choose smart-enabled rebuilds where local rules allow demolition, especially in Germany, France, and the Nordics.
Complete Report Scope:
- By Product Type
- Security and Access Control Systems
- Energy Management Systems
- Smart HVAC Control Systems
- Smart Lighting Systems
- Audio-Video Conferencing Systems
- Fire and Safety Control Systems
- Smart Sensors
- Workplace Analytics Solutions
- Others
- By Building Type
- Retrofits
- New Buildings
- By Connectivity Technology
- Wired
- Wireless
- Wi-Fi
- Zigbee
- Bluetooth
- Z-Wave
- Thread
- Others
- By Offering
- Hardware
- Sensors
- Controllers and Actuators
- Networking Equipment
- Software
- Building Management Platforms
- Analytics and AI Software
- Services
- Professional Services
- Managed Services
- Hardware
- By End-User Industry
- IT and Telecom
- BFSI
- Healthcare and Life Sciences
- Government and Public Sector
- Manufacturing
- Retail and Hospitality
- Education
- Others
- By Country
- Germany
- United Kingdom
- France
- Italy
- Spain
- Netherlands
- Nordics
- Russia
- Rest of Europe
List of Companies Covered in this Report:
- ABB Ltd.
- Bosch Building Technologies GmbH
- Cisco Systems, Inc.
- CommScope Holding Company, Inc.
- Crestron Electronics, Inc.
- Delta Electronics, Inc.
- Emerson Electric Co.
- Google LLC
- Honeywell International Inc.
- Huawei Technologies Co., Ltd.
- IBM Corporation
- Johnson Controls International plc
- Koninklijke Philips N.V. (Signify)
- Legrand SA
- Lutron Electronics Co., Inc.
- Microsoft Corporation
- Robert Bosch GmbH
- Schneider Electric SE
- Siemens AG
- Sony Group Corporation
- RTX Corporation (formerly United Technologies Corporation)
Additional Benefits:
- The market estimate (ME) sheet in Excel format
- 3 months of analyst support
TABLE OF CONTENTS
1 INTRODUCTION
- 1.1 Study Assumptions and Market Definition
- 1.2 Scope of the Study
2 RESEARCH METHODOLOGY
3 EXECUTIVE SUMMARY
4 MARKET LANDSCAPE
- 4.1 Market Overview
- 4.2 Market Drivers
- 4.2.1 Stringent European Union Energy Efficiency Regulations
- 4.2.2 Growing Adoption of Hybrid and Flexible Work Models
- 4.2.3 Rapid Decline in IoT Sensor and Connectivity Costs
- 4.2.4 Expansion of 5G Private Networks in Commercial Buildings
- 4.2.5 Rising Corporate ESG and Net-Zero Commitments
- 4.2.6 Integration of Digital Twins for Predictive Workplace Management
- 4.3 Market Restraints
- 4.3.1 High Upfront Capital Expenditure for Retrofit Projects
- 4.3.2 Complex Interoperability Across Legacy Building Systems
- 4.3.3 Heightened Data Privacy and Cybersecurity Concerns under GDPR
- 4.3.4 Shortage of Skilled Technicians for Smart Building Deployment
- 4.4 Industry Value / Supply-Chain Analysis
- 4.5 Regulatory Landscape
- 4.6 Technological Outlook
- 4.7 Impact of Macroeconomic Factors on the Market
- 4.8 Porter's Five Forces Analysis
- 4.8.1 Bargaining Power of Suppliers
- 4.8.2 Bargaining Power of Consumers
- 4.8.3 Threat of New Entrants
- 4.8.4 Threat of Substitute Products
- 4.8.5 Intensity of Competitive Rivalry
5 MARKET SIZE AND GROWTH FORECASTS (VALUE)
- 5.1 By Product Type
- 5.1.1 Security and Access Control Systems
- 5.1.2 Energy Management Systems
- 5.1.3 Smart HVAC Control Systems
- 5.1.4 Smart Lighting Systems
- 5.1.5 Audio-Video Conferencing Systems
- 5.1.6 Fire and Safety Control Systems
- 5.1.7 Smart Sensors
- 5.1.8 Workplace Analytics Solutions
- 5.1.9 Others
- 5.2 By Building Type
- 5.2.1 Retrofits
- 5.2.2 New Buildings
- 5.3 By Connectivity Technology
- 5.3.1 Wired
- 5.3.2 Wireless
- 5.3.2.1 Wi-Fi
- 5.3.2.2 Zigbee
- 5.3.2.3 Bluetooth
- 5.3.2.4 Z-Wave
- 5.3.2.5 Thread
- 5.3.2.6 Others
- 5.4 By Offering
- 5.4.1 Hardware
- 5.4.1.1 Sensors
- 5.4.1.2 Controllers and Actuators
- 5.4.1.3 Networking Equipment
- 5.4.2 Software
- 5.4.2.1 Building Management Platforms
- 5.4.2.2 Analytics and AI Software
- 5.4.3 Services
- 5.4.3.1 Professional Services
- 5.4.3.2 Managed Services
- 5.4.1 Hardware
- 5.5 By End-User Industry
- 5.5.1 IT and Telecom
- 5.5.2 BFSI
- 5.5.3 Healthcare and Life Sciences
- 5.5.4 Government and Public Sector
- 5.5.5 Manufacturing
- 5.5.6 Retail and Hospitality
- 5.5.7 Education
- 5.5.8 Others
- 5.6 By Country
- 5.6.1 Germany
- 5.6.2 United Kingdom
- 5.6.3 France
- 5.6.4 Italy
- 5.6.5 Spain
- 5.6.6 Netherlands
- 5.6.7 Nordics
- 5.6.8 Russia
- 5.6.9 Rest of Europe
6 COMPETITIVE LANDSCAPE
- 6.1 Market Concentration
- 6.2 Strategic Moves
- 6.3 Market Share Analysis
- 6.4 Company Profiles (includes Global Level Overview, Market Level Overview, Core Segments, Financials as Available, Strategic Information, Market Rank/Share for Key Companies, Products and Services, and Recent Developments)
- 6.4.1 ABB Ltd.
- 6.4.2 Bosch Building Technologies GmbH
- 6.4.3 Cisco Systems, Inc.
- 6.4.4 CommScope Holding Company, Inc.
- 6.4.5 Crestron Electronics, Inc.
- 6.4.6 Delta Electronics, Inc.
- 6.4.7 Emerson Electric Co.
- 6.4.8 Google LLC
- 6.4.9 Honeywell International Inc.
- 6.4.10 Huawei Technologies Co., Ltd.
- 6.4.11 IBM Corporation
- 6.4.12 Johnson Controls International plc
- 6.4.13 Koninklijke Philips N.V. (Signify)
- 6.4.14 Legrand SA
- 6.4.15 Lutron Electronics Co., Inc.
- 6.4.16 Microsoft Corporation
- 6.4.17 Robert Bosch GmbH
- 6.4.18 Schneider Electric SE
- 6.4.19 Siemens AG
- 6.4.20 Sony Group Corporation
- 6.4.21 RTX Corporation (formerly United Technologies Corporation)
7 MARKET OPPORTUNITIES AND FUTURE OUTLOOK
- 7.1 White-Space and Unmet-Need Assessment