
|
시장보고서
상품코드
2120613
양자점 : 시장 점유율 분석, 업계 동향 및 통계, 성장 예측(2026-2031년)Quantum Dots (QD) - Market Share Analysis, Industry Trends & Statistics, Growth Forecasts (2026 - 2031) |
||||||
 Mordor Intelligence
Mordor Intelligence에 의하면, 세계의 양자점 시장 규모는 2025년 94억 6,000만 달러로 평가되었습니다. 2026년에는 103억 달러로 확대되어 2026년부터 2031년에 걸쳐 CAGR 8.86%로 성장을 지속하여, 2031년까지 157억 3,000만 달러에 이를 것으로 예측됩니다.
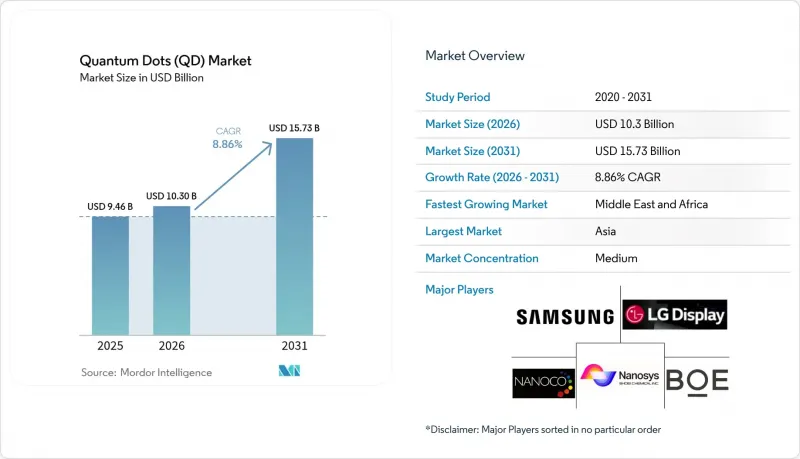
본 보고서는 재료 유형(카드뮴계 II-VI족(CdSe, CdS, CdTe), 카드뮴이 포함되지 않은 III-V족(InP, GaAs) 등), 소자 형태(QD 필름, 온칩 양자점 등), 용도(디스플레이, 조명, 태양전지 및 태양광 발전, 기타), 최종 이용 산업(소비자 가전, 헬스케어 및 생명과학, 기타), 그리고 지역별로 분류되어 있습니다. 시장 예측은 금액(달러) 기준으로 제시되어 있습니다.
세계의 양자점 시장 동향 및 인사이트력
중국을 필두로 한 초고화질 TV 패널에서의 양자점 채택
국내 패널 제조업체들은 NTSC 색역 100% 이상을 구현하는 대용량 양자점 필름 생산 라인을 도입하고 있는 반면, TCL의 QM6K 시리즈는 초고에너지 LED 백라이트를 통해 DCI-P3 커버리지 98% 이상과 53% 더 높은 휘도를 달성하고 있습니다. 2026년 가동을 시작할 예정인 BOE의 90억 달러 규모 Gen-8.6 AMOLED 제조 시설은 비용 면에서의 우위를 강화하고 지역 브랜드공급을 확보할 것입니다. RGB OLED에서 QD-OLED 아키텍처로의 전환을 통해 제조 공정이 간소화되고, 4K 및 8K 스크린의 수율이 향상되며, 1제곱미터당 자본 지출(CAPEX)이 절감됩니다.
EU의 소비자용 전자기기 내 카드뮴 프리 양자점 규제 추진
RoHS에 기반한 EU의 카드뮴 함유량 0.01 wt% 상한 규제로 인해, 선도적인 기업들은 구리·인듐 및 인듐 인화물 배합으로의 전환을 추진하고 있습니다. UbiQD사의 2,000만 달러 규모의 시리즈 B 자금 조달로 카드뮴 프리 생산이 확대되는 한편, 어플라이드 머티리얼즈(Applied Materials)사는 색 변환층에서 카드뮴과 동등한 성능을 발휘하는 무연 디바이스의 실증에 성공했습니다. 각 대학에서는 유기 용매를 배제하고 공정에서 배출되는 물질을 줄이는 수성 합성법의 상용화가 진행되고 있으며, 이를 채택한 기업에게는 비용 및 규정 준수 측면에서 이점이 발생하고 있습니다.
고순도 인화 인듐 전구체공급망 병목 현상
6G 인프라에 따른 인듐 수요는 연간 생산량의 4%를 소비할 것으로 예측되며, 이로 인해 인듐 인화물 양자점공급이 부족해져 가격 상승을 초래하고 있습니다. 쑤저우 대학의 잉크 공학을 이용한 합성법은 태양광 발전 비용을 0.06달러/Wp까지 낮추지만, 안정적인 인듐 순도에 의존하고 있어 극소수의 정제 업체를 제외하고는 여전히 공급이 부족한 상황입니다. 마이크로파 보조 합성이나 이온 액체 합성은 유해 시약 사용을 줄여주지만, 여전히 안정적인 금속 원료가 필요하기 때문에 적어도 2028년까지는 공급 리스크가 높은 수준을 유지할 전망입니다.
부문 분석
카드뮴계 II-VI 화합물은 2025년 매출의 47.62%를 차지하며, 확립된 공급망과 높은 양자 수율 덕분에 양자점 시장의 기반을 형성했습니다. 그러나 EU와 캘리포니아주의 정책이 경원소계 화학 물질로 전환되고 있어 규제 리스크가 해당 시장 전망을 압박하고 있습니다. 연평균 성장률(CAGR) 11.28%로 성장하는 페로브스카이트계 양자점은 실험실에서의 신기한 존재에서 카드뮴과 동등한 휘도를 가지며 실온에서 단일 광자의 순도를 달성하는 양산 가능한 발광체로 전환되고 있어, 보안 통신 분야에서의 중요성이 높아지고 있습니다. 인듐 인화물 플랫폼은 UbiQD사의 규모 확대를 위한 자금 조달과 어플라이드 머티리얼즈사의 공정 최적화의 혜택을 받고 있지만, 전구체의 부족으로 인해 단기적인 시장 침투는 억제되고 있습니다. 실리콘 및 탄소 양자점은 생의학 분야에서 틈새 시장을 개척하고 있으며, 임상적으로 적절한 투여량에서는 세포 독성이 거의 나타나지 않아 형광 유도 수술을 가능하게 하고 있습니다. 과거 데이터에 따르면, 2020년부터 2024년에 걸쳐 카드뮴 대체 소재는 연평균 15-20%의 성장률을 보인 반면, 기존 카드뮴 제품은 5% 미만에 그치고 있어, 이는 양자점 시장의 구조적 전환을 시사합니다.
2세대 소재는 최종 용도의 폭을 넓히고 있습니다. 실리콘 나노쉘과 융합된 그래핀 양자점은 진딧물의 개체 수를 71% 억제하는 데 성공했으며, 나노 소재는 디스플레이 분야를 넘어 정밀 농업으로의 확대가 기대되고 있습니다. 페로브스카이트 발광층은 현재 140 PPI로 인쇄가 가능해져 중형 모니터에 탑재하기가 쉬워졌으며, 한편 실리콘 양자점은 웨어러블 생체 센서에 필수적인 안정적인 적외선 광발광을 실현하고 있습니다. 카드뮴 프리 부문의 양자점 시장 규모는 두 자릿수 성장률로 확대될 것으로 예측되며, 공급업체들의 저독성 화학물질로의 전환을 뒷받침하고 있습니다. 기업의 ESG 목표 고도화에 더해, RoHS 면제 조치의 만료 시한이 다가오고 있는 점도 이러한 전환의 길을 확고히 하고 있습니다.
QD 필름은 2025년에 71.35%의 점유율을 차지하며 매출의 주축으로 자리 잡았습니다. 이는 기존 LCD 스택에 통합할 수 있는 ‘플러그 앤 플레이’ 방식의 컬러 컨버터를 원하는 TV OEM 제조업체들로부터 지지를 받고 있기 때문입니다. 한편, 반도체 팹이 파운드리 플랫폼에서 직접 포토닉 이미터를 제조하게 됨에 따라 온칩 양자점은 12.15%라는 가장 높은 연평균 성장률(CAGR)을 보이고 있습니다. 케임브리지 대학이 개발한 1만 3,000 스핀의 양자 레지스터는 130µs의 코히어런스 시간에서 69%의 충실도를 달성하여, 칩 규모의 양자 노드가 비약적인 발전을 이룰 가능성을 입증하고 있습니다. 마이크로플루이딕스 반응기를 사용하여 성장시킨 코어-쉘형 나노 필러는 현재 5% 미만의 크기 편차만을 보이고 있으며, 이는 코히런트 발광에 매우 중요합니다. 파형 웨이퍼에 대한 전기영동 증착을 통해 균열이 없는 근적외선 검출기가 구현되어, 자동차용 LiDAR 및 의료용 내시경 시장으로의 길이 열리고 있습니다. 선폭 미세화가 한계에 다다른 가운데, 집적 포토닉스는 ‘무어의 법칙을 뛰어넘는’ 스케일링을 실현하고 있으며, 양자점은 실리콘 포토닉스 로드맵에 부족했던 단일 광자 소스를 제공합니다.
스케일링의 방향은 갈라지고 있습니다. 잉크젯 인쇄를 통한 QD-OLED 패널은 이미 31.5인치 대각선 크기에서 상용 수준의 수율을 달성한 반면, 전기유체역학적 제트 방식은 마이크로 LED 어레이용 마이크론 규모의 RGB 픽셀을 생성하고 있습니다. 양자 컴퓨팅 성능 향상으로 평균 판매 가격(ASP) 상승이 정당화됨에 따라, 온칩 방식의 양자점 시장 규모는 확대될 전망입니다. 원자층 증착법 및 원자 정밀도 리소그래피에 대한 투자를 통해 도트 배치와 트랜지스터 게이트웨이 간의 정합성이 더욱 향상되고, 양자 버스의 상호 연결 지연이 단축될 것입니다. 각 디바이스 OEM 업체들은 패키징, 열 관리, 리소그래피 정렬에 관한 지적 재산을 묶어 새로운 방어 가능한 경쟁 우위를 구축하고 있습니다.
지역별 분석
아시아태평양은 수직 통합형 패널 제조업체와 계획적인 국가 차원의 연구개발(R&D) 자금 투입에 힘입어 2025년 매출의 37.85%를 차지하며 계속해서 주도적인 위치를 유지했습니다. 삼성디스플레이의 109억 달러 규모의 QD-OLED 라인 전환과 한국 정부의 4,910억 원 규모의 양자점 프로그램이 생태계를 공고히 하고 있는 한편, 중국의 BOE는 90억 달러를 Gen-8.6 생산 능력에 투자하여 현지 공급망을 뒷받침하고 있습니다. 일본은 제조 역량에 더해 공정 혁신에도 주력하고 있으며, 독성 및 내구성과 관련된 병목 현상을 해결하기 위한 세미나를 개최하고 있습니다. 아시아의 양자점 시장 규모는 프리미엄 TV에 대한 국내 수요와 북미 및 유럽으로의 수출에 의해 지속적으로 뒷받침되고 있습니다.
북미에서는 케임브리지 대학(케임브리지와 미국의 공동 연구), MIT 링컨 연구소, 로스앨러모스 국립연구소의 탄탄한 연구 자원이 양자 보안 통신 및 고효율 태양광 발전을 주도하고 있습니다. 벤처 캐피탈의 지원도 견조한데, UbiQD의 2,000만 달러 자금 조달과 IonQ의 주목할 만한 인수 사례가 그 증거입니다. 강력한 지적재산권 보호와 연방 정부의 자금 지원으로 상용화 파이프라인이 확보되어 있으며, 카드뮴 화합물에 대한 미국의 수출 규제 강화가 공급업체들로 하여금 인화 인듐을 활용한 제품 개발을 추진하도록 뒷받침하고 있습니다. 유럽에서는 규제 측면의 영향력을 활용하고 있습니다. RoHS 준수에 따라 카드뮴 무함유화가 진행되는 한편, 리에주 대학교의 수용액 합성 기술로 유해 폐기물이 감소하고 있습니다. 정부의 그린 딜 기금은 에너지 순수출이 긍정적인 건축물을 대상으로 양자점 창문 필름 도입을 추진하고 있습니다.
중동 및 아프리카는 10.18%라는 가장 높은 연평균 성장률(CAGR)을 기록하고 있습니다. UAE의 노르마 센터, 카타르의 1,000만 달러 규모 프로그램, 그리고 사우디아라비아의 연구개발 자금은 석유 경제의 다각화를 목표로 양자점 컴퓨팅 클러스터 육성을 촉진하고 있습니다. 수입 대체 정책에 따라 양자점을 적용한 태양광 패널 및 의료기기의 현지 조립이 촉진되고 있습니다. 라틴아메리카에서는 농업 기술 분야에서 수요가 싹트고 있으며, 양자점을 적용한 온실용 시트가 고지대 농장의 과일 수확량을 향상시키고 있지만, 시장 침투율은 여전히 3% 미만에 그치고 있습니다. 전반적으로 지역별 수익 분산으로 인해 집중 위험이 완화됩니다. 중동 및 아프리카가 투자 흐름을 흡수하고, 서방 국가들이 핵심 소재의 가공을 국내에서 수행하게 됨에 따라, 2030년까지 아시아의 점유율은 35% 수준으로 소폭 하락할 전망입니다.
기타 혜택 :
- 엑셀 형식 시장 전망(ME) 시트
- 3개월간의 애널리스트 지원
자주 묻는 질문
목차
제1장 서론
제2장 조사 방법
제3장 주요 요약
제4장 시장 구도
제5장 시장 규모 및 성장 예측
제6장 경쟁 구도
제7장 시장 기회 및 향후 전망
KTH 26.09.10According to Mordor Intelligence, the global quantum dots market size is expected to grow from USD 9.46 billion in 2025 to USD 10.3 billion in 2026 and is forecast to reach USD 15.73 billion by 2031 at 8.86% CAGR over 2026-2031.
This report is Segmented by Material Type (Cadmium-Based II-VI (CdSe, Cds, Cdte), Cadmium-Free III-V (InP, Gaas), and More), Device Form Factor (QD Films, On-Chip Quantum Dots, and More), Application (Displays, Lighting, Solar Cells and Photovoltaics, and More), End-Use Industry (Consumer Electronics, Healthcare and Life Sciences, and More), and Geography. The Market Forecasts are Provided in Terms of Value (USD).
Global Quantum Dots (QD) Market Trends and Insights
Quantum-dot adoption in ultra-high-definition television panels, led by China
Domestic panel makers have installed high-capacity quantum-dot film lines that deliver more than 100% NTSC color gamut, while TCL's QM6K series achieves 98%+ DCI-P3 coverage and 53% higher brightness through Super High Energy LED back-lights. BOE's USD 9 billion Gen-8.6 AMOLED facility, coming online in 2026, reinforces cost leadership and secures supply for regional brands. The shift from RGB OLED to QD-OLED architectures simplifies manufacturing, enhancing yield and lowering capex per square meter for 4K and 8K screens.
Regulatory push for cadmium-free quantum dots in EU consumer electronics
The EU's 0.01 wt% cadmium cap under RoHS is driving early movers toward copper-indium and indium-phosphide formulations. UbiQD's USD 20 million Series B round will scale cadmium-free production, while Applied Materials has proven lead-free devices matching cadmium performance in color conversion layers. Universities are commercializing aqueous synthesis routes that remove organic solvents and cut process emissions, creating cost and compliance advantages for adopters.
Supply-chain bottlenecks for high-purity indium-phosphide precursors
Indium demand from 6G infrastructure is projected to consume 4% of annual production, squeezing availability for indium-phosphide quantum dots and pushing prices higher. Soochow University's ink-engineering route lowers photovoltaic costs to USD 0.06/Wp but relies on consistent indium purity, which remains scarce outside a handful of refiners. Microwave-assisted and ionic-liquid syntheses reduce hazardous reagents yet still require secure metal feedstocks, keeping supply risk elevated through at least 2028.
Other drivers and restraints analyzed in the detailed report include:
- Rapid commercialization of perovskite quantum dots in display back-lighting
- Surge in quantum-dot bio-imaging agents in healthcare applications
- Performance degradation of perovskite quantum dots under moisture exposure
For complete list of drivers and restraints, kindly check the Table Of Contents.
Segment Analysis
Cadmium-based II-VI compounds held 47.62% of 2025 revenues, anchoring the quantum dots market through well-established supply chains and high quantum yields. Regulatory exposure, however, compresses their outlook as EU and California policies converge on lighter-element chemistries. Perovskite variants, supported by 11.28% CAGR, move from lab novelty to production-ready emitters that match cadmium brightness and achieve room-temperature single-photon purity, broadening relevance for secure communications. Indium-phosphide platforms benefit from UbiQD's scale-up funding and Applied Materials' process optimization, yet precursor shortages temper near-term penetration. Silicon and carbon quantum dots are carving biomedical niches, showing negligible cytotoxicity at clinically relevant doses and enabling fluorescence-guided surgery. Historic data reveal cadmium alternatives growing 15-20% annually versus sub-5% for cadmium incumbents from 2020-2024, signaling a structural pivot in the quantum dots market.
Second-generation materials diversify end-use reach. Graphene quantum dots fused with silicon nanoshells achieve 71% aphid-population suppression, positioning nanomaterials for precision agriculture beyond displays. Perovskite glow layers are now printable at 140 PPI, easing integration into mid-sized monitors, while silicon dots deliver stable infrared photoluminescence critical for wearable biosensors. The quantum dots market size for cadmium-free segments is projected to rise at double-digit rates, reinforcing supplier pivots toward low-toxicity chemistries. Heightened corporate ESG targets, plus upcoming RoHS exemptions sunsets, cement the transition path.
QD films remain revenue mainstays with 71.35% share in 2025, favored by television OEMs seeking plug-and-play color converters that slip into existing LCD stacks. Yet on-chip quantum dots display the highest 12.15% CAGR as semiconductor fabs capture photonic emitters directly on foundry platforms. University of Cambridge's 13,000-spin quantum register, achieving 69% fidelity at 130 µs coherence, underscores leapfrog potential for chip-scale quantum nodes. Core-shell nanopillars grown through microfluidic reactors now exhibit sub-5% size dispersion, crucial for coherent emission. Electrophoretic deposition on corrugated wafers yields crack-free near-infrared detectors, opening automotive LiDAR and medical endoscope markets. As line width reductions plateau, integrated photonics offers Moore-than-More scaling, with quantum dots supplying the single-photon sources missing from silicon photonics roadmaps.
Scaling pathways diverge. Inkjet printed QD-OLED panels already hit 31.5-inch diagonals at commercial yield, while electrohydrodynamic jetting produces micron-scale RGB pixels for microLED arrays. The quantum dots market size captured by on-chip formats is set to widen as performance gains in quantum computing justify higher ASPs. Investments in atomic-layer deposition and atomic-precision lithography will further align dot placement with transistor gateways, shrinking interconnect delays in quantum buses. Device OEMs are bundling intellectual property around packaging, thermal management, and lithographic alignment, creating new defensible moats.
Complete Report Scope:
- By Material Type
- Cadmium-based II-VI (CdSe, CdS, CdTe)
- Cadmium-Free III-V (InP, GaAs)
- Perovskite Quantum Dots
- Silicon Quantum Dots
- Graphene and Carbon Quantum Dots
- By Device Form Factor
- QD Films
- On-Chip Quantum Dots
- Core-Shell and In-Shell Architectures
- By Application
- Displays
- QD-LCD
- QD-OLED
- Micro-LED Integration
- Lighting
- General Illumination
- Specialty Lighting
- Solar Cells and Photovoltaics
- Medical Imaging and Diagnostics
- Drug Delivery and Theranostics
- Sensors and Instruments
- Quantum Computing and Security
- Agriculture and Food
- Others
- Displays
- By End-Use Industry
- Consumer Electronics
- Healthcare and Life Sciences
- Energy and Power
- Defense and Security
- Agriculture
- Others
- By Geography
- North America
- United States
- Canada
- Mexico
- Europe
- Germany
- United Kingdom
- France
- Nordics
- Rest of Europe
- South America
- Brazil
- Rest of South America
- Asia-Pacific
- China
- Japan
- India
- South-East Asia
- Rest of Asia-Pacific
- Middle East and Africa
- Middle East
- Gulf Cooperation Council Countries
- Turkey
- Rest of Middle East
- Africa
- South Africa
- Rest of Africa
- Middle East
- North America
Geography Analysis
Asia-Pacific maintains leadership with 37.85% of 2025 revenue due to vertically integrated panel makers and deliberate national R&D funding. Samsung Display's USD 10.9 billion conversion to QD-OLED lines and South Korea's KRW 491 billion quantum program cement the ecosystem, while China's BOE invests USD 9 billion in Gen-8.6 capacity that anchors local supply chains. Japan complements manufacturing heft with process innovation, hosting seminars to solve toxicity and durability bottlenecks. The quantum dots market size in Asia remains underpinned by domestic demand for premium TVs and by export flows into North America and Europe.
North America follows with deep research assets at University of Cambridge (Cambridge-US collaborations), MIT Lincoln Laboratory, and Los Alamos National Laboratory driving quantum-secure links and high-efficiency photovoltaics. Venture capital traction is robust, proven by UbiQD's USD 20 million raise and IonQ's headline acquisitions. Strong IP protection and federal funding ensure commercialization pipelines, and US export-control scrutiny over cadmium compounds nudges suppliers toward indium-phosphide builds. Europe leverages regulatory influence: RoHS compliance sparks cadmium-free adoption, while University of Liege's aqueous syntheses cut hazardous waste. Government green-deal funds deploy quantum-dot window films for energy-positive buildings.
The Middle East and Africa record the fastest 10.18% CAGR. UAE's Norma Center, Qatar's USD 10 million program, and Saudi R&D funds foster quantum-dot computing clusters, aiming to diversify oil economies. Import substitution policies encourage local assembly of QD-enhanced solar panels and medical devices. Latin America sees nascent demand in agrotechnology, where quantum-dot greenhouse sheets improve fruit yield in high-altitude farms, yet market penetration remains under 3%. Overall, geographic revenue dispersion reduces concentration risk: Asia's share inches lower toward 35% by 2030 as Middle East and Africa capture investment flows and as Western regions on-shore critical materials processing.
- Samsung Electronics Co., Ltd.
- Nanosys Inc.
- LG Display Co., Ltd.
- BOE Technology Group Co., Ltd.
- Nanoco Group PLC
- Quantum Materials Corporation
- UbiQD, Inc.
- Ocean NanoTech LLC
- Thermo Fisher Scientific Inc.
- Merck KGaA
- Avantama AG
- Quantum Solutions Inc.
- QD Laser, Inc.
- OSRAM Licht AG
- Sony Corporation
- TCL CSOT
- Crystalplex Corporation
- Evident Technologies
- NN-Labs (NNCrystal US Corp.)
- Nanophotonica Inc.
- Quantum Science Ltd.
- Toray Industries, Inc.
Additional Benefits:
- The market estimate (ME) sheet in Excel format
- 3 months of analyst support
TABLE OF CONTENTS
1 INTRODUCTION
- 1.1 Study Assumptions and Market Definition
- 1.2 Scope of the Study
2 RESEARCH METHODOLOGY
3 EXECUTIVE SUMMARY
4 MARKET LANDSCAPE
- 4.1 Market Overview
- 4.2 Market Drivers
- 4.2.1 Quantum Dot Adoption in Ultra-High-Definition Television Panels, Led by China
- 4.2.2 Regulatory Push for Cadmium-Free Quantum Dots in EU Consumer Electronics
- 4.2.3 Rapid Commercialization of Perovskite Quantum Dots in Display Back-Lighting
- 4.2.4 Surge in Quantum Dot-Based Bio-Imaging Agents in Healthcare Applications
- 4.2.5 Government-Funded Quantum-Materials R&D Programs in South Korea
- 4.3 Market Restraints
- 4.3.1 Supply-Chain Bottlenecks for High-Purity Indium-Phosphide Precursors
- 4.3.2 Performance Degradation of Perovskite QDs Under Moisture Exposure
- 4.3.3 Environmental-Compliance Costs of Cadmium Regulations in Europe
- 4.3.4 Limited Mass-Manufacturing Infrastructure for QD Micro-LED Integration
- 4.4 Industry Ecosystem Analysis
- 4.5 Technological Outlook (Production Technology)
- 4.6 Porter's Five Forces Analysis
- 4.6.1 Bargaining Power of Suppliers
- 4.6.2 Bargaining Power of Buyers
- 4.6.3 Threat of New Entrants
- 4.6.4 Threat of Substitutes
- 4.6.5 Degree of Competition
- 4.7 Investment Analysis
5 MARKET SIZE AND GROWTH FORECASTS (VALUES)
- 5.1 By Material Type
- 5.1.1 Cadmium-based II-VI (CdSe, CdS, CdTe)
- 5.1.2 Cadmium-Free III-V (InP, GaAs)
- 5.1.3 Perovskite Quantum Dots
- 5.1.4 Silicon Quantum Dots
- 5.1.5 Graphene and Carbon Quantum Dots
- 5.2 By Device Form Factor
- 5.2.1 QD Films
- 5.2.2 On-Chip Quantum Dots
- 5.2.3 Core-Shell and In-Shell Architectures
- 5.3 By Application
- 5.3.1 Displays
- 5.3.1.1 QD-LCD
- 5.3.1.2 QD-OLED
- 5.3.1.3 Micro-LED Integration
- 5.3.2 Lighting
- 5.3.2.1 General Illumination
- 5.3.2.2 Specialty Lighting
- 5.3.3 Solar Cells and Photovoltaics
- 5.3.4 Medical Imaging and Diagnostics
- 5.3.5 Drug Delivery and Theranostics
- 5.3.6 Sensors and Instruments
- 5.3.7 Quantum Computing and Security
- 5.3.8 Agriculture and Food
- 5.3.9 Others
- 5.3.1 Displays
- 5.4 By End-Use Industry
- 5.4.1 Consumer Electronics
- 5.4.2 Healthcare and Life Sciences
- 5.4.3 Energy and Power
- 5.4.4 Defense and Security
- 5.4.5 Agriculture
- 5.4.6 Others
- 5.5 By Geography
- 5.5.1 North America
- 5.5.1.1 United States
- 5.5.1.2 Canada
- 5.5.1.3 Mexico
- 5.5.2 Europe
- 5.5.2.1 Germany
- 5.5.2.2 United Kingdom
- 5.5.2.3 France
- 5.5.2.4 Nordics
- 5.5.2.5 Rest of Europe
- 5.5.3 South America
- 5.5.3.1 Brazil
- 5.5.3.2 Rest of South America
- 5.5.4 Asia-Pacific
- 5.5.4.1 China
- 5.5.4.2 Japan
- 5.5.4.3 India
- 5.5.4.4 South-East Asia
- 5.5.4.5 Rest of Asia-Pacific
- 5.5.5 Middle East and Africa
- 5.5.5.1 Middle East
- 5.5.5.1.1 Gulf Cooperation Council Countries
- 5.5.5.1.2 Turkey
- 5.5.5.1.3 Rest of Middle East
- 5.5.5.2 Africa
- 5.5.5.2.1 South Africa
- 5.5.5.2.2 Rest of Africa
- 5.5.5.1 Middle East
- 5.5.1 North America
6 COMPETITIVE LANDSCAPE
- 6.1 Market Concentration
- 6.2 Strategic Moves
- 6.3 Market Share Analysis
- 6.4 Company Profiles (includes Global level Overview, Market level overview, Core Segments, Financials as available, Strategic Information, Market Rank/Share for key companies, Products and Services, and Recent Developments)
- 6.4.1 Samsung Electronics Co., Ltd.
- 6.4.2 Nanosys Inc.
- 6.4.3 LG Display Co., Ltd.
- 6.4.4 BOE Technology Group Co., Ltd.
- 6.4.5 Nanoco Group PLC
- 6.4.6 Quantum Materials Corporation
- 6.4.7 UbiQD, Inc.
- 6.4.8 Ocean NanoTech LLC
- 6.4.9 Thermo Fisher Scientific Inc.
- 6.4.10 Merck KGaA
- 6.4.11 Avantama AG
- 6.4.12 Quantum Solutions Inc.
- 6.4.13 QD Laser, Inc.
- 6.4.14 OSRAM Licht AG
- 6.4.15 Sony Corporation
- 6.4.16 TCL CSOT
- 6.4.17 Crystalplex Corporation
- 6.4.18 Evident Technologies
- 6.4.19 NN-Labs (NNCrystal US Corp.)
- 6.4.20 Nanophotonica Inc.
- 6.4.21 Quantum Science Ltd.
- 6.4.22 Toray Industries, Inc.
7 MARKET OPPORTUNITIES AND FUTURE OUTLOOK
- 7.1 White-Space and Unmet-Need Assessment