
|
시장보고서
상품코드
2120617
기업 방화벽 : 시장 점유율 분석, 업계 동향 및 통계, 성장 예측(2026-2031년)Enterprise Firewall - Market Share Analysis, Industry Trends & Statistics, Growth Forecasts (2026 - 2031) |
||||||
 Mordor Intelligence
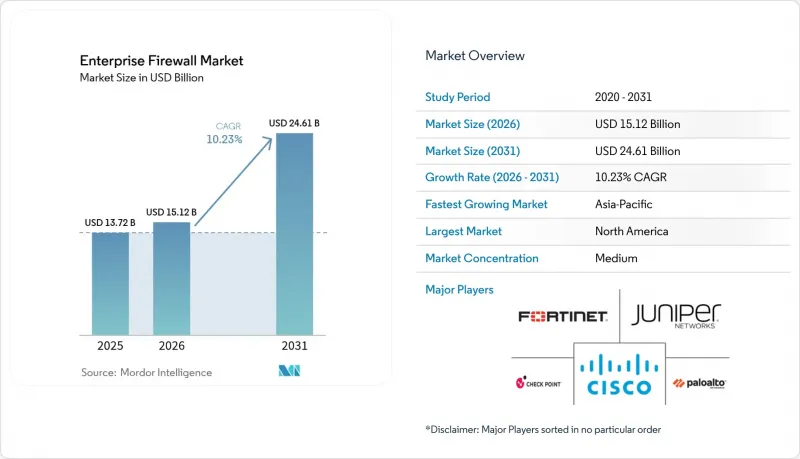
Mordor Intelligence에 의하면, 2026년 기업 방화벽 시장 규모는 151억 2,000만 달러로 추정되고 2025년 137억 2,000만 달러에서 성장하여 2031년에는 246억 1,000만 달러에 이를 것으로 예측됩니다.
2026-2031년 동안의 연평균 성장률(CAGR)은 10.23%가 될 것으로 전망됩니다.
본 보고서는 배포 유형별(On-Premise형 어플라이언스, 클라우드 네이티브 FWaaS, 하이브리드·가상 어플라이언스), 구성 요소별(하드웨어 어플라이언스, 가상 어플라이언스·소프트웨어, 매니지드 서비스 및 전문 서비스),기업 규모별(소규모·영세 기업, 중견 기업, 대기업), 최종 사용자 산업별(은행, 금융서비스 및 보험(BFSI), 헬스케어 및 생명과학, 기타), 지역별로 분류되어 있습니다.
세계의 기업 방화벽 시장 동향 및 인사이트
다중 벡터 공격의 고도화
현재 공격자들은 정상적인 소프트웨어나 AI를 악용하여 단일 공격 캠페인을 통해 엔드포인트, 클라우드 워크로드, 횡방향 채널에 침투하고 있어, 정적인 규칙 세트만으로는 대응할 수 없게 되었습니다. Palo Alto Networks의 조사에 따르면, 2024년 발생한 사고의 86%가 직접적인 사업 중단을 초래했으며, 이로 인해 기업들은 분산된 센서 간 실시간 인텔리전스를 상관 분석하는 차세대 방화벽 도입을 서두르고 있습니다. 한 세계 통신 사업자는 도메인 컨트롤러 외부에 존재하는 200건 이상의 특권 세션을 발견하여, 동서 방향 통신의 사각지대가 얼마나 심각한지 여실히 드러냈습니다. 각 벤더사는 행동상의 이상 징후를 감지하기 위한 머신러닝 기반 검사 기능을 통합하고 있으며, 이를 통해 기업은 의심스러운 트래픽을 밀리초 단위로 격리하고 침입 후 체류 시간을 단축할 수 있게 되었습니다.
하이브리드 및 원격 근무 아키텍처의 급속한 확산
분산형 인력은 가정용 네트워크나 관리 대상 외 기기에 의존하고 있기 때문에 위협의 공격 표면이 데이터센터의 경계를 훨씬 넘어 확대되고 있습니다. 조직들은 단일 클라우드상의 적용 지점 내에서 ID, 기기 무결성, 방화벽 제어를 통합하는 SASE(Secure Access Service Edge) 모델로 전환하고 있습니다. 마이크로소프트는 암호화된 VPN 터널이 기존 검사 방식을 우회하는 경우가 많기 때문에 많은 기업이 사용자가 어디서 접속하든 통일된 정책을 적용할 수 있는 FWaaS(Firewall-as-a-Service)로 전환하고 있다고 지적합니다. 벨 캐나다와 팔로알토 네트웍스의 제휴 등은 통신 사업자가 원격 팀을 위한 관리형 연결에 AI 기반 방화벽을 통합하고 있는 실제 사례를 보여줍니다.
중소기업의 예산 제약
많은 중소기업에는 전담 보안 담당자가 없으며, 제한된 자금을 핵심 업무에 할당해야 하는 상황이라 고도화된 방화벽 도입이 지연되고 있습니다. 현재 사이버 보험사들은 관리형 보안 서비스를 도입한 계약자에게 보험료 할인을 제공하고 있지만, 가격에 민감한 지역에서는 초기 구독 비용이 여전히 도입을 가로막는 요인으로 작용하고 있습니다. 이에 대응하여 각 벤더들은 자동화된 조치 템플릿과 사용량 기반 과금 체계를 갖춘 엔트리 레벨 클라우드 기반 방화벽을 제공함으로써 도입 장벽을 낮추고 있습니다.
부문별 분석
On-Premise형 어플라이언스는 예측 가능한 처리량과 에어 갭 설계에 대한 규제상의 안정감에 힘입어 2025년 기업 방화벽 시장 점유율의 46.58%를 유지했습니다. 매출 기준으로는 프로토콜 전환에 대한 불확실성으로 인해 갱신 주기가 장기화되고 있음에도 불구하고, 이 부문이 기업 방화벽 시장 규모에서 가장 큰 비중을 차지했습니다. 데이터센터에서 지연에 민감한 워크로드를 실행하는 기업들은 고속 TLS 검사를 위한 가속기를 탑재한 전용 하드웨어를 계속해서 선호하고 있습니다.
2031년까지 연평균 성장률(CAGR) 13.68%로 확대될 클라우드 네이티브 FWaaS(Firewall-as-a-Service)는 통합된 정책 관리, 탄력적인 확장성,‘사용량 기반 과금’이라는 경제성을 제공하여 멀티 클라우드 및 원격 근무 전략을 채택하는 기업의 요구에 부응하고 있습니다. 또한 이 모델에서는 공급자가 포털을 통해 지속적인 감사 로그를 제공하므로, 규정 준수 증빙 관리도 간소화됩니다. 가상 어플라이언스는 양자 사이의 가교 역할을 하며, 기업은 하드웨어를 배송할 필요 없이 프라이빗 클라우드나 엣지 거점 간에 규칙 세트를 복제할 수 있으므로, 제로 트러스트로의 전환 과정에서 지점로의 배포가 용이해집니다. 이러한 하이브리드 접근 방식은 구매자가 더 이상 단일 아키텍처를 기본으로 삼지 않고, 워크로드의 위치에 따라 방화벽의 폼 팩터를 결정하고 있는 현 상황을 여실히 드러내고 있습니다.
하드웨어 어플라이언스는 2025년 매출의 47.65%를 차지했으며, 이는 확실한 성능, 하드웨어 기반 암호화 오프로드, 감사 팀의 요구 사항을 충족하는 변조 방지 설계에 대한 꾸준한 수요를 반영합니다. 기업 방화벽 시장 규모에서 이 점유율은 꾸준히 확대될 것으로 예상되지만, 구매자들이 어플라이언스의 잠재력을 극대화하는 라이프사이클 서비스로 예산을 전환함에 따라 그 비율은 점차 감소할 전망입니다.
관리형 서비스와 전문 서비스는 지속적인 튜닝, 위협 피드 통합, 규정 준수 보고와 같은 업무가 많은 사내 팀의 처리 능력을 초과하고 있기 때문에 연평균 성장률(CAGR) 13.52%로 확대될 것으로 예측됩니다. 서비스 제공업체들은 DORA, HIPAA, 산업별 기준에 부합하는 플레이북을 번들로 제공하여, 고객이 평균 대응 시간을 단축하고 규제 당국의 요구 사항을 충족할 수 있도록 지원하고 있습니다. 각 벤더들은 AI 기반 코파일럿을 관리 콘솔에 통합하는 추세가 강해지고 있지만, 이상 현상의 맥락을 파악하고 조치를 변화하는 비즈니스 목표에 부합시키기 위해서는 여전히 인간 전문가가 필수적입니다.
지역별 분석
북미는 엄격한 연방 규제와 높은 정보 유출 대응 비용이 예방적 구매를 촉진하고 있어, 2025년 매출의 35.02%를 차지하며 시장을 주도했습니다. 이 지역의 기업들은 제로 트러스트 아키텍처를 표준화하고, 운영상의 세분화를 해소하기 위해 통합 플랫폼을 선택하는 경향이 강해지고 있습니다. 벨 캐나다와 팔로알토 네트웍스의 제휴는 통신 사업자가 AI 기반 방화벽과 연결성을 결합하여 분산된 직원을 지원하고 있는 실제 사례를 보여줍니다.
아시아태평양은 2031년까지 연평균 성장률(CAGR) 12.38%를 기록하며, 모든 지역 중 가장 높은 성장세가 예상됩니다. 인도, 인도네시아, 일본 정부는 시민 데이터의 국내 검사를 강력히 요구하고 있으며, 각국 고유의 클라우드에 배포 가능한 방화벽 조달을 뒷받침하고 있습니다. 중국의 국내 벤더들은 암호화 규정을 준수하고, 중국어 위협 정보를 처리하는 인라인 머신러닝 모듈을 제공함으로써 시장 점유율을 확대되고 있습니다. 다국적 클라우드 제공업체들은 주권 조항을 충족하면서도 전 세계 텔레메트리 도달 범위를 유지하기 위해 지역 SOC 사업자와의 제휴를 추진하고 있습니다.
유럽에서는 GDPR(EU 개인정보보호규정)과 향후 도입될 DORA 프레임워크를 배경으로 꾸준한 성장세가 유지되고 있습니다. DORA에서는 입증 가능한 세분화와 사고 보고가 의무화되어 있습니다. SonicWall의 새로운 유럽 SOC는 거주지법에 준거한 현지 데이터 처리와 신속한 대응을 제공하기 위한 벤더의 투자를 구현하고 있습니다. 독일과 영국은 산업 스파이 방지에 주력하는 한편, 프랑스와 스페인은 멀티 클라우드 배포를 위한 테넌트별 정책 분리가 가능한 클라우드 방화벽에 투자하고 있습니다.
기타 혜택
- 엑셀 형식 시장 예측(ME) 시트
- 3개월간의 애널리스트 지원
자주 묻는 질문
목차
제1장 서론
제2장 조사 방법
제3장 주요 요약
제4장 시장 구도
제5장 시장 규모 및 성장 예측
제6장 경쟁 구도
제7장 시장 기회 및 향후 동향
KTH 26.09.04According to Mordor Intelligence, the enterprise firewall market size in 2026 is estimated at USD 15.12 billion, growing from 2025 value of USD 13.72 billion with 2031 projections showing USD 24.61 billion, growing at 10.23% CAGR over 2026-2031.
This report is Segmented by Deployment Type (On-Premise Appliance, Cloud-Native Firewall-As-A-Service, and Hybrid/Virtual Appliance), Component (Hardware Appliance, Virtual Appliance/Software, and Managed and Professional Services), Enterprise Size (Small and Micro Enterprises, Mid-Sized Enterprises, and Large Enterprises), End-User Industry (BFSI, Healthcare and Life Sciences, and More), and Geography.
Global Enterprise Firewall Market Trends and Insights
Escalating Sophistication of Multi-Vector Attacks
Attackers now weaponize legitimate software and AI to breach endpoints, cloud workloads, and lateral pathways in one campaign, leaving static rule sets ineffective. Palo Alto Networks observed that 86% of incidents in 2024 caused direct business disruption, prompting enterprises to deploy next-generation firewalls that correlate real-time intelligence across distributed sensors. A global telecom uncovered more than 200 privileged sessions sitting outside domain controllers, underscoring east-west blind spots. Vendors embed machine-learning inspection to flag behavioral anomalies, enabling enterprises to quarantine suspicious traffic within milliseconds and cut dwell time.
Rapid Adoption of Hybrid and Remote Work Architectures
Decentralized workforces rely on home networks and unmanaged devices, expanding the threat surface far beyond data-center perimeters. Organizations shift toward secure access service edge models that fuse identity, device health, and firewall controls inside a single cloud point of enforcement. Microsoft notes that encrypted VPN tunnels often evade traditional inspection, so many firms migrate to Firewall-as-a-Service for uniform policy wherever users connect. Partnerships such as Bell Canada with Palo Alto Networks highlight how carriers wrap AI-powered firewalls around managed connectivity for remote teams.
Budget Constraints Among SMBs
Many small firms lack full-time security personnel and face pressure to allocate limited capital to core operations, slowing the adoption of advanced firewalls. Cyber-insurance carriers now offer premium reductions to policyholders that deploy managed security services, but up-front subscription costs still deter buyers in price-sensitive regions. Vendors respond with entry-level cloud firewalls that include automated policy templates and usage-based billing, lowering procurement hurdles.
Other drivers and restraints analyzed in the detailed report include:
- Regulatory Mandates for Zero-Trust and Segmentation
- Cloud Workload Proliferation Requiring East-West Security
- Skills Shortage to Manage Complex Policies
For complete list of drivers and restraints, kindly check the Table Of Contents.
Segment Analysis
On-premise appliances retained 46.58% of the 2025 enterprise firewall market share on the back of predictable throughput and regulatory comfort with air-gapped designs. In revenue terms, the segment accounted for the largest slice of the enterprise firewall market size, even as refresh cycles extend because of protocol migration uncertainty. Enterprises running latency-sensitive workloads in data centers continue to favor purpose-built hardware that embeds accelerators for high-speed TLS inspection.
Cloud-native Firewall-as-a-Service, advancing at a 13.68% CAGR through 2031, brings centralized policy, elastic scale, and pay-as-you-grow economics that resonate with firms embracing multicloud and remote work strategies. The model also simplifies compliance evidence because providers surface continuous audit logs via portals. Virtual appliances sit between both worlds, letting enterprises replicate rule sets across private clouds and edge locations without shipping hardware, which eases branch rollouts during zero-trust transitions. The blended approach underlines how buyers now map firewall form factor to workload locality rather than defaulting to a single architecture.
Hardware appliances captured 47.65% of 2025 revenues, reflecting persistent demand for deterministic performance, hardware encryption offload, and tamper-resistant designs that satisfy audit teams. This slice of the enterprise firewall market size is expected to grow steadily, yet its proportion declines as buyers shift budget toward lifecycle services that unlock the appliance's full potential.
Managed and professional services are forecast to expand at 13.52% CAGR because continuous tuning, threat-feed integration, and compliance reporting outstrip many in-house teams' bandwidth. Service providers bundle playbooks for DORA, HIPAA, and sector-specific standards, helping clients cut mean-time-to-respond and satisfy regulators. Vendors increasingly embed AI-driven copilots into management consoles, yet human specialists remain essential for contextualising anomalies and aligning policies with evolving business objectives.
Complete Report Scope:
- By Deployment Type
- On-Premise Appliance
- Cloud-Native Firewall-as-a-Service (FWaaS)
- Hybrid/Virtual Appliance
- By Component
- Hardware Appliance
- Virtual Appliance/Software
- Managed and Professional Services
- By Enterprise Size
- Small and Micro Enterprises ( <100 employees )
- Mid-sized Enterprises (100-999)
- Large Enterprises (>=1,000)
- By End-user Industry
- BFSI
- Healthcare and Life Sciences
- Manufacturing and Industrial
- Government and Defense
- Retail and E-commerce
- Telecom and Media
- Education and Research
- Energy and Utilities
- Other End-user Industries
- By Geography
- North America
- United States
- Canada
- Mexico
- South America
- Brazil
- Argentina
- Chile
- Rest of South America
- Europe
- Germany
- United Kingdom
- France
- Italy
- Spain
- Russia
- Rest of Europe
- Asia-Pacific
- China
- India
- Japan
- South Korea
- Singapore
- Malaysia
- Australia
- Rest of Asia-Pacific
- Middle East and Africa
- Middle East
- United Arab Emirates
- Saudi Arabia
- Turkey
- Rest of Middle East
- Africa
- South Africa
- Nigeria
- Egypt
- Rest of Africa
- Middle East
- North America
Geography Analysis
North America led with 35.02% of 2025 revenues, anchored by strict federal rules and high breach remediation costs that spur proactive purchasing. Enterprises there standardize on zero-trust architectures and increasingly choose consolidated platforms to cut operational fragments. Bell Canada's alliance with Palo Alto Networks shows how telcos bundle AI-driven firewalls with connectivity to serve a dispersed workforce.
Asia-Pacific is set for a 12.38% CAGR through 2031, the fastest across regions. Governments in India, Indonesia, and Japan press for local inspection of citizen data, encouraging procurement of firewalls deployable in country-specific clouds. Domestic vendors in China gain share by aligning with encryption rules and supplying inline machine-learning modules that process Mandarin threat intel. Multinational cloud providers partner with regional SOC operators to satisfy sovereignty clauses while maintaining global telemetry reach.
Europe maintains steady momentum on GDPR and the upcoming DORA framework, which requires demonstrable segmentation and incident reporting. SonicWall's new European SOC exemplifies vendor investment to provide local data handling and rapid response aligned with residency laws. Germany and the United Kingdom focus on industrial espionage defenses, whereas France and Spain invest in cloud firewalls capable of per-tenant policy isolation for multicloud expansion.
- Fortinet, Inc.
- Palo Alto Networks, Inc.
- Check Point Software Technologies Ltd.
- Cisco Systems, Inc.
- Juniper Networks, Inc.
- Sophos Ltd.
- WatchGuard Technologies, Inc.
- SonicWall LLC
- Forcepoint LLC
- Barracuda Networks, Inc.
- Hillstone Networks Co., Ltd.
- Stormshield SAS
- AhnLab, Inc.
- Clavister AB
- Untangle, Inc.
- GajShield Infotech (India) Pvt. Ltd.
- F-Secure Corp.
- OPNsense (Deciso B.V.)
- Gateworks Corp.
- Sangfor Technologies Inc.
- Huawei Technologies Co., Ltd.
- Hillstone Networks
- Array Networks, Inc.
- Stonesoft Oy (a McAfee company)
- Netgate (ESF)
Additional Benefits:
- The market estimate (ME) sheet in Excel format
- 3 months of analyst support
TABLE OF CONTENTS
1 INTRODUCTION
- 1.1 Study Assumptions and Market Definition
- 1.2 Scope of the Study
2 RESEARCH METHODOLOGY
3 EXECUTIVE SUMMARY
4 MARKET LANDSCAPE
- 4.1 Market Overview
- 4.2 Market Drivers
- 4.2.1 Escalating sophistication of multi-vector cyber-attacks
- 4.2.2 Rapid adoption of hybrid/remote work architectures
- 4.2.3 Regulatory mandates for zero-trust and segmentation
- 4.2.4 Cloud workload proliferation requiring east-west security
- 4.2.5 AI-driven polymorphic malware forcing adaptive firewalls
- 4.2.6 Sovereign traffic-inspection clauses in emerging economies
- 4.3 Market Restraints
- 4.3.1 Budget constraints among SMBs
- 4.3.2 Skills shortage to manage complex policies
- 4.3.3 IPv6 transition delaying hardware refresh cycles
- 4.3.4 Data-residency-driven shift to regional cloud SOCs
- 4.4 Industry Value Chain Analysis
- 4.5 Regulatory Landscape
- 4.6 Technological Outlook
- 4.7 Industry Attractiveness - Porter's Five Forces Analysis
- 4.7.1 Threat of New Entrants
- 4.7.2 Bargaining Power of Buyers
- 4.7.3 Bargaining Power of Suppliers
- 4.7.4 Threat of Substitutes
- 4.7.5 Intensity of Competitive Rivalry
- 4.8 Impact of Macroeconomic Factors on the Market
5 MARKET SIZE AND GROWTH FORECASTS (VALUES)
- 5.1 By Deployment Type
- 5.1.1 On-Premise Appliance
- 5.1.2 Cloud-Native Firewall-as-a-Service (FWaaS)
- 5.1.3 Hybrid/Virtual Appliance
- 5.2 By Component
- 5.2.1 Hardware Appliance
- 5.2.2 Virtual Appliance/Software
- 5.2.3 Managed and Professional Services
- 5.3 By Enterprise Size
- 5.3.1 Small and Micro Enterprises ( <100 employees )
- 5.3.2 Mid-sized Enterprises (100-999)
- 5.3.3 Large Enterprises (>=1,000)
- 5.4 By End-user Industry
- 5.4.1 BFSI
- 5.4.2 Healthcare and Life Sciences
- 5.4.3 Manufacturing and Industrial
- 5.4.4 Government and Defense
- 5.4.5 Retail and E-commerce
- 5.4.6 Telecom and Media
- 5.4.7 Education and Research
- 5.4.8 Energy and Utilities
- 5.4.9 Other End-user Industries
- 5.5 By Geography
- 5.5.1 North America
- 5.5.1.1 United States
- 5.5.1.2 Canada
- 5.5.1.3 Mexico
- 5.5.2 South America
- 5.5.2.1 Brazil
- 5.5.2.2 Argentina
- 5.5.2.3 Chile
- 5.5.2.4 Rest of South America
- 5.5.3 Europe
- 5.5.3.1 Germany
- 5.5.3.2 United Kingdom
- 5.5.3.3 France
- 5.5.3.4 Italy
- 5.5.3.5 Spain
- 5.5.3.6 Russia
- 5.5.3.7 Rest of Europe
- 5.5.4 Asia-Pacific
- 5.5.4.1 China
- 5.5.4.2 India
- 5.5.4.3 Japan
- 5.5.4.4 South Korea
- 5.5.4.5 Singapore
- 5.5.4.6 Malaysia
- 5.5.4.7 Australia
- 5.5.4.8 Rest of Asia-Pacific
- 5.5.5 Middle East and Africa
- 5.5.5.1 Middle East
- 5.5.5.1.1 United Arab Emirates
- 5.5.5.1.2 Saudi Arabia
- 5.5.5.1.3 Turkey
- 5.5.5.1.4 Rest of Middle East
- 5.5.5.2 Africa
- 5.5.5.2.1 South Africa
- 5.5.5.2.2 Nigeria
- 5.5.5.2.3 Egypt
- 5.5.5.2.4 Rest of Africa
- 5.5.5.1 Middle East
- 5.5.1 North America
6 COMPETITIVE LANDSCAPE
- 6.1 Market Concentration
- 6.2 Strategic Moves
- 6.3 Market Share Analysis
- 6.4 Company Profiles (includes Global level Overview, Market level overview, Core Segments, Financials as available, Strategic Information, Market Rank/Share for key companies, Products and Services, and Recent Developments)
- 6.4.1 Fortinet, Inc.
- 6.4.2 Palo Alto Networks, Inc.
- 6.4.3 Check Point Software Technologies Ltd.
- 6.4.4 Cisco Systems, Inc.
- 6.4.5 Juniper Networks, Inc.
- 6.4.6 Sophos Ltd.
- 6.4.7 WatchGuard Technologies, Inc.
- 6.4.8 SonicWall LLC
- 6.4.9 Forcepoint LLC
- 6.4.10 Barracuda Networks, Inc.
- 6.4.11 Hillstone Networks Co., Ltd.
- 6.4.12 Stormshield SAS
- 6.4.13 AhnLab, Inc.
- 6.4.14 Clavister AB
- 6.4.15 Untangle, Inc.
- 6.4.16 GajShield Infotech (India) Pvt. Ltd.
- 6.4.17 F-Secure Corp.
- 6.4.18 OPNsense (Deciso B.V.)
- 6.4.19 Gateworks Corp.
- 6.4.20 Sangfor Technologies Inc.
- 6.4.21 Huawei Technologies Co., Ltd.
- 6.4.22 Hillstone Networks
- 6.4.23 Array Networks, Inc.
- 6.4.24 Stonesoft Oy (a McAfee company)
- 6.4.25 Netgate (ESF)
7 MARKET OPPORTUNITIES AND FUTURE TRENDS
- 7.1 White-Space and Unmet-Need Assessment