

|
시장보고서
상품코드
2120728
2차 전지 : 시장 점유율 분석, 업계 동향과 통계, 성장 예측(2026-2031년)Secondary Battery - Market Share Analysis, Industry Trends & Statistics, Growth Forecasts (2026 - 2031) |
||||||
 Mordor Intelligence
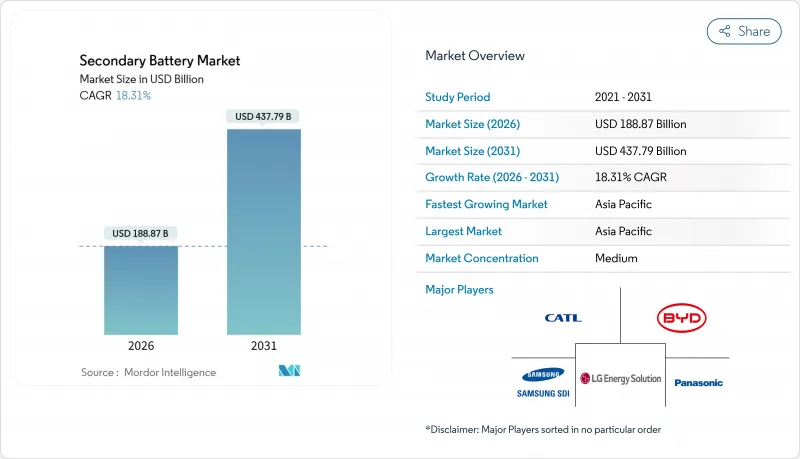
Mordor Intelligence에 따르면 2차 전지 시장 규모는 2026년에 1,888억 7,000만 달러로 추정되며, 예측 기간(2026-2031년) 동안 CAGR 18.31%를 기록하며 2031년에는 4,377억 9,000만 달러에 달할 것으로 전망됩니다.
본 보고서는 기술별(납축배터리, 리튬이온 배터리, 니켈카드뮴전지, 니켈수소전지, 플로우 전지, 전고체 배터리), 형태별(원통형, 각형, 파우치형), 용도(전기자동차, 고정형 에너지 저장 등), 최종사용자(자동차, 공공사업·전력, 전자·IT 등), 및 지역(북미, 유럽, 아시아태평양, 남미 등)별로 분류되어 있습니다.
세계 2차 전지 시장의 동향과 인사이트
전기자동차(EV) 보급 확대가 리튬이온 배터리 수요를 견인
2024년 전기자동차 판매 대수는 1,390만 대에 달하며, 이는 전 세계 승용차 판매 대수의 16%에 해당합니다. 업계 분석가들은 2026년까지 그 점유율이 25%를 넘어설 것으로 예측하고 있습니다. 자동차 제조사들은 이미 2027년 배터리 셀 생산능력의 약 3분의 2를 확보하는 공급 계약을 체결한 상태이며, 공급이 부족해지고 있습니다. 중국에서는 2024년 국내 전기자동차 보급률이 38%를 넘어섰으며, 비용적인 요인으로 인해 대중차용으로는 LFP 계열 화학 조성으로의 전환이 가속화되고 있습니다. 현대자동차의 E-GMP 등 800V 아키텍처를 채택한 플랫폼에서는 더 높은 에너지 밀도가 요구되고 있으며, 이로 인해 공급업체들은 실리콘이 풍부한 음극재와 고니켈 양극재로 전환해야 하는 상황에 직면해 있습니다. 이러한 화학 조성의 변화로 인해 셀 제조사들은 생산 주기 도중에 생산 라인을 재구축할 수밖에 없게 되었으며, 생산량이 증가하고 있음에도 불구하고 이익률은 압박받고 있습니다.
재생에너지와 통합된 에너지 저장 프로젝트의 성장
2024년, 전 세계 전력 회사를 대상으로 한 배터리 저장 설비의 도입량은 45GW에 달했으며, 2026년까지 120GW에 이를 것으로 전망됩니다. 캘리포니아주는 2026년까지 11.5GW의 저장 설비 설치를 의무화하고 있으며, 텍사스주에서도 10GW 규모의 프로젝트가 계획되고 있어, 4시간 가동형 리튬이온 시스템은 가스 발전에 의한 피크 대응 전원을 대체할 비용 대비 효과가 높은 대안이 되고 있습니다. 부대 서비스 시장에서는 주파수 조절에 대해 1MW·h당 15-25달러가 지급되고 있으며, 프로젝트 수익률은 20%에 육박하고 있습니다. 유럽의 ‘REPowerEU’ 자금 지원으로 입찰 건수는 증가하고 있지만, 인허가 절차 지연으로 인해 2024년 입찰 안건의 40%가 이듬해 이후로 이월되었습니다. 따라서 건설 준비가 완료된 부지를 보유한 개발사는 이 미처리 안건을 확실하게 확보할 수 있는 유리한 위치에 있습니다.
중요 광물의 공급 제약
배터리용 리튬 수요는 2024년에 62만 톤(LCE)에 달할 전망이며, 2030년까지 두 배로 증가할 가능성이 있습니다. 그러나 신규 광산 인가에는 2년 가까이 지연이 발생하고 있습니다. 코발트 공급은 여전히 콩고 민주 공화국에 집중되어 있으며, 해당 국가에서의 소규모 채굴에 의한 생산은 ESG 리스크를 초래하기 때문에 자동차 제조사들은 하위 공급업체에 대한 감사를 실시할 수밖에 없습니다. 니켈 황산염 가격은 인도네시아의 공급 불안과 탄소 집약도에 대한 면밀한 검토를 배경으로 2024년 초 톤당 2만 2,000달러까지 급등하여 장기 계약의 가격 책정을 복잡하게 만들고 있습니다. 용액 야금법을 통한 회수 과정에서는 여전히 리튬의 약 10%가 손실되므로, 2030년까지 재활용이 음극 금속 수요의 고작 10-12%만 충당할 가능성이 있습니다.
부문별 분석
2025년, 리튬이온 배터리는 2차 전지 시장 점유율의 74.8%를 차지했습니다. 그러나 도요타, 삼성SDI, QuantumScape가 파일럿 라인을 확대함에 따라, 전고체 배터리는 2031년까지 연평균 성장률(CAGR) 24.9%를 기록할 것으로 예측됩니다. 전고체 구조에서는 액체 전해질을 세라믹 분리막으로 대체함으로써 리튬 금속 음극을 구현할 수 있게 되어, 에너지 밀도를 400-500 Wh/kg으로 두 배로 높일 수 있습니다. 도요타는 황화물 계열 배터리에서 80%의 용량 유지율로 1,200사이클의 실적을 보고했으며, 2027년까지 연간 1만 대를 생산할 계획입니다. 퀀텀스케이프(QuantumScape)사의 산화물 분리막은 800사이클 시험에서 용량 저하율 10% 미만을 달성하여, 2028년형 플랫폼을 위한 폭스바겐(Volkswagen)사에 대한 공급을 확보했습니다.
상업적 실현 가능성은 제조 수율과 원자재 확보 가능성, 특히 황화물 분말의 공급 상황에 달려 있습니다. 기존 공급업체들은 기존 생산 라인을 지속적으로 확장하는 동시에, 고체 배터리 관련 지적 재산권을 라이선싱함으로써 위험을 분산하고 있습니다. 납축배터리는 초기 비용이 저렴하기 때문에 지게차나 통신 시설에서 여전히 사용되고 있지만, 그 점유율은 해마다 감소하고 있습니다. 흐름형 배터리는 수 시간에 걸친 계통연계용 축전에서 연평균 성장률(CAGR) 19%로 성장하고 있지만, 설비 투자 비용이 높기 때문에 2차 전지 시장 규모에서 차지하는 비중은 여전히 1% 미만에 그치고 있습니다.
2025년에는 테슬라의 ‘4680’과 널리 보급된 ‘2170’ 셀에 힘입어 원통형 배터리가 53.5%의 점유율로 2차 전지 시장을 주도했습니다. 그러나 자동차 제조사들이 차량 실내 공간을 최대한 활용하기 위해 얇은 형태의 배터리 팩을 요구하는 가운데, 파우치형 배터리는 2031년까지 연평균 성장률(CAGR) 22.2%로 확대될 것으로 예측됩니다. 제너럴 모터스(GM)는 자사의 ‘울티움(Ultium)’ 플랫폼에 LG제 파우치형 셀을 채택하고 있으며, 층을 수직으로 쌓아 올림으로써 팩당 200kWh의 전력을 공급하고 있습니다. 현대자동차의 ‘E-GMP’ 역시 파우치형 설계를 선호하며, 350kW 급속 충전 시에도 열을 보다 균일하게 방산할 수 있습니다.
제조 동향은 지역에 따라 다릅니다. 중국 제조사들은 자동화의 이점을 활용해 프리즘형 셀을 선호하고 있으며, 유럽의 스타트업 기업들은 프리미엄 전기자동차용으로 대형 파우치형 셀을 시험적으로 도입하고 있고, 미국 기업들은 IRA(인플레이션 억제법)의 국내 조달 요건을 충족하기 위해 원통형과 파우치형의 생산 균형을 맞추고 있습니다. 따라서 셀 형상을 둘러싼 경쟁은 획일적인 설계라기보다는 각 기업의 전략적 위치를 반영한다고 할 수 있습니다.
지역별 분석
아시아태평양은 2025년에 49.7%의 점유율로 2차 전지 시장을 독점하고 있으며, 연평균 성장률(CAGR) 20.1%로 확대될 것으로 예측됩니다. 중국의 1,200 GWh 셀 생산능력은 완전한 수직 통합을 통해 최대 20%의 비용 우위를 가져다주고 있습니다. 한국의 공급업체들은 고급 전기자동차(EV) 부문에서 가격 프리미엄을 얻을 수 있는 고니켈계 화학 조성에 주력하고 있습니다. 일본의 파나소닉은 중국 경쟁사들의 가격 경쟁으로 시장 점유율이 18%까지 하락했으나, 테슬라와의 견고한 제휴 관계를 유지하고 있습니다.
북미에서는 ‘인플레이션 억제법(Inflation Reduction Act)’에 따라 공급망의 급속한 국내 회귀가 진행되고 있습니다. 1kWh당 35달러의 제조 세액 공제로 인해 730억 달러 규모의 투자가 발표되었으며, 2030년까지 계획 생산능력은 550GWh에 달할 전망입니다. 제너럴 모터스, 포드, 스텔란티스는 물류 비용을 최소화하기 위해 모두 배터리 공장과 차량 조립 라인을 동일한 부지 내에 배치하고 있습니다. 캐나다는 원자재 허브로서의 입지를 확립하려 하고 있으며, 멕시코는 비용 중심의 조립 계약을 확보하고 있지만, 인력 부족과 인허가 절차 지연이 여전히 제약요인으로 작용하고 있습니다.
유럽은 2035년 내연기관 차량 판매 금지 및 엄격한 탄소발자국 규제의 영향으로 2025년에는 세계 수요의 4분의 1에 조금 못 미치는 비중을 차지했습니다. 노스볼트의 스웨덴 공장은 kWh당 60kg 미만의 CO2 배출량을 실현하는 배터리 셀로 프리미엄 OEM의 요구를 충족시키고 있습니다. 독일에서는 BASF의 양극재부터 폭스바겐의 PowerCo 전지 라인에 이르기까지 완벽한 생태계가 가동되고 있습니다. 남유럽 및 동유럽은 낮은 인건비와 EU 구조기금을 바탕으로 새로운 기가팩토리를 유치하고 있습니다. 남미의 리튬 트라이앵글은 장기적인 자원 안정 공급을 약속하고 있지만, 물 부족과 정치적 리스크로 인해 확장이 지연되고 있습니다. 중동 및 아프리카는 여전히 발전 단계에 있으며, 시장 점유율은 한 자릿수 초반에 머물러 있습니다.
기타 혜택:
- 엑셀 형식의 시장 예측(ME) 시트
- 3개월간의 애널리스트 지원
자주 묻는 질문
목차
제1장 소개
제2장 조사 방법
제3장 주요 요약
제4장 시장 구도
제5장 시장 규모와 성장 예측
제6장 경쟁 구도
제7장 시장 기회와 향후 전망
KSM 26.09.02According to Mordor Intelligence, the secondary battery market size is estimated at USD 188.87 billion in 2026, and is expected to reach USD 437.79 billion by 2031, at a CAGR of 18.31% during the forecast period (2026-2031).
This report is Segmented by Technology (Lead-Acid, Lithium-Ion, Nickel-Cadmium, Nickel-Metal Hydride, Flow Batteries, and Solid-State), Form Factor (Cylindrical, Prismatic, and Pouch), Application (Electric Vehicles, Stationary Energy Storage, and More), End-User (Automotive, Utilities and Power, Electronics and IT, and More), and Geography (North America, Europe, Asia-Pacific, South America, and More).
Global Secondary Battery Market Trends and Insights
Surging EV Adoption Boosts Li-ion Demand
EV sales reached 13.9 million units in 2024, equal to 16% of global passenger car sales, and industry trackers expect the share to exceed 25% by 2026 . Automakers already have offtake contracts that lock in roughly two-thirds of 2027 cell capacity, tightening supply. China crossed 38% domestic EV penetration in 2024, reinforcing a cost-driven shift toward LFP chemistries for mass-market cars. Platforms adopting 800-volt architectures, such as Hyundai E-GMP, need higher energy density, which is pushing suppliers toward silicon-rich anodes and high-nickel cathodes. Those chemistry changes force cell makers to retool lines mid-cycle, squeezing margins even as volume rises.
Growth of Renewable-Integrated Storage Projects
Utility-scale battery storage installations climbed to 45 GW worldwide in 2024, with forecasts pointing to 120 GW by 2026. California mandates 11.5 GW of storage by 2026, while Texas has a 10 GW pipeline, making four-hour lithium-ion systems a cost-effective alternative to gas peakers. Ancillary service markets pay USD 15-25 per MW-hour for frequency regulation, supporting project returns near 20%. Europe's REPowerEU funding has accelerated tender volumes, though permitting delays shifted 40% of 2024 bids into later years. Developers with ready-to-build sites are therefore well positioned to capture the backlog.
Critical-Mineral Supply Constraints
Battery-grade lithium demand hit 620,000 tons LCE in 2024 and could double by 2030, yet new mine approvals lag by almost two years. Cobalt remains concentrated in the Democratic Republic of Congo, where artisanal output adds ESG risk that forces automakers to audit sub-tier suppliers. Nickel sulfate prices spiked to USD 22,000 per ton in early 2024 on Indonesian supply questions and carbon-intensity scrutiny, complicating long-term contract pricing. Recycling may cover just 10-12% of cathode metal demand by 2030 because hydrometallurgical recovery still loses around 10% of lithium.
Other drivers and restraints analyzed in the detailed report include:
- Declining Li-ion Cost Curve (Pack < USD 85/kWh)
- Rapid LFP Uptake for Cost and Safety Gains
- Safety and Thermal-Runaway Incidents
For complete list of drivers and restraints, kindly check the Table Of Contents.
Segment Analysis
Lithium-ion held 74.8% of the secondary battery market share in 2025. However, solid-state variants are forecast to post a 24.9% CAGR to 2031 as Toyota, Samsung SDI, and QuantumScape scale pilot lines. The solid-state architecture replaces liquid electrolytes with ceramic separators, enabling lithium-metal anodes that double energy density to 400-500 Wh/kg. Toyota reported 1,200 cycles at 80% retention for its sulfide-based cell and plans 10,000 units annually by 2027. QuantumScape's oxide separator passed 800 cycles with less than 10% fade, securing Volkswagen's supply for 2028 platforms.
Commercial viability hinges on manufacturing yield and raw-material availability, especially for sulfide powders. Incumbent suppliers hedge risk by licensing solid-state IP while continuing to expand conventional lines. Lead-acid batteries still serve forklifts and telecom sites because of low upfront cost, yet their share slips each year. Flow batteries grow at a 19% CAGR for multi-hour grid storage, though their contribution to the secondary battery market size remains under 1% due to high capital cost.
Cylindrical formats led the secondary battery market in 2025 with 53.5% share, underpinned by Tesla's 4680 and ubiquitous 2170 cells. Yet pouch cells are forecast to expand at 22.2% CAGR through 2031 as automakers seek thinner packs that maximize cabin space. General Motors uses LG-made pouch cells in its Ultium platform, stacking layers vertically to deliver 200 kWh per pack. Hyundai's E-GMP also favors pouch designs, which dissipate heat more evenly under 350 kW fast charging.
Manufacturing dynamics differ by region. Chinese producers lean toward prismatic cells for automation gains, European startups trial large-format pouches for premium EVs, and U.S. players balance cylindrical and pouch output to meet IRA domestic-content thresholds. The form-factor battle, therefore, reflects strategic positioning rather than one-size-fits-all design.
Complete Report Scope:
- By Technology
- Lead-acid
- Lithium-ion
- Nickel-metal Hydride
- Nickel-cadmium
- Flow Batteries
- Solid-state (pre-commercial)
- By Form Factor
- Cylindrical
- Prismatic
- Pouch
- By Application
- Electric Vehicles
- Stationary Energy Storage
- Industrial Motive Power
- Consumer Electronics
- Power Tools and Others
- By End-user Industry
- Automotive
- Utilities and Power
- Electronics and IT
- Logistics and Warehousing
- Aerospace and Defense
- Healthcare and Others
- By Geography
- North America
- United States
- Canada
- Mexico
- Europe
- United Kingdom
- Germany
- France
- Spain
- NORDIC Countries
- Russia
- Rest of Europe
- Asia-Pacific
- China
- India
- Japan
- South Korea
- ASEAN Countries
- Australia and New Zealand
- Rest of Asia-Pacific
- South America
- Brazil
- Argentina
- Colombia
- Rest of South America
- Middle East and Africa
- Saudi Arabia
- United Arab Emirates
- South Africa
- Egypt
- Rest of Middle East and Africa
- North America
Geography Analysis
Asia-Pacific dominated the secondary battery market with a 49.7% share in 2025 and is forecast to expand at a 20.1% CAGR. China's 1,200 GWh of cell capacity delivers up to 20% cost advantages through full vertical integration. South Korean suppliers focus on high-nickel chemistries that command price premiums in premium EV segments. Japan's Panasonic has seen its share slide to 18% as Chinese rivals undercut on price, yet it retains a strong foothold with Tesla.
North America is undergoing rapid supply-chain reshoring under the Inflation Reduction Act. Manufacturing tax credits of USD 35 per kWh have triggered USD 73 billion in announced investments, lifting planned capacity to 550 GWh by 2030. General Motors, Ford, and Stellantis all co-locate cell plants with vehicle assembly lines to minimize logistics costs. Canada is positioning itself as a raw-material hub, and Mexico is securing cost-sensitive assembly contracts, though labor shortages and permitting delays remain constraints.
Europe held just under one-quarter of global demand in 2025, driven by its 2035 internal-combustion ban and strict carbon-footprint rules. Northvolt's Swedish facility satisfies premium OEM needs with cells below 60 kg CO2 per kWh. Germany operates a complete ecosystem, from BASF cathode materials to Volkswagen's PowerCo cell lines. Southern and Eastern Europe attract new gigafactories because of lower labor costs and EU structural funds. South America's lithium triangle offers long-term resource security, but water scarcity and political risk slow expansion. The Middle East and Africa remain nascent, accounting for only a low single-digit share.
- CATL
- LG Energy Solution
- Panasonic Holdings
- BYD Co. Ltd
- Samsung SDI
- SK On
- Envision AESC
- Northvolt AB
- Tesla Inc. (Gigafactory)
- GS Yuasa
- Clarios
- EnerSys
- Saft Groupe
- Duracell
- Showa Denko Materials
- Toshiba SCiB
- SVOLT Energy
- CALB
- Farasis Energy
- A123 Systems
- Tianjin Lishen
- VARTA AG
- Hitachi Astemo Battery
- EVE Energy
- Amara Raja
Additional Benefits:
- The market estimate (ME) sheet in Excel format
- 3 months of analyst support
TABLE OF CONTENTS
1 Introduction
- 1.1 Study Assumptions & Market Definition
- 1.2 Scope of the Study
2 Research Methodology
3 Executive Summary
4 Market Landscape
- 4.1 Market Overview
- 4.2 Market Drivers
- 4.2.1 Surging EV adoption boosts Li-ion demand
- 4.2.2 Growth of renewable-integrated storage projects
- 4.2.3 Declining Li-ion cost curve (pack <$85/kWh)
- 4.2.4 Second-life battery repurposing ecosystems
- 4.2.5 Policy-driven localization of gigafactories
- 4.2.6 Rapid LFP uptake for cost & safety advantages
- 4.3 Market Restraints
- 4.3.1 Critical-mineral supply constraints
- 4.3.2 Safety / thermal-runaway incidents
- 4.3.3 End-of-life compliance cost escalation
- 4.3.4 Capital diversion to alternative storage tech
- 4.4 Supply-Chain Analysis
- 4.5 Regulatory Landscape
- 4.6 Technological Outlook
- 4.7 Porter's Five Forces
- 4.7.1 Bargaining Power of Suppliers
- 4.7.2 Bargaining Power of Consumers
- 4.7.3 Threat of New Entrants
- 4.7.4 Threat of Substitute Products & Services
- 4.7.5 Intensity of Competitive Rivalry
- 4.8 Battery & Raw-Material Price Trends
- 4.9 International Trade Statistics
5 Market Size & Growth Forecasts
- 5.1 By Technology
- 5.1.1 Lead-acid
- 5.1.2 Lithium-ion
- 5.1.3 Nickel-metal Hydride
- 5.1.4 Nickel-cadmium
- 5.1.5 Flow Batteries
- 5.1.6 Solid-state (pre-commercial)
- 5.2 By Form Factor
- 5.2.1 Cylindrical
- 5.2.2 Prismatic
- 5.2.3 Pouch
- 5.3 By Application
- 5.3.1 Electric Vehicles
- 5.3.2 Stationary Energy Storage
- 5.3.3 Industrial Motive Power
- 5.3.4 Consumer Electronics
- 5.3.5 Power Tools and Others
- 5.4 By End-user Industry
- 5.4.1 Automotive
- 5.4.2 Utilities and Power
- 5.4.3 Electronics and IT
- 5.4.4 Logistics and Warehousing
- 5.4.5 Aerospace and Defense
- 5.4.6 Healthcare and Others
- 5.5 By Geography
- 5.5.1 North America
- 5.5.1.1 United States
- 5.5.1.2 Canada
- 5.5.1.3 Mexico
- 5.5.2 Europe
- 5.5.2.1 United Kingdom
- 5.5.2.2 Germany
- 5.5.2.3 France
- 5.5.2.4 Spain
- 5.5.2.5 NORDIC Countries
- 5.5.2.6 Russia
- 5.5.2.7 Rest of Europe
- 5.5.3 Asia-Pacific
- 5.5.3.1 China
- 5.5.3.2 India
- 5.5.3.3 Japan
- 5.5.3.4 South Korea
- 5.5.3.5 ASEAN Countries
- 5.5.3.6 Australia and New Zealand
- 5.5.3.7 Rest of Asia-Pacific
- 5.5.4 South America
- 5.5.4.1 Brazil
- 5.5.4.2 Argentina
- 5.5.4.3 Colombia
- 5.5.4.4 Rest of South America
- 5.5.5 Middle East and Africa
- 5.5.5.1 Saudi Arabia
- 5.5.5.2 United Arab Emirates
- 5.5.5.3 South Africa
- 5.5.5.4 Egypt
- 5.5.5.5 Rest of Middle East and Africa
- 5.5.1 North America
6 Competitive Landscape
- 6.1 Market Concentration
- 6.2 Strategic Moves (M&A, Partnerships, PPAs)
- 6.3 Market Share Analysis (Market Rank/Share for key companies)
- 6.4 Company Profiles (includes Global level Overview, Market level overview, Core Segments, Financials as available, Strategic Information, Products & Services, and Recent Developments)
- 6.4.1 CATL
- 6.4.2 LG Energy Solution
- 6.4.3 Panasonic Holdings
- 6.4.4 BYD Co. Ltd
- 6.4.5 Samsung SDI
- 6.4.6 SK On
- 6.4.7 Envision AESC
- 6.4.8 Northvolt AB
- 6.4.9 Tesla Inc. (Gigafactory)
- 6.4.10 GS Yuasa
- 6.4.11 Clarios
- 6.4.12 EnerSys
- 6.4.13 Saft Groupe
- 6.4.14 Duracell
- 6.4.15 Showa Denko Materials
- 6.4.16 Toshiba SCiB
- 6.4.17 SVOLT Energy
- 6.4.18 CALB
- 6.4.19 Farasis Energy
- 6.4.20 A123 Systems
- 6.4.21 Tianjin Lishen
- 6.4.22 VARTA AG
- 6.4.23 Hitachi Astemo Battery
- 6.4.24 EVE Energy
- 6.4.25 Amara Raja
7 Market Opportunities & Future Outlook
- 7.1 White-space & Unmet-need Assessment


