

|
시장보고서
상품코드
2120763
사이버 테러리즘 대응 : 시장 점유율 분석, 업계 동향과 통계, 성장 예측(2026-2031년)Counter Cyberterrorism - Market Share Analysis, Industry Trends & Statistics, Growth Forecasts (2026 - 2031) |
||||||
 Mordor Intelligence
Mordor Intelligence에 의하면, 사이버 테러리즘 대응 시장 규모는 2025년에 338억 7,000만 달러로 평가되었고, 2026년 349억 6,000만 달러에서 2031년까지 409억 4,000만 달러에 이를 것으로 예측되며, 예측 기간(2026년-2031년) CAGR은 3.22%를 기록할 전망입니다.
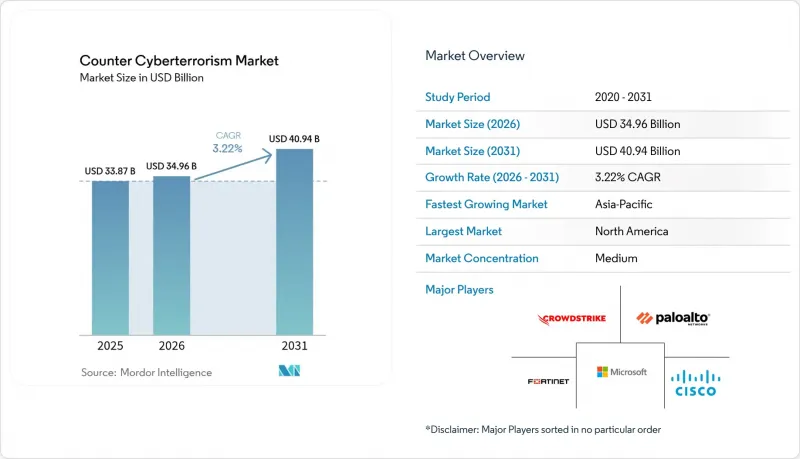
본 보고서는 최종 사용자 산업(방위, 항공우주, BFSI 등), 솔루션 유형(네트워크 보안 솔루션, 엔드포인트 보안 솔루션 등), 도입 형태(On-Premise, 클라우드, 하이브리드 등), 보안 계층(네트워크 계층, 엔드포인트 계층 등), 지역(북미, 남미, 유럽 등)별로 분류되어 있습니다. 시장 예측은 금액(미 달러) 기준으로 제시되어 있습니다.
세계 사이버 테러 대응 시장 동향 및 인사이트
국가 주도의 사이버 공격 증가가 국방 현대화를 촉진
국가가 지원하는 지속적인 공격 캠페인은 현재 다각적인 전술을 사용하여 중요 인프라와 민주적 과정을 표적으로 삼고 있습니다. 미국 국방부는 2025 회계연도 사이버 예산에서 제로 트러스트 및 차세대 암호화에 31억 달러를 배정하여, 사고 대응에서 적극적인 위협 감지로의 전환을 추진하고 있습니다. 미국 사이버사령부의 17억 달러 예산 배분은 반격 태세와 다중 도메인 간 협력을 더욱 우선시하고 있습니다. 이러한 고위급 차원의 집중에 따라 플랫폼 공급업체들은 국가 안보 조달 기준을 충족하는 귀속 식별, 포렌식, 자동화 기능을 통합하도록 촉구받고 있습니다.
AI를 활용한 위협 감지가 보안 운영을 혁신
실전 운영 규모의 AI가 평균 침입 감지 시간을 62분까지 단축하며, 보안 운영 센터의 운영 방식을 변화시키고 있습니다. CrowdStrike와 NVIDIA의 공동 테스트에서는 처리 부하를 절반으로 줄이면서 감지 속도를 2배로 높여, 분석가의 부담을 경감시켰습니다. 적응형 모델은 엔드포인트, 네트워크, 클라우드의 텔레메트리 데이터를 수집하여 공격자의 행동을 예측하지만, 분석가의 근무 시간 중 40%는 여전히 오감지 추적에 소비되고 있습니다. 이에 따라 각 벤더사는 생성형 AI를 통한 정보 강화 및 컨텍스트 기반 우선순위 지정을 정교화하여 신호 대 잡음 비율을 높이고, 제한된 인적 전문 지식을 최대한 활용하고자 하고 있습니다.
Tier 1 사이버 전쟁 인력 부족이 성장을 저해
미국에서만 66만 3,000건의 미충원 직위가 있으며, 이는 임금 프리미엄을 상승시켜 프로젝트 전개를 저해하고 있습니다. 고도의 기술을 습득하려면 5-7년의 실무 경험이 필요하기 때문에 기업들은 이 격차를 메우기 위해 자동화나 MSSP와의 제휴로 방향을 전환하고 있으며, 이로 인해 사내 구축보다 C-as-a-Service(CaaS)형 서비스에 대한 수요가 증가하고 있습니다.
부문 분석
2031년까지 의료 분야의 연평균 성장률(CAGR)은 17.20%로, 모든 부문을 상회하고 있습니다. 한편, 2025년 시점에서 BFSI(은행 및 금융 및 보험)가 사이버 테러 대응 시장 점유율의 가장 큰 부분을 계속 차지하고 있습니다. 일일 사고로 인한 손실은 200만 달러에 달하며, 92%의 의료 제공업체가 표적 공격을 받았다고 보고하고 있어, 예산 제약에도 불구하고 병원들은 제로 트러스트 및 관리형 감지 시스템 도입을 서두르고 있습니다. 8억 달러 상당의 정부 보조금이 자원이 부족한 시설의 방어 체계 현대화를 지원하고 있습니다. BFSI 부문은 규제 감사 및 고가치 데이터에 힘입어 견고한 관리 체계를 유지하고 있는 반면, 방위 및 항공우주 부문의 예산은 기밀 시스템의 요구 사항을 뒷받침하는 기반이 되고 있습니다.
랜섬웨어로 인한 배상금 증가와 환자 안전에 미치는 영향을 배경으로, 이사회는 사이버 보안을 단순한 IT 비용이 아닌 기업 리스크로 인식하고 있습니다. IoT 의료기기와 기존 전자의무기록 시스템이 혼재되면서 복잡성이 증가함에 따라, AI를 활용한 이상 감지 통합에 대한 수요가 높아지고 있습니다. 모든 부문에서 대테러 대책 시장은 각 업계의 규제에 대응하는 맞춤형 서비스 계층을 제공하고 있으며, 업계에 특화된 MSSP가 시장 점유율을 확대하고 있는 이유가 바로 여기에 있습니다.
네트워크 보안 도구는 사이버 테러리즘 대응 시장 규모의 27.10%를 차지하고 있지만, 연평균 성장률(CAGR) 22.80%로 성장을 지속하고, 있는 예측형 AI 솔루션은 경계 방어에서 행동 분석으로의 전략적 전환을 시사하고 있습니다. 원격 근무가 정착되는 가운데, 엔드포인트 제품군은 여전히 필수적이며, 멀티 클라우드 도입에 따라 클라우드 보안도 급증하고 있습니다. 개인정보 보호 규제가 강화됨에 따라 데이터 중심의 통제가 확대되는 한편, 신원 관리 플랫폼은 사용자의 의도와 기기 상태를 모두 평가하는 지속적인 인증 모델로 진화하고 있습니다.
소프트웨어 공급망 공격 증가로 인해 용도 보안 예산이 확대되고 있으며, SBOM 검증 및 DevSecOps 자동화에 대한 수요가 높아지고 있습니다. 각 벤더들은 위협 인텔리전스 피드와 제로 트러스트 오케스트레이션을 융합하여, 도구의 난립을 대폭 줄여주는 통합 콘솔을 구축하고 있습니다. 이는 조달 과정에서 포인트 솔루션의 깊이보다 플랫폼의 폭이 중시되는 가운데, 매력적인 제안으로 떠오르고 있습니다.
지역별 분석
북미는 사이버 테러리즘 대응 시장 규모의 34.80%를 차지하고 있으며, 이는 미국 연방 정부의 275억 달러 규모의 사이버 보안 예산 배정과 연간 300억 달러의 군사 사이버 관련 지출에 힘입은 결과입니다. 캐나다는 ‘미국/캐나다 사이버 행동 계획’을 통해 협력하고 있으며, 멕시코는 3개국 간 협력 체제 하에서 중요 인프라 보호 대책을 가속화하고 있습니다. CMMC나 GLBA와 같은 성숙한 규정 준수 체제가 기업들에게 지속적인 위협 감시를 촉진하고 있으며, 이는 각 부문에 걸친 플랫폼 업데이트를 뒷받침하고 있습니다.
아시아태평양은 주간 공격 건수가 16% 급증하고 사이버 보험 가입률이 50% 증가한 데 각국 정부가 대응하고 있어 13.95%라는 가장 높은 연평균 성장률(CAGR)을 기록하고 있습니다. 중국의 ‘데이터 보안법’과 인도의 CERT-IN에 의한 규제로 보고 의무가 확대되는 한편, 일본은 산업 분야의 사이버 보안 강화에 60억 달러를 투자하고 있습니다. 호주의 ‘2025-2030 사이버 전략’은 주권적 역량 개발을 중시하고 있어, 중견 기업 전반에 걸쳐 MSSP에 대한 수요를 높이고 있습니다.
유럽에서는 GDPR(EU 개인정보보호규정)에 기반한 설명 책임 조치 하에서 시장 점유율을 견조하게 유지하고 있으며, 2024년에는 12억 유로의 벌금이 부과되었습니다. EU의 협력적인 포스트 양자암호화 로드맵은 암호화 기술 개선을 위한 회원국의 보조금을 촉진하고 있으며, 하이브리드 암호화를 제공하는 플랫폼 공급업체에 혜택을 주고 있습니다. 영국의 ‘내셔널 사이버 포스(National Cyber Force)’는 공격 및 방어 임무를 통합하고 있으며, 프랑스는 SecNumCloud 인증을 가속화하고 있고, 독일의 KRITIS-Dachgesetz는 중요 인프라의 적용 범위를 확대하여 통합 보안 조달을 촉진하고 있습니다.
기타 혜택:
- 엑셀 형식 시장 예측(ME) 시트
- 3개월간의 애널리스트 지원
자주 묻는 질문
목차
제1장 서론
제2장 조사 방법
제3장 주요 요약
제4장 시장 구도
제5장 시장 규모와 성장 예측
제6장 경쟁 구도
제7장 시장 기회와 향후 전망
LSH 26.09.08According to Mordor Intelligence, the counter cyberterrorism market size was valued at USD 33.87 billion in 2025 and estimated to grow from USD 34.96 billion in 2026 to reach USD 40.94 billion by 2031, at a CAGR of 3.22% during the forecast period (2026-2031).
This report is Segmented by End-User Industry (Defense, Aerospace, BFSI, and More), Solution Type (Network Security Solutions, Endpoint Security Solutions, and More), Deployment Mode (On-Premise, Cloud, Hybrid, and More), Security Layer (Network Layer, Endpoint Layer, and More), and Geography (North America, South America, Europe, and More). The Market Forecasts are Provided in Terms of Value (USD).
Global Counter Cyberterrorism Market Trends and Insights
Growing Nation-State Cyber Offensives Drive Defense Modernization
Persistent state-backed campaigns now target critical infrastructure and democratic processes with multi-vector tactics. The Pentagon earmarked USD 3.1 billion for zero-trust and next-generation encryption in its 2025 cyber budget, anchoring moves from incident response to active threat-hunting.U.S. Cyber Command's USD 1.7 billion appropriation further prioritizes counteroffensive readiness and multi-domain coordination.Such high-level focus incentivizes platform vendors to embed attribution, forensics, and automation features that satisfy national-security procurement criteria.
AI-Enabled Threat Detection Transforms Security Operations
Production-scale AI now shapes security operating centers as average breakout times shrink to 62 minutes. CrowdStrike-NVIDIA tests halve processing loads while doubling detection speeds, easing analyst fatigue. Adaptive models ingest endpoint, network, and cloud telemetry to predict adversary behavior, yet 40% of analyst hours still chase false positives. Vendors thus refine generative-AI enrichment and context-aware prioritization to boost signal-to-noise ratios and maximize limited human expertise.
Shortage of Tier-1 Cyber Warfare Talent Constrains Growth
The U.S. alone posts 663,000 unfilled roles, inflating wage premiums and throttling project rollouts. With advanced skills requiring 5-7 years of experiential learning, enterprises pivot to automation and MSSP partnerships to bridge gaps, reinforcing demand for C-aa-S offerings over in-house builds.
Other drivers and restraints analyzed in the detailed report include:
- Expansion of 5G/IIoT Attack Surface Creates New Vulnerabilities
- Rise of Cybersecurity-as-a-Service Reshapes Market Dynamics
For complete list of drivers and restraints, kindly check the Table Of Contents.
Segment Analysis
Healthcare's 17.20% CAGR through 2031 outpaces all sectors, even as BFSI retains the largest slice of the counter cyberterrorism market share in 2025. Daily incident losses reached USD 2 million, and 92% of providers reported targeted attacks, pushing hospitals to adopt zero-trust and managed detection despite budget constraints. Government grants worth USD 800 million help low-resourced facilities modernize defenses. BFSI maintains robust controls driven by regulatory audits and high-value data, while defense-aerospace budgets anchor classified-system requirements.
Rising ransomware premiums and patient-safety implications move boards to treat cybersecurity as enterprise risk, not IT overhead. Overlapping IoT medical devices and legacy electronic-health-record systems add complexity, reinforcing integration demand for AI-driven anomaly detection. Across sectors, the counter cyberterrorism market supports bespoke service tiers that map vertical regulations, demonstrating why industry-aligned MSSPs capture expanding wallet share.
Network security tools hold 27.10% of the counter cyberterrorism market size; yet predictive AI solutions registering a 22.80% CAGR signal a strategic tilt from perimeter hardening to behavior analytics. Endpoint suites remain indispensable as remote work persists, and cloud security surges alongside multi-cloud adoption. Data-centric controls grow amid stricter privacy mandates, while identity platforms evolve continuous-auth models assessing both user intent and device posture.
Software-supply-chain attacks elevate application-security budgets, spurring demand for SBOM validation and DevSecOps automation. Vendors fuse threat-intel feeds with zero-trust orchestration, creating unified consoles that slash tool sprawl an attractive proposition as procurement favors platform breadth over point-solution depth.
Complete Report Scope:
- By End-user Industry
- Defense
- Aerospace
- BFSI
- Corporate/Enterprise
- Power and Utilities
- Government and Intelligence Agencies
- Healthcare
- By Solution Type
- Network Security Solutions
- Endpoint Security Solutions
- Cloud Security Solutions
- Application Security
- Data and Database Security
- Identity and Access Management
- Threat Intelligence and MSSP
- By Deployment Mode
- On-premise
- Cloud
- Hybrid
- Managed / Hosted
- By Security Layer
- Network Layer
- Endpoint Layer
- Application Layer
- Data / Cloud Layer
- By Geography
- North America
- United States
- Canada
- Mexico
- South America
- Brazil
- Argentina
- Rest of South America
- Europe
- Germany
- United Kingdom
- France
- Italy
- Spain
- Russia
- Rest of Europe
- Asia-Pacific
- China
- Japan
- India
- South Korea
- Rest of Asia-Pacific
- Middle East and Africa
- Middle East
- Saudi Arabia
- United Arab Emirates
- Turkey
- Israel
- Rest of Middle East
- Africa
- South Africa
- Nigeria
- Rest of Africa
- Middle East
- North America
Geography Analysis
North America anchors 34.80% of the counter cyberterrorism market size, driven by the U.S. federal USD 27.5 billion cybersecurity allocation and USD 30 billion annual military cyber outlays. Canada cooperates through the U.S.-Canada Cyber Action Plan, and Mexico accelerates critical-infrastructure safeguards under trilateral frameworks. Mature compliance regimes such as CMMC and GLBA push enterprises toward continuous threat monitoring, sustaining platform renewals across sectors.
Asia-Pacific records the fastest 13.95% CAGR as governments respond to a 16% jump in weekly attacks and 50% growth in cyber-insurance uptake. China's Data Security Law and India's CERT-IN mandates expand mandatory reporting, while Japan funds USD 6 billion for industrial cyber-fortification. Australia's 2025-2030 Cyber Strategy emphasizes sovereign capability development, amplifying MSSP demand across mid-market enterprises.
Europe holds a steady share under GDPR-driven accountability measures that levied EUR 1.2 billion in 2024 fines. The EU's coordinated post-quantum roadmap catalyzes member-state grants for cryptographic retrofits, benefiting platform vendors offering hybrid encryption. The U.K.'s National Cyber Force merges offense-defense mandates, France accelerates SecNumCloud certifications, and Germany's KRITIS-Dachgesetz expands critical-infrastructure scope, stimulating integrated-security procurement.
- Palo Alto Networks, Inc.
- Cisco Systems, Inc.
- Microsoft Corporation
- Fortinet, Inc.
- International Business Machines Corporation
- AO Kaspersky Lab
- Dell Technologies Inc.
- DXC Technology Company
- International Intelligence Limited
- Nexusguard Limited
- Leidos Holdings, Inc.
- Raytheon Technologies Corporation
- Broadcom Inc. (Symantec Enterprise)
- SAP SE
- CrowdStrike Holdings, Inc.
- Check Point Software Technologies Ltd.
- Okta, Inc.
- Zscaler, Inc.
- Cloudflare, Inc.
- Trend Micro Incorporated
- BAE Systems plc
- Booz Allen Hamilton Holding Corporation
Additional Benefits:
- The market estimate (ME) sheet in Excel format
- 3 months of analyst support
TABLE OF CONTENTS
1 INTRODUCTION
- 1.1 Study Assumptions and Market Definition
- 1.2 Scope of the Study
2 RESEARCH METHODOLOGY
3 EXECUTIVE SUMMARY
4 MARKET LANDSCAPE
- 4.1 Market Overview
- 4.2 Market Drivers
- 4.2.1 Growing nation-state cyber offensives
- 4.2.2 AI-enabled threat detection adoption
- 4.2.3 Expansion of 5G/IIoT attack surface
- 4.2.4 Rise of Cybersecurity-as-a-Service (C-aa-S)
- 4.2.5 Escalating regulatory fines on data breaches
- 4.2.6 Real-time dark-web threat-intel exchanges
- 4.3 Market Restraints
- 4.3.1 Shortage of tier-1 cyber warfare talent
- 4.3.2 Inter-agency data-sharing silos
- 4.3.3 Legacy OT systems with proprietary protocols
- 4.3.4 High false-positive rates in ML models
- 4.4 Industry Value Chain Analysis
- 4.5 Regulatory Landscape
- 4.6 Technological Outlook
- 4.7 Porter's Five Forces Analysis
- 4.7.1 Bargaining Power of Suppliers
- 4.7.2 Bargaining Power of Consumers
- 4.7.3 Threat of New Entrants
- 4.7.4 Competitive Rivalry
- 4.7.5 Threat of Substitutes
- 4.8 Impact of Macroeconomic Factors
5 MARKET SIZE AND GROWTH FORECASTS (VALUE)
- 5.1 By End-user Industry
- 5.1.1 Defense
- 5.1.2 Aerospace
- 5.1.3 BFSI
- 5.1.4 Corporate/Enterprise
- 5.1.5 Power and Utilities
- 5.1.6 Government and Intelligence Agencies
- 5.1.7 Healthcare
- 5.2 By Solution Type
- 5.2.1 Network Security Solutions
- 5.2.2 Endpoint Security Solutions
- 5.2.3 Cloud Security Solutions
- 5.2.4 Application Security
- 5.2.5 Data and Database Security
- 5.2.6 Identity and Access Management
- 5.2.7 Threat Intelligence and MSSP
- 5.3 By Deployment Mode
- 5.3.1 On-premise
- 5.3.2 Cloud
- 5.3.3 Hybrid
- 5.3.4 Managed / Hosted
- 5.4 By Security Layer
- 5.4.1 Network Layer
- 5.4.2 Endpoint Layer
- 5.4.3 Application Layer
- 5.4.4 Data / Cloud Layer
- 5.5 By Geography
- 5.5.1 North America
- 5.5.1.1 United States
- 5.5.1.2 Canada
- 5.5.1.3 Mexico
- 5.5.2 South America
- 5.5.2.1 Brazil
- 5.5.2.2 Argentina
- 5.5.2.3 Rest of South America
- 5.5.3 Europe
- 5.5.3.1 Germany
- 5.5.3.2 United Kingdom
- 5.5.3.3 France
- 5.5.3.4 Italy
- 5.5.3.5 Spain
- 5.5.3.6 Russia
- 5.5.3.7 Rest of Europe
- 5.5.4 Asia-Pacific
- 5.5.4.1 China
- 5.5.4.2 Japan
- 5.5.4.3 India
- 5.5.4.4 South Korea
- 5.5.4.5 Rest of Asia-Pacific
- 5.5.5 Middle East and Africa
- 5.5.5.1 Middle East
- 5.5.5.1.1 Saudi Arabia
- 5.5.5.1.2 United Arab Emirates
- 5.5.5.1.3 Turkey
- 5.5.5.1.4 Israel
- 5.5.5.1.5 Rest of Middle East
- 5.5.5.2 Africa
- 5.5.5.2.1 South Africa
- 5.5.5.2.2 Nigeria
- 5.5.5.2.3 Rest of Africa
- 5.5.5.1 Middle East
- 5.5.1 North America
6 COMPETITIVE LANDSCAPE
- 6.1 Market Concentration
- 6.2 Strategic Moves
- 6.3 Market Share Analysis
- 6.4 Company Profiles (includes Global level Overview, Market level overview, Core Segments, Financials as available, Strategic Information, Market Rank/Share for key companies, Products and Services, and Recent Developments)
- 6.4.1 Palo Alto Networks, Inc.
- 6.4.2 Cisco Systems, Inc.
- 6.4.3 Microsoft Corporation
- 6.4.4 Fortinet, Inc.
- 6.4.5 International Business Machines Corporation
- 6.4.6 AO Kaspersky Lab
- 6.4.7 Dell Technologies Inc.
- 6.4.8 DXC Technology Company
- 6.4.9 International Intelligence Limited
- 6.4.10 Nexusguard Limited
- 6.4.11 Leidos Holdings, Inc.
- 6.4.12 Raytheon Technologies Corporation
- 6.4.13 Broadcom Inc. (Symantec Enterprise)
- 6.4.14 SAP SE
- 6.4.15 CrowdStrike Holdings, Inc.
- 6.4.16 Check Point Software Technologies Ltd.
- 6.4.17 Okta, Inc.
- 6.4.18 Zscaler, Inc.
- 6.4.19 Cloudflare, Inc.
- 6.4.20 Trend Micro Incorporated
- 6.4.21 BAE Systems plc
- 6.4.22 Booz Allen Hamilton Holding Corporation
7 MARKET OPPORTUNITIES AND FUTURE OUTLOOK
- 7.1 White-space and Unmet-Need Assessment

(주말 및 공휴일 제외)


