

|
시장보고서
상품코드
2120820
IoT 테스트 : 시장 점유율 분석, 업계 동향과 통계, 성장 예측(2026-2031년)IoT Testing - Market Share Analysis, Industry Trends & Statistics, Growth Forecasts (2026 - 2031) |
||||||
 Mordor Intelligence
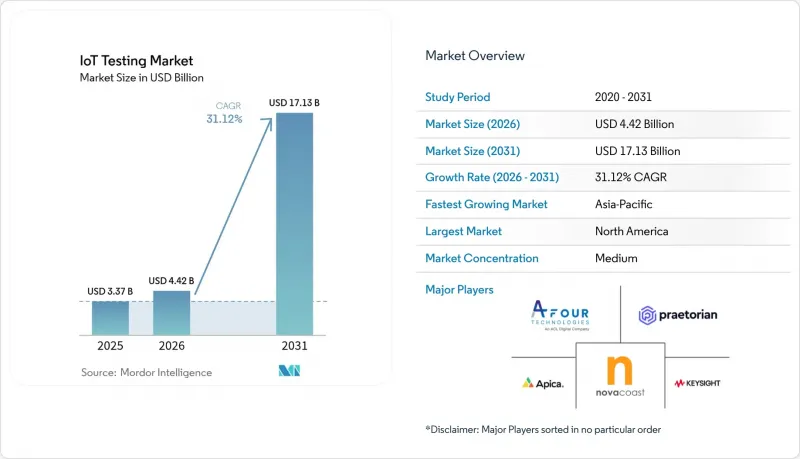
Mordor Intelligence에 의하면, 2026년 IoT 테스트 시장 규모는 44억 2,000만 달러로 추정되며, 2025년 33억 7,000만 달러에서 성장하여 2031년에는 171억 3,000만 달러에 달할 것으로 예측됩니다.
또한 2026-2031년 연평균 성장률(CAGR) 31.12%를 기록할 전망입니다.
본 보고서는 서비스 유형(전문 서비스 및 관리형 서비스), 테스트 유형(기능 테스트, 성능 테스트, 네트워크 테스트, 호환성 테스트, 보안 테스트, 사용성 테스트),용도(스마트 빌딩 및 홈 오토메이션, 모세관 네트워크 관리 등), 최종 사용자 산업(소매, 제조, 의료, 에너지·유틸리티, IT 및 통신 등), 그리고 지역별로 분류되어 있습니다.
세계 IoT 테스트 시장 동향 및 인사이트
연결된 IoT 엔드포인트의 폭발적인 증가
중국에서는 2024년 8월 기준으로 25억 7,000만 대의 활성 IoT 단말기가 보고되었으며, 이는 현재 기하급수적으로 확대되는 테스트 매트릭스를 주도하는 규모의 변화를 여실히 보여주고 있습니다. 단일 스마트 팩토리 내에서도 Zigbee 센서, LoRaWAN 게이트웨이, 5G RedCap 로봇이 혼재되어 있어, 검증 팀은 모든 프로토콜 조합에 걸쳐 원활한 상호 운용성을 보장해야만 합니다. 현대자동차(Hyundai)와 삼성(Samsung)은 이미 10밀리초 미만의 지연 시간 검증이 요구되는 프라이빗 5G RedCap 생산 라인의 실증에 성공했습니다. 서로 다른 세대의 기기가 혼재된 환경이 확산됨에 따라, 새로운 기기 SKU가 추가될 때마다 인증이 필요한 조합이 두 배로 늘어나고, 기업들은 커버리지를 희생하지 않으면서 확장 가능한 통합 테스트 자동화 프레임워크에 투자할 수밖에 없게 되었습니다. 따라서 IoT 테스트 시장은 하나의 구성 가능한 환경 내에서 기존의 4G 모듈과 향후 5G 엔드포인트를 모두 지원해야 합니다.
강화되는 보안 및 개인정보 보호 규정
2025년 8월부터 유럽연합(EU)의 ‘무선 장비 지침’에 따라 인터넷에 연결되는 모든 제품은 판매 전에 사이버 보안 적합성 테스트를 통과해야 합니다. 조화 표준인 EN 18031 시리즈에서는 네트워크 보호, 데이터 개인정보 보호 및 부정 방지 테스트 케이스가 규정되어 있으며, 규정 준수를 위한 업무 부담은 기능 점검의 범위를 훨씬 뛰어넘어 확대되고 있습니다. 걸프 지역에서는 사우디아라비아와 UAE에서 생체 인증을 통한 SIM 등록이 의무화됨에 따라 연결성 테스트 프로토콜이 변화하고 있습니다. 사내에 보안 전문 지식이 없는 기업들은 검증 업무를 외부에 위탁하는 경우가 늘어나고 있으며, IoT 테스트 시장에서 매니지드 서비스 제공업체에 대한 수요가 증가하고 있습니다.
디바이스/프로토콜의 복잡화
현대적인 도입 환경에서는 Wi-Fi 6E 센서, Bluetooth 5.4 비콘, LoRaWAN 계량기, NB-IoT 트래커, 5G RedCap 모뎀 등이 혼재되어 있어, 각각에 다른 도구가 필요합니다. 자동차용 반도체의 탑재량은 2030년까지 차량당 1,200달러에 달할 것으로 예측되며, 제어 장치 및 텔레매틱스 게이트웨이의 검증 항목은 2배로 늘어날 것으로 전망됩니다. 새로운 프로토콜이 잇달아 기존 매트릭스에 추가됨에 따라 테스트 주기가 장기화되고 있으며, 이는 자원이 제한된 테스트 랩에 큰 과제가 되고 있습니다. 자동화, 가상화 및 AI를 활용한 우선순위 설정을 통해 사이클 타임을 단축하지 못한다면, 이러한 복잡성이 IoT 테스트 시장의 지출 둔화를 초래할 가능성이 있습니다.
부문 분석
2025년 매출에서는 기업들이 프로토콜, 보안, 규정 준수와 관련된 다각적인 요구를 충족하기 위해 외부 전문가에 의존함에 따라 전문 서비스가 60.42%의 점유율을 차지하며 시장을 주도했습니다. 이러한 강점은 5G, RedCap 및 EU 사이버 규정 준수 테스트에 정통한 풍부한 인재 기반에서 비롯됩니다. 한편, 매니지드 서비스는 제조업체와 차량 운영 사업자가 연중무휴 24시간 실험실 운영을 보장하는 구독 계약을 선호함에 따라 연평균 18.15%의 성장이 예상됩니다. HCL Technologies는 2024 회계연도 매출이 133억 달러에 달했다고 보고했으며, 이러한 강력한 성장은 해당 기업의 매니지드 테스트 포트폴리오 덕분인 것으로 분석됩니다. 이러한 변화는 IoT 테스트 시장 전체의 제공 모델을 재정의하고 있으며, 완전히 외주화된 검증 센터에 대한 수요를 확대시키고 있습니다.
IoT 테스트 시장의 매니지드 서비스 시장 규모는 2025년 13억 3,000만 달러에서 2031년까지 36억 3,000만 달러로 급증할 것으로 예측되며, 이는 전문 외부 실험실에 유리한 급격한 복잡성 곡선을 반영합니다. 전 세계 시스템 통합사업자들은 고객이 하드웨어를 발송하지 않고도 24시간?制로 테스트를 예약할 수 있도록 하기 위해 원격 접속이 가능한 디바이스 팜에 대한 투자를 진행하고 있습니다.
2025년에도 프로젝트는 여전히 연결성 및 데이터 흐름 확인에서 시작되기 때문에 기능 검증은 매출의 26.85%라는 가장 큰 점유율을 유지했습니다. 그럼에도 불구하고, 보안 테스트는 2031년까지 연평균 성장률(CAGR) 21.95%를 나타낼 것으로 예측됩니다. 현재 IoT 테스트 시장에서는 EN 18031 및 미국 FDA의 시판 전 승인 신청에 부합하는 침입 시뮬레이션, 펌웨어 무결성 스캔, 암호화 채널 평가를 수행해야 합니다. Applus+는 ETSI 303 645 인증 수요에 신속하게 대응하기 위해 2024년에 유럽에 새로운 사이버 랩을 개설했습니다.
규제 당국의 과징금으로 인해 기기 제조업체들은 모든 빌드에 검증 기능을 통합해야 하는 상황에 놓여 있어, 2031년까지 보안 서비스만으로도 IoT 테스트 시장의 30.20% 점유율을 차지할 가능성이 있습니다. 한편, 5G URLLC 시나리오에서는 성능 부하 테스트 및 네트워크 핸드오버 테스트가 여전히 중요하며 그 중요성은 유지되고 있지만, 성장률은 그리 높지 않습니다.
지역별 분석
2025년에는 기업들이 설계부터 운영 환경에 이르기까지 테스트를 통합한 DevOps 파이프라인을 채택한 결과, 북미가 매출의 38.12%를 차지하며 시장을 주도했습니다. 샌안토니오의 ‘SmartSA’ 이니셔티브는 가로등 센서 하나하나가 현장 배포 전에 상호 운용성 및 보안 심사를 통과해야 하는 지자체 차원의 시범 사례를 보여줍니다. IoT 테스트 시장은 확립된 인증 생태계와 자금력이 풍부한 항공우주, 자동차, 산업 자동화 분야의 고객들로부터 혜택을 받고 있습니다.
아시아태평양은 15.32%라는 가장 높은 연평균 성장률(CAGR)을 나타낼 전망입니다. 중국 슝안(Xiong'an)의 10Gbps 백본과 베이징의 ‘차량·도로·클라우드’ 시범 사업으로 인해 대규모 적합성 검증 실험실에 대한 수요가 증가하고 있습니다. 일본의 ‘사회 5.0’과 한국의 1억 100만 달러 규모의 국가 스마트시티 기금으로 인해, 지역 고유의 통신 및 개인정보 보호 규정에 따라 프로파일링이 필요한 수천 대의 기기가 추가되고 있습니다. 현지 벤더들이 클라우드 네이티브 자동화를 통합함에 따라, 아시아태평양의 IoT 테스트 시장 규모는 2031년까지 52억 3,000만 달러를 넘어설 가능성이 있습니다.
유럽은 ‘규제 우선’이라는 입장에 힘입어 견조한 성장을 유지하고 있습니다. ‘무선 장비 지침(Radio Equipment Directive)’의 사이버 보안 조항에 따르면, CE 마크를 획득하기 전에 제3자 시험 기관을 통한 침투 테스트를 실시해야 합니다. 2023년에는 스마트 계량기 도입률이 전력 부문에서 60%, 가스 부문에서 45%에 달하며, 유틸리티자를 위한 검증 업무가 지속적으로 확대되고 있습니다. 북유럽의 통신 사업자들은 5G IoT 공유 연구소를 개설하고 있으며, 그 예로 텔레노르(Telenor)의 카를스크루나 시설을 들 수 있습니다. 이 시설에서는 전 세계 기기 제조업체에 스웨덴 네트워크에 대한 플러그 앤 플레이 방식의 접속을 제공합니다. 이러한 체계를 통해 유럽의 IoT 테스트 시장은 규정 준수를 중시하며 탄력성을 지속적으로 유지하고 있습니다.
기타 혜택:
- 엑셀 형식 시장 예측(ME) 시트
- 3개월간의 애널리스트 지원
자주 묻는 질문
목차
제1장 서론
제2장 조사 방법
제3장 주요 요약
제4장 시장 구도
제5장 시장 규모와 성장 예측
제6장 경쟁 구도
제7장 시장 기회와 향후 전망
LSH 26.09.08According to Mordor Intelligence, IoT testing market size in 2026 is estimated at USD 4.42 billion, growing from 2025 value of USD 3.37 billion with 2031 projections showing USD 17.13 billion, growing at 31.12% CAGR over 2026-2031.
This report is Segmented by Service Type (Professional and Managed), Testing Type (Functional Testing, Performance Testing, Network Testing, Compatibility Testing, Security Testing, and Usability Testing), Application (Smart Building and Home Automation, Capillary Networks Management, and More) End-User Industry (Retail, Manufacturing, Healthcare, Energy and Utilities, IT and Telecom, and More), and Geography.
Global IoT Testing Market Trends and Insights
Explosion in Connected IoT Endpoints
China reported 2.57 billion active IoT terminals by August 2024, underscoring the scale shift that now drives exponentially larger test matrices. A single smart factory can blend Zigbee sensors, LoRaWAN gateways, and 5G RedCap robots, forcing validation teams to assure seamless interoperability across every protocol permutation. Hyundai and Samsung have already proven private 5G RedCap production lines that demand sub-10 millisecond latency verification. As mixed-generation fleets proliferate, each new device SKU multiplies the combinations that must be certified, compelling enterprises to invest in unified test-automation frameworks able to scale without sacrificing coverage. The IoT testing market must therefore support legacy 4G modules and future 5G endpoints in one configurable environment.
Escalating Security and Privacy Regulations
From August 2025, the European Union's Radio Equipment Directive obliges every internet-connected product to pass cybersecurity conformance testing before sale. The harmonized EN 18031 series now prescribes network protection, data privacy, and fraud-prevention test cases, expanding compliance workloads well beyond functional checks. In the Gulf region, mandatory biometric SIM registration in Saudi Arabia and the UAE is reshaping connectivity-test protocols. Enterprises unable to field in-house security expertise are increasingly outsourcing validation, steering demand toward managed-service providers inside the IoT testing market.
Rising Device/Protocol Complexity
Contemporary deployments mix Wi-Fi 6E sensors, Bluetooth 5.4 beacons, LoRaWAN meters, NB-IoT trackers, and 5G RedCap modems, each demanding distinct tooling. Automotive semiconductor content is projected to hit USD 1,200 per car by 2030, doubling validation points across control units and telematics gateways. Every new protocol stacks onto the existing matrix, lengthening test cycles and challenging resource-constrained labs. Unless automation, virtualization, and AI-enabled prioritization shrink cycle times, this complexity could slow spend within the IoT testing market.
Other drivers and restraints analyzed in the detailed report include:
- Shift Toward DevOps and Continuous Testing Pipelines
- 5G/Edge-Computing Driven Low-Latency Use-Cases
- Lack of Global Interoperability Standards
For complete list of drivers and restraints, kindly check the Table Of Contents.
Segment Analysis
Professional services dominated 2025 revenue with a 60.42% stake as enterprises leaned on external specialists for multifaceted protocol, security, and compliance needs. Their strength stems from deep benches versed in 5G, RedCap and EU cyber-conformance testing. Managed services, however, are forecast to rise 18.15% annually because manufacturers and fleet operators prefer subscription contracts that guarantee 24/7 lab capacity. HCL Technologies reported USD 13.3 billion FY24 revenue, attributing strong growth to its managed testing portfolios. This transition is redefining delivery models across the IoT testing market and widening demand for fully outsourced validation centers.
The IoT testing market size for managed services is projected to jump from USD 1.33 billion in 2025 to USD 3.63 billion by 2031, mirroring the steep complexity curve that favors dedicated external labs. Global system integrators are investing in remote-accessible device farms so clients can queue tests around the clock without shipping hardware.
Functional validation retained the largest 26.85% revenue slice in 2025 because projects still begin with connectivity and data-flow checks. Nevertheless, security testing is expected to post a 21.95% CAGR through 2031. The IoT testing market must now execute penetration simulations, firmware-integrity scans, and encrypted-channel evaluations aligned with EN 18031 and US FDA pre-market submissions. Applus+ opened a new European cyber-lab in 2024 to fast-track ETSI 303 645 certification demand.
Security services alone could capture 30.20% IoT testing market share by 2031 as regulatory fines push device makers to bake validation into every build. In parallel, performance-stress and network-handover tests stay critical for 5G URLLC scenarios, keeping them relevant, though not as fast-growing.
Complete Report Scope:
- By Service Type
- Professional
- Managed
- By Testing Type
- Functional Testing
- Performance Testing
- Network Testing
- Compatibility Testing
- Security Testing
- Usability Testing
- By Application
- Smart Building and Home Automation
- Capillary Networks Management
- Smart Utilities (Energy / Water)
- Vehicle Telematics and Connected Vehicles
- Smart Manufacturing / Industrial IoT (IIoT)
- By End-user Industry
- Retail
- Manufacturing
- Healthcare
- Energy and Utilities
- IT and Telecom
- Government and Smart Cities
- Transportation and Logistics
- Other Industries
- By Geography
- North America
- United States
- Canada
- Mexico
- South America
- Brazil
- Argentina
- Rest of South America
- Europe
- United Kingdom
- Germany
- France
- Italy
- Spain
- Rest of Europe
- Asia-Pacific
- China
- Japan
- India
- South Korea
- Rest of Asia-Pacific
- Middle East and Africa
- Middle East
- United Arab Emirates
- Saudi Arabia
- Turkey
- Rest of Middle East
- Africa
- South Africa
- Nigeria
- Rest of Africa
- Middle East
- North America
Geography Analysis
North America led with 38.12% revenue in 2025 as enterprises adopted DevOps pipelines that embed testing from design through production. San Antonio's SmartSA initiative demonstrates municipal-grade pilots where every lamp-post sensor must clear interoperability and security gates before field deployment. The IoT testing market benefits from established certification ecosystems and well-funded aerospace, automotive, and industrial-automation clients.
Asia Pacific is predicted to post the fastest 15.32% CAGR. China's Xiong'an 10 Gbps backbone and Beijing's vehicle-road-cloud pilots elevate demand for massive-scale conformance labs. Japan's Society 5.0 and South Korea's USD 101 million national smart-city fund are adding thousands of devices that must be profiled under region-specific telecom and privacy rules. The IoT testing market size in Asia Pacific could cross USD 5.23 billion by 2031 as local vendors integrate cloud-native automation.
Europe maintains solid growth anchored in its rule-first posture. Radio Equipment Directive cybersecurity clauses require third-party labs to run penetration tests before CE marking. Smart-meter rollouts hit 60% for electricity and 45% for gas in 2023, driving sustained validation work for utility suppliers. Nordic telcos are opening shared 5G IoT labs, exemplified by Telenor's Karlskrona facility that grants global device makers plug-and-play access to Swedish networks. These frameworks ensure the IoT testing market in Europe remains compliance-centric and resilient.
- IBM
- Keysight Technologies
- HCL Technologies
- Cognizant
- Capgemini
- Infosys
- Tata Consultancy Services
- Accenture
- Wipro
- Qualitest Group
- Spirent Communications
- AFour (ACL Digital)
- Apica Systems
- Praetorian Security
- Novacoast
- Trustwave (Singtel)
- Happiest Minds
- Vector Informatik
- Eurofins Digital Testing
- SmartBear
- VIAVI Solutions
Additional Benefits:
- The market estimate (ME) sheet in Excel format
- 3 months of analyst support
TABLE OF CONTENTS
1 INTRODUCTION
- 1.1 Study Assumptions and Market Definition
- 1.2 Scope of the Study
2 RESEARCH METHODOLOGY
3 EXECUTIVE SUMMARY
4 MARKET LANDSCAPE
- 4.1 Market Overview
- 4.2 Market Drivers
- 4.2.1 Explosion in connected IoT endpoints
- 4.2.2 Escalating security and privacy regulations
- 4.2.3 Shift toward DevOps and continuous testing pipelines
- 4.2.4 5G/edge-computing driven low-latency use-cases
- 4.2.5 Digital-twin-based "virtual testing" adoption
- 4.2.6 Sustainability mandates for energy-efficient devices
- 4.3 Market Restraints
- 4.3.1 Rising device/protocol complexity
- 4.3.2 Lack of global interoperability standards
- 4.3.3 Scarcity of multi-access edge test beds
- 4.3.4 Data-sovereignty rules slowing cross-border testing
- 4.4 Value/Supply-Chain Analysis
- 4.5 Regulatory Landscape
- 4.6 Technological Outlook
- 4.7 Testing Types Overview
- 4.8 Porter's Five Forces Analysis
- 4.8.1 Bargaining Power of Suppliers
- 4.8.2 Bargaining Power of Buyers
- 4.8.3 Threat of New Entrants
- 4.8.4 Threat of Substitutes
- 4.8.5 Intensity of Competitive Rivalry
- 4.9 Assessment of COVID-19 and Post-Pandemic Impacts
5 MARKET SIZE AND GROWTH FORECASTS (VALUE)
- 5.1 By Service Type
- 5.1.1 Professional
- 5.1.2 Managed
- 5.2 By Testing Type
- 5.2.1 Functional Testing
- 5.2.2 Performance Testing
- 5.2.3 Network Testing
- 5.2.4 Compatibility Testing
- 5.2.5 Security Testing
- 5.2.6 Usability Testing
- 5.3 By Application
- 5.3.1 Smart Building and Home Automation
- 5.3.2 Capillary Networks Management
- 5.3.3 Smart Utilities (Energy / Water)
- 5.3.4 Vehicle Telematics and Connected Vehicles
- 5.3.5 Smart Manufacturing / Industrial IoT (IIoT)
- 5.4 By End-user Industry
- 5.4.1 Retail
- 5.4.2 Manufacturing
- 5.4.3 Healthcare
- 5.4.4 Energy and Utilities
- 5.4.5 IT and Telecom
- 5.4.6 Government and Smart Cities
- 5.4.7 Transportation and Logistics
- 5.4.8 Other Industries
- 5.5 By Geography
- 5.5.1 North America
- 5.5.1.1 United States
- 5.5.1.2 Canada
- 5.5.1.3 Mexico
- 5.5.2 South America
- 5.5.2.1 Brazil
- 5.5.2.2 Argentina
- 5.5.2.3 Rest of South America
- 5.5.3 Europe
- 5.5.3.1 United Kingdom
- 5.5.3.2 Germany
- 5.5.3.3 France
- 5.5.3.4 Italy
- 5.5.3.5 Spain
- 5.5.3.6 Rest of Europe
- 5.5.4 Asia-Pacific
- 5.5.4.1 China
- 5.5.4.2 Japan
- 5.5.4.3 India
- 5.5.4.4 South Korea
- 5.5.4.5 Rest of Asia-Pacific
- 5.5.5 Middle East and Africa
- 5.5.5.1 Middle East
- 5.5.5.1.1 United Arab Emirates
- 5.5.5.1.2 Saudi Arabia
- 5.5.5.1.3 Turkey
- 5.5.5.1.4 Rest of Middle East
- 5.5.5.2 Africa
- 5.5.5.2.1 South Africa
- 5.5.5.2.2 Nigeria
- 5.5.5.2.3 Rest of Africa
- 5.5.5.1 Middle East
- 5.5.1 North America
6 COMPETITIVE LANDSCAPE
- 6.1 Market Concentration
- 6.2 Strategic Initiatives and Funding
- 6.3 Market Share Analysis
- 6.4 Company Profiles (includes Global level Overview, Market level overview, Core Segments, Financials as available, Strategic Information, Market Rank/Share, Products and Services, Recent Developments)
- 6.4.1 IBM
- 6.4.2 Keysight Technologies
- 6.4.3 HCL Technologies
- 6.4.4 Cognizant
- 6.4.5 Capgemini
- 6.4.6 Infosys
- 6.4.7 Tata Consultancy Services
- 6.4.8 Accenture
- 6.4.9 Wipro
- 6.4.10 Qualitest Group
- 6.4.11 Spirent Communications
- 6.4.12 AFour (ACL Digital)
- 6.4.13 Apica Systems
- 6.4.14 Praetorian Security
- 6.4.15 Novacoast
- 6.4.16 Trustwave (Singtel)
- 6.4.17 Happiest Minds
- 6.4.18 Vector Informatik
- 6.4.19 Eurofins Digital Testing
- 6.4.20 SmartBear
- 6.4.21 VIAVI Solutions
7 MARKET OPPORTUNITIES AND FUTURE OUTLOOK
- 7.1 White-space and Unmet-need Assessment


