

|
시장보고서
상품코드
2120845
홀로그래픽 디스플레이 : 시장 점유율 분석, 업계 동향과 통계, 성장 예측(2026-2031년)Holographic Display - Market Share Analysis, Industry Trends & Statistics, Growth Forecasts (2026 - 2031) |
||||||
 Mordor Intelligence
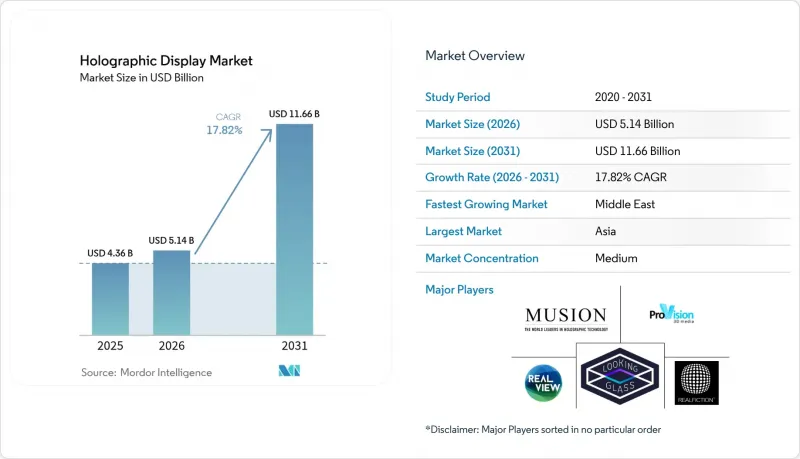
Mordor Intelligence에 의하면, 2026년 홀로그래픽 디스플레이 시장 규모는 51억 4,000만 달러로 추정되며, 2025년 43억 6,000만 달러에서 2031년에는 116억 6,000만 달러에 달할 것으로 예측됩니다.
또한 2026-2031년 연평균 성장률(CAGR)은 17.82%를 기록할 전망입니다.
본 보고서는 구성 요소(하드웨어, 소프트웨어, 서비스), 기술(전기 홀로그래피, 터치 가능/공중 햅틱 등), 제품 유형(디지털 사이니지 및 키오스크, 스마트 TV 및 모니터 등), 최종 사용자(소비자 가전, 소매·전시회 등) 및 지역별로 분류되어 있습니다. 시장 전망은 금액(달러) 기준으로 제시되어 있습니다.
세계 홀로그래픽 디스플레이 시장 동향 및 인사이트
자동차 제조업체의 증강현실(AR) 홀로그래픽 HUD 도입
독일의 고급 자동차 제조업체와 중국의 전기차 브랜드는 프리미엄 등급의 차별화를 꾀하고 운전자의 상황 인식 능력을 향상시키기 위해 전면 유리에 걸쳐 펼쳐지는 홀로그래픽 헤드업 디스플레이(HUD)를 채택하고 있습니다. CES 2025에서 공개된 현대 모비스의 컨셉트 모델은 3개의 표시 영역에 내비게이션 정보, 경고, 엔터테인먼트 컨텐츠를 투사하며, 자이스(Zeiss)와의 공동 개발을 통해 2027년까지 양산을 목표로 하고 있습니다. 시장 전망에 따르면, 2030년까지 700만 대의 자동차용 유닛이 출하될 것으로 예상되며, 대시보드 공간이 몰입형 AR 캔버스로 변모할 전망입니다.
미국 Tier 1 병원의 볼륨형 3D 수술 계획 시스템 도입
병원에서는 종양학, 심장학, 정형외과 분야에서 트루뎁스 홀로그램의 도입이 진행되고 있습니다. RealView Imaging사의 ‘HOLOSCOPE-i.’를 통해 외과의사는 3D 해부 구조를 실시간으로 조작할 수 있게 되어, 계획에 소요되는 시간을 단축하고 수술실에서의 실수를 줄일 수 있습니다. 임상 연구에 따르면, 특히 비공면 방사선 치료 빔의 경우, 2D 기법보다 홀로그래픽 계획이 61%의 지지를 얻고 있습니다.
양산형 마이크로 LED 도파판공급 부족이 BOM 비용을 끌어올리고 있다.
효율적인 도파판에 필요한 나노 스케일의 공차를 달성할 수 있는 제조 공장은 극히 드물기 때문에 가격은 LCD나 OLED 대체품보다 40-60% 높은 수준을 유지하고 있습니다. 소니의 0.44형 Full HDOLED 마이크로 디스플레이의 예상 가격은 260달러(4만 엔)를 초과하여, 소비자용 기기의 수익성을 제한하고 있습니다.
부문 분석
2025년 매출액 중 하드웨어가 74.85%를 차지하고 있으며, 이는 홀로그래픽 디스플레이 시장의 기반이 되는 공간 광 변조기, 레이저 엔진, 정밀 광학 시스템이 자본 집약적임을 여실히 보여줍니다. 프로젝터, 광도파로, 마이크로디스플레이 엔진은 여전히 비용 요인으로 작용하고 있지만, 부품 가격 하락으로 인해 향후 10년 말까지 홀로그래픽 디스플레이 시장 규모에서 하드웨어의 점유율은 소폭 감소할 전망입니다. 기업들이 턴키 방식 도입, 보정, 라이프사이클 지원 계약을 요구하는 가운데, 서비스 부문은 이미 22.32%라는 가장 높은 연평균 성장률(CAGR)을 기록하고 있습니다. 통합 전문 기업들은 On-Premise 설치, 클라우드 렌더링, 교육을 패키지로 묶어 일회성 기기 판매를 다년간의 계약으로 전환하고 있습니다. 의료 네트워크에서는 수술 계획 스위트의 가동 시간을 보장하는 서비스 수준 계약(SLA)이 규정되어 있으며, 자동차 제조업체는 광학 시스템 조정을 Tier 1 공급업체에 외주화하고 있습니다. 따라서 홀로그래픽 디스플레이 시장은 하드웨어 이익률에 대한 의존에서 부수적인 서비스의 정기 수익으로 전환되고 있습니다.
이와 동시에 소프트웨어 스택에는 실시간 렌더링, AI를 활용한 컨텐츠 제작, 분석 기능이 추가되어 물리적 장비 위에 구독 수익층이 형성되고 있습니다. 이러한 동향은 컨텐츠 관리 플랫폼이 필수 요소가 된 프로젝션 및 사이니지 업계의 과거 변천사를 연상시킵니다. 대용량 스트리밍이 보급됨에 따라 대역폭 최적화 및 보안 패치를 통해 서비스의 비즈니스 기회는 더욱 확대될 것입니다. 하드웨어 벤더들은 현재 사내 전문 서비스 부서를 육성하거나 시스템 통합 업체와 제휴하여 광학 시스템, 펌웨어 및 관리 대상 컨텐츠 간의 긴밀한 연동을 확보하고 있습니다. 이러한 접근 방식은 홀로그래픽 디스플레이 산업 전반에 걸친 생태계의 락인(lock-in)을 강화하는 것입니다.
2025년에는 LCOS(Liquid Crystal on Silicon) 및 SLM(Space Light Modulator) 공급망이 성숙해진 덕분에 전기 홀로그래피 아키텍처가 매출의 40.25%를 차지했습니다. 안정적인 수율과 확립된 설계 툴셋 덕분에 이 형식은 자동차용 HUD 및 의료용 스캐너에 있어 안전한 선택지가 되어 홀로그래픽 디스플레이 시장에서 우위를 유지하고 있습니다. 한편, 햅틱 미드 에어 시스템은 개발자들이 위상 배열 초음파와 체적형 비주얼을 결합하여 사용자가 공중에 떠 있는 인터페이스를 ‘만질’ 수 있게 함으로써 24.05%의 연평균 성장률(CAGR)을 기록하고 있습니다. 제스처로 상품을 회전시킬 수 있는 소매용 포디움이나 무균 상태에서 조작이 가능한 병원용 디스플레이 등이 상업적 보급의 대표적인 사례로 꼽힙니다.
레이저/플라즈마 프로젝션 솔루션은 야외 무대 쇼나 햇빛이 비치는 대시보드 환경 등 극도로 밝은 환경을 대상으로 하는 반면, 반투명 도파관은 AR 스마트 글래스에 활용되고 있습니다. POSTECH가 발표한 메타서피스 광학 기술은 색수차 보정에 도움이 되며, 컬러 관리를 간소화하고 디바이스의 얇은 두께 구현을 가능하게 합니다. 음향 및 포토트랩 관련 연구 분야는 효율성을 재정의할 가능성을 지니고 있으나, 그 상용화는 현재 예측 기간을 넘어 더 먼 시점이 될 전망입니다. 전반적으로, 홀로그래픽 디스플레이 시장에서 기존의 전기 홀로그래픽 공급업체들은 급성장하는 햅틱 기술 경쟁사들을 제치기 위해 전력 소비, 해상도 및 상호작용 측면에서 혁신을 꾀해야 합니다.
지역별 분석
아시아태평양은 중국의 전기차 붐, 일본의 엔터테인먼트 기술, 한국의 반도체 생태계를 활용하여 2025년 매출의 36.55%를 차지했습니다. 민관 협력 프로그램을 통해 마이크로 LED 백플레인 및 메타서피스 광학 시스템에 대한 인센티브가 투입되면서, 이 지역공급 측면에서의 우위가 강화되고 있습니다. 아시아태평양에 속하는 홀로그래픽 디스플레이 시장 규모는 도쿄, 서울, 상하이의 소매점에 집중적으로 도입된 점에서도 혜택을 받고 있습니다. 유럽은 자동차 분야의 도입 실적을 바탕으로 성장세를 이어가고 있으나, 밝기에 관한 규제로 인해 성장세가 둔화되고 있습니다. 그럼에도 불구하고, 자이스와 현대자동차 같은 제휴를 통해 혁신 파이프라인은 유지되고 있습니다.
북미에서는 수술용 시각화 시스템 업그레이드를 추진하는 미국의 Tier 1 병원과 체적형 미션 계획 테이블을 조달하는 국방 기관을 중심으로 꾸준한 성장세를 보이고 있습니다. 캐나다의 라이브 이벤트 주최사들은 홀로그램 페스티벌을 시범적으로 개최하며 시장 영향력을 확대되고 있습니다. 중동은 두바이, 리야드, 도하의 고급 쇼핑몰들이 브랜드 스토리텔링을 향상시키는 360도 홀로그램 쇼케이스에 막대한 투자를 하고 있어, 2031년까지 연평균 성장률(CAGR)이 21.18%로 가장 높습니다. 아부다비와 네옴에서 진행 중인 정부 주도의 스마트 시티 구상도 추가적인 실험을 촉진하고 있습니다.
라틴아메리카와 아프리카는 수입 관세 및 대역폭 제약으로 인해 여전히 초기 단계에 머물러 있지만, 상파울루의 소매 업계와 남아프리카공화국의 광업 분야에서 진행 중인 시각화 기술 시범 프로젝트는 하류 시장으로의 확장을 시사하고 있습니다. 그럼에도 불구하고, 전 세계 공급망에서 주요 도파관 제조가 일본과 한국을 경유하고 있기 때문에 모든 지역이 잠재적인 병목 현상의 영향을 받을 가능성이 있습니다. 이는 홀로그래픽 디스플레이 시장의 이해관계자들이 위험 완화를 위해 주시하고 있는 요인입니다.
기타 혜택:
- 엑셀 형식 시장 예측(ME) 시트
- 3개월간의 애널리스트 지원
자주 묻는 질문
목차
제1장 서론
제2장 조사 방법
제3장 주요 요약
제4장 시장 구도
제5장 시장 규모와 성장 예측
제6장 경쟁 구도
제7장 시장 기회와 향후 전망
LSH 26.09.08According to Mordor Intelligence, holographic display market size in 2026 is estimated at USD 5.14 billion, growing from 2025 value of USD 4.36 billion with 2031 projections showing USD 11.66 billion, growing at 17.82% CAGR over 2026-2031.
This report is Segmented by Component (Hardware, Software, Services), Technology (Electro-Holographic, Touchable/Mid-Air Haptic, and More), Product Type (Digital Signage and Kiosks, Smart TVs and Monitors, and More), End-User (Consumer Electronics, Retail and Exhibition, and More), and Geography. The Market Forecasts are Provided in Terms of Value (USD).
Global Holographic Display Market Trends and Insights
Automotive OEM adoption of augmented-reality holographic HUDs
German luxury marques and Chinese electric-vehicle brands are integrating full-windshield holographic head-up displays to differentiate premium trims and enhance driver situational awareness. Hyundai Mobis' concept shown at CES 2025 projects navigation cues, alerts, and entertainment content across three viewing zones, and joint development with Zeiss targets mass production by 2027. Market forecasts suggest 7 million automotive units will ship by 2030, converting dashboard real estate into immersive AR canvases.
Deployment of volumetric 3D surgical-planning suites in U.S. tier-1 hospitals
Hospitals are turning to true-depth holograms for oncology, cardiology, and orthopedics. RealView Imaging's HOLOSCOPE-i enables surgeons to manipulate 3D anatomy in real time, trimming planning hours and reducing operating-room errors. Clinical studies show 61% preference for holographic plans over 2D methods, especially for non-coplanar radiotherapy beams.
Scarcity of mass-production micro-LED waveguides elevating BOM costs
Few fabs can achieve the nanoscale tolerances required for efficient waveguides, keeping prices 40-60% above LCD or OLED alternatives. Sample quotes for Sony's 0.44-type Full HD OLED microdisplay exceed USD 260 (JPY 40,000), restricting consumer-device economics.
Other drivers and restraints analyzed in the detailed report include:
- Luxury retail chains in Middle-East malls pivoting to 360° holographic signage
- Live-event and streaming platforms monetizing hologram concerts
- Eye-safety and photobiological regulations limiting projection power
For complete list of drivers and restraints, kindly check the Table Of Contents.
Segment Analysis
Hardware accounted for 74.85% of 2025 revenue, underscoring the capital intensity of spatial-light modulators, laser engines, and precision optics that underpin the holographic display market. Projectors, optical waveguides, and microdisplay engines remain cost drivers, yet falling component prices will push the hardware share of the holographic display market size down modestly by the decade's close. Services already command the fastest 22.32% CAGR as enterprises look for turnkey deployment, calibration, and lifecycle support agreements. Integration specialists bundle on-premises installation, cloud rendering, and training, converting one-off device sales into multi-year contracts. Healthcare networks specify service-level agreements that guarantee uptime for surgical planning suites, while automakers outsource optical system alignment to tier-1 suppliers. The holographic display market is therefore shifting from hardware margin dependency to attached-service annuities.
In parallel, software stacks add real-time rendering, AI-assisted content creation, and analytics, layering subscription revenue atop physical equipment. The trend mimics earlier transitions in the projection and signage industries, where content-management platforms became indispensable. As volumetric streaming proliferates, bandwidth optimization and security patches will further enlarge the services opportunity. Hardware vendors now incubate internal professional-services groups or ally with systems integrators, ensuring tight coupling between optics, firmware, and managed content-an approach that strengthens ecosystem lock-in across the holographic display industry.
Electro-holographic architectures captured 40.25% revenue in 2025 thanks to mature liquid-crystal-on-silicon and reflective spatial-light-modulator supply chains. Stable yields and established design toolsets make the format the safe choice for automotive HUDs and medical scanners, sustaining its lead in the holographic display market. Meanwhile, haptic mid-air systems clock a 24.05% CAGR as developers combine phased-array ultrasounds with volumetric visuals to let users "touch" floating interfaces. Retail podiums that permit gesture-based product rotation and hospital displays allowing sterile interaction exemplify commercial traction.
Laser/plasma projection solutions target extreme-brightness scenarios such as open-air stage shows and dashboard sunlit conditions, while semi-transparent waveguides serve AR smart-glasses. Metasurface optics unveiled by POSTECH help correct chromatic aberration, simplifying color management and slimming device profiles. Acoustic and photon-trap research lines could redefine efficiency, yet commercialization sits beyond the current forecast horizon. Overall, incumbent electro-holographic vendors must innovate on power, resolution, and interaction to fend off fast-rising haptic challengers in the holographic display market.
Complete Report Scope:
- By Component
- Hardware
- Spatial Light Modulators (SLM)
- Projectors and Laser Engines
- Optical/Lens Modules
- Sensors and Cameras
- Others
- Software
- Services
- Integration and Consulting
- Support and Maintenance
- Hardware
- By Technology
- Electro-Holographic
- Touchable/Mid-Air Haptic
- Laser/Plasma
- Semi-Transparent
- Other Emerging (Acoustic, Photon-Trap)
- By Product Type
- Digital Signage and Kiosks
- Smart TVs and Monitors
- Cameras and Smart Glasses
- Medical Scanners and Microscopes
- HUDs and Windshield Displays
- Smartphones and Tablets
- Others
- By End-User
- Consumer Electronics
- Retail and Exhibition
- Media, Entertainment and Live Events
- Healthcare and Medical Education
- Automotive and Transportation
- Military, Defense and Aerospace
- Industrial and Manufacturing
- Education and Training
- By Geography
- North America
- United States
- Canada
- Mexico
- Europe
- Germany
- United Kingdom
- France
- Nordics
- Rest of Europe
- South America
- Brazil
- Rest of South America
- Asia-Pacific
- China
- Japan
- India
- South-East Asia
- Rest of Asia-Pacific
- Middle East and Africa
- Middle East
- Gulf Cooperation Council Countries
- Turkey
- Rest of Middle East
- Africa
- South Africa
- Rest of Africa
- Middle East
- North America
Geography Analysis
Asia Pacific generated 36.55% of 2025 revenue, leveraging China's electric-vehicle boom, Japan's entertainment tech, and South Korea's semiconductor ecosystem. Public-private programs funnel incentives into micro-LED backplanes and metasurface optics, fortifying regional supply dominance. The holographic display market size attributed to Asia Pacific also benefits from dense retail deployments in Tokyo, Seoul, and Shanghai. Europe follows with automotive design wins but faces brightness restrictions that temper growth, although collaborations such as Zeiss-Hyundai sustain innovation pipelines.
North America exhibits steady momentum anchored by U.S. tier-1 hospitals that upgrade surgical visualization suites and defense agencies procuring volumetric mission-planning tables. Canada's live-event promoters experiment with hologram festivals, extending market reach. The Middle East posts the highest 21.18% CAGR through 2031 as luxury malls in Dubai, Riyadh, and Doha invest heavily in 360-degree holographic showcases that elevate brand storytelling. Government smart-city initiatives in Abu Dhabi and Neom foster further experimentation.
Latin America and Africa remain early-stage, constrained by import duties and bandwidth limitations, yet pilot projects in Sao Paulo retail and South African mining visualization hint at downstream expansion. Global supply chains nonetheless route critical waveguide fabrication through Japan and South Korea, exposing all regions to potential bottlenecks, a factor that stakeholders across the holographic display market monitor closely for risk mitigation.
- HYPERVSN (Kino-mo)
- Looking Glass Factory Inc.
- RealFiction Holding AB
- Holoxica Ltd
- RealView Imaging Ltd
- Samsung Electronics Co. Ltd.
- Sony Corporation
- Konica Minolta Inc.
- Qualcomm Technologies Inc.
- Leia Inc.
- Voxon Photonics
- IKIN Inc.
- Zebra Imaging Inc.
- Burton Inc.
- Light Field Lab, Inc.
- SeeReal Technologies GmbH
- Creal SA
- Jade Bird Display Inc.
- Holitech Technology Co., Ltd.
- Shenzhen SMX Display Technology Co., Ltd.
- MDH Hologram Ltd
- Provision Holding Inc
Additional Benefits:
- The market estimate (ME) sheet in Excel format
- 3 months of analyst support
TABLE OF CONTENTS
1 INTRODUCTION
- 1.1 Study Assumptions and Market Definition
- 1.2 Scope of the Study
2 RESEARCH METHODOLOGY
3 EXECUTIVE SUMMARY
4 MARKET LANDSCAPE
- 4.1 Market Overview
- 4.2 Market Drivers
- 4.2.1 Automotive OEM Adoption of Augmented-Reality Holographic HUDs in German and Chinese Premium Segments
- 4.2.2 Surging Deployment of Volumetric 3D Surgical Planning Suites in United States Tier-1 Hospitals
- 4.2.3 Retail Luxury Chains in Middle-East Malls Pivoting to 360° Holographic Signage for Foot-Fall Generation
- 4.2.4 Live-Events and Streaming Platforms Monetising Hologram Concerts, Especially in Japan and South Korea
- 4.2.5 Defense Forces' Battlefield Visualization Programs (U.S., Israel) Accelerating Procurement of Holographic Sand-Tables
- 4.2.6 AI-Generated Content Engines Lowering Production Costs for 3D Holograms Globally
- 4.3 Market Restraints
- 4.3.1 Scarcity of Mass-Production Micro-LED Waveguides Elevating BOM Costs
- 4.3.2 Eye-Safety and Photobiological Regulations Limiting Laser/Plasma Projection Power in EU
- 4.3.3 High Compute and Power Foot-print Hindering Mobile Form-Factors
- 4.3.4 Fragmented 3D Content-Creation Toolchain Slowing Ecosystem Scale-up
- 4.4 Industry Ecosystem Analysis
- 4.5 Technological Outlook
- 4.6 Porter's Five Forces Analysis
- 4.6.1 Bargaining Power of Suppliers
- 4.6.2 Bargaining Power of Buyers
- 4.6.3 Threat of New Entrants
- 4.6.4 Threat of Substitutes
- 4.6.5 Intensity of Competitive Rivalry
5 MARKET SIZE AND GROWTH FORECASTS (VALUES)
- 5.1 By Component
- 5.1.1 Hardware
- 5.1.1.1 Spatial Light Modulators (SLM)
- 5.1.1.2 Projectors and Laser Engines
- 5.1.1.3 Optical/Lens Modules
- 5.1.1.4 Sensors and Cameras
- 5.1.1.5 Others
- 5.1.2 Software
- 5.1.3 Services
- 5.1.3.1 Integration and Consulting
- 5.1.3.2 Support and Maintenance
- 5.1.1 Hardware
- 5.2 By Technology
- 5.2.1 Electro-Holographic
- 5.2.2 Touchable/Mid-Air Haptic
- 5.2.3 Laser/Plasma
- 5.2.4 Semi-Transparent
- 5.2.5 Other Emerging (Acoustic, Photon-Trap)
- 5.3 By Product Type
- 5.3.1 Digital Signage and Kiosks
- 5.3.2 Smart TVs and Monitors
- 5.3.3 Cameras and Smart Glasses
- 5.3.4 Medical Scanners and Microscopes
- 5.3.5 HUDs and Windshield Displays
- 5.3.6 Smartphones and Tablets
- 5.3.7 Others
- 5.4 By End-User
- 5.4.1 Consumer Electronics
- 5.4.2 Retail and Exhibition
- 5.4.3 Media, Entertainment and Live Events
- 5.4.4 Healthcare and Medical Education
- 5.4.5 Automotive and Transportation
- 5.4.6 Military, Defense and Aerospace
- 5.4.7 Industrial and Manufacturing
- 5.4.8 Education and Training
- 5.5 By Geography
- 5.5.1 North America
- 5.5.1.1 United States
- 5.5.1.2 Canada
- 5.5.1.3 Mexico
- 5.5.2 Europe
- 5.5.2.1 Germany
- 5.5.2.2 United Kingdom
- 5.5.2.3 France
- 5.5.2.4 Nordics
- 5.5.2.5 Rest of Europe
- 5.5.3 South America
- 5.5.3.1 Brazil
- 5.5.3.2 Rest of South America
- 5.5.4 Asia-Pacific
- 5.5.4.1 China
- 5.5.4.2 Japan
- 5.5.4.3 India
- 5.5.4.4 South-East Asia
- 5.5.4.5 Rest of Asia-Pacific
- 5.5.5 Middle East and Africa
- 5.5.5.1 Middle East
- 5.5.5.1.1 Gulf Cooperation Council Countries
- 5.5.5.1.2 Turkey
- 5.5.5.1.3 Rest of Middle East
- 5.5.5.2 Africa
- 5.5.5.2.1 South Africa
- 5.5.5.2.2 Rest of Africa
- 5.5.5.1 Middle East
- 5.5.1 North America
6 COMPETITIVE LANDSCAPE
- 6.1 Market Concentration
- 6.2 Strategic Moves
- 6.3 Market Share Analysis
- 6.4 Company Profiles {(includes Global level Overview, Market level Overview, Core Segments, Financials as available, Strategic Information, Market Rank/Share for key companies, Products and Services, and Recent Developments)}
- 6.4.1 HYPERVSN (Kino-mo)
- 6.4.2 Looking Glass Factory Inc.
- 6.4.3 RealFiction Holding AB
- 6.4.4 Holoxica Ltd
- 6.4.5 RealView Imaging Ltd
- 6.4.6 Samsung Electronics Co. Ltd.
- 6.4.7 Sony Corporation
- 6.4.8 Konica Minolta Inc.
- 6.4.9 Qualcomm Technologies Inc.
- 6.4.10 Leia Inc.
- 6.4.11 Voxon Photonics
- 6.4.12 IKIN Inc.
- 6.4.13 Zebra Imaging Inc.
- 6.4.14 Burton Inc.
- 6.4.15 Light Field Lab, Inc.
- 6.4.16 SeeReal Technologies GmbH
- 6.4.17 Creal SA
- 6.4.18 Jade Bird Display Inc.
- 6.4.19 Holitech Technology Co., Ltd.
- 6.4.20 Shenzhen SMX Display Technology Co., Ltd.
- 6.4.21 MDH Hologram Ltd
- 6.4.22 Provision Holding Inc
7 MARKET OPPORTUNITIES AND FUTURE OUTLOOK
- 7.1 White-Space and Unmet-Need Assessment


