

|
시장보고서
상품코드
2121424
모듈형 데이터센터 시장 : 시장 점유율 분석, 업계 동향 및 통계, 성장 예측(2026-2031년)Modular Data Center - Market Share Analysis, Industry Trends & Statistics, Growth Forecasts (2026 - 2031) |
||||||
 Mordor Intelligence
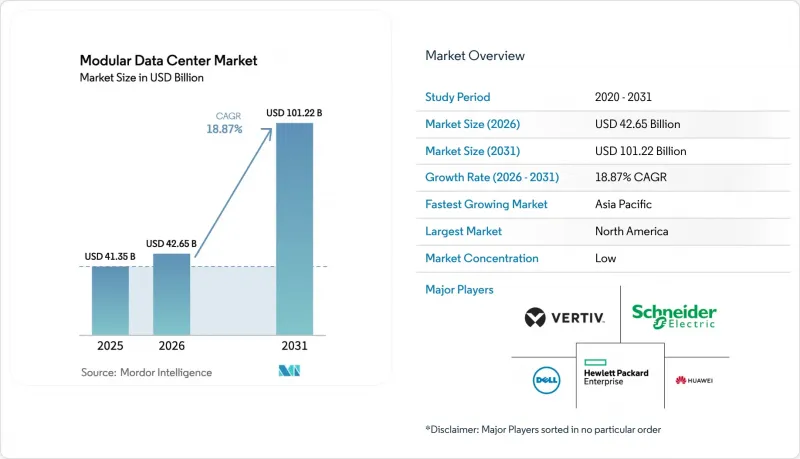
에 의하면, 모듈형 데이터센터 시장 규모는 2025년에 413억 5,000만 달러로 평가되었고, 2026년 426억 5,000만 달러로 추정되고, 2031년까지 1,012억 2,000만 달러에 이를 것으로 예측되며, 예측 기간(2026-2031년) CAGR은 18.87%를 나타낼 전망입니다.
본 보고서는 솔루션 및 서비스별(기능 모듈 솔루션, 서비스), 용도별(재해 복구, 하이퍼스케일 엣지, 데이터센터 확장, 스타터/SMB, AI/GPU 트레이닝 포드, 암호화폐 채굴), 구축 유형별(컨테이너형, 조립식), 도입 유형별(실외, 실내), 지역별(북미, 기타)로 분류되어 있습니다. 시장 예측은 금액(달러) 기준으로 제시되어 있습니다.
세계의 모듈형 데이터센터 시장 동향 및 인사이트
AI 기반 고밀도 수냉식 모듈
그래픽 가속이 수반되는 워크로드에서는 랙 밀도가 40kW를 초과하는 것이 일반화되고 있으나, 이 수준에서는 기존의 공랭식 시스템으로는 에너지 예산을 초과하지 않고 대응할 수 없습니다. 현재, 직접 투 칩(DTC) 콜드 플레이트, 후면 도어 열교환기, 단상 침지 루프가 공장 제조된 섀시 내에 미리 통합된 상태로 출하되고 있으며, 이를 통해 모듈은 현재 700 W 가속기를 수용할 수 있을 뿐만 아니라, 향후 1,000 W 장치에도 대응할 수 있게 되었습니다. 슈나이더 일렉트릭의 ‘액체 대응 오케스트레이션’은 유량과 팬 특성 곡선을 동적으로 제어하여, 기존 공랭식 설계의 1.4에 비해 전력 사용 효율(PUE)을 1.15 수준으로 낮춥니다. Vertiv는 2025년 시범 프로젝트에서 냉각액의 원격 측정과 머신러닝을 통한 고장 예측을 결합하여 시설의 에너지 사용량을 30% 절감했습니다. 이 기술의 도입은 중국의 주권 클라우드 구축으로도 확대되고 있습니다. 이곳에서 ZTE의 모듈은 침지 탱크와 모듈형 전원 트렁크를 결합하여 대규모 언어 모델에 대해 10밀리초 미만의 추론 지연 시간을 유지하고 있습니다. 펌프, 열교환기, 절연액공급망이逼迫하고 있어 리드타임 리스크가 발생하고 있으며, 사업자는 다중 공급원 계약을 통해 이 리스크를 헤지해야 합니다.
엣지 컴퓨팅의 급속한 확산
자율 주행, 컴퓨터 비전 분석, 산업용 IoT에서 10밀리초라는 지연 시간 목표에 따라 컴퓨팅 리소스는 지역의 하이퍼스케일 캠퍼스에서 외부로 확대되고 있습니다. 사전 설계된 유닛은 기존 구축에 소요되는 시간의 3분의 1인 6-9개월 만에 가동을 시작할 수 있어, 이를 통해 사업자는 서비스가 제공되지 않는 대도시권에서 선구자로서의 우위를 확보할 수 있습니다. Hewlett Packard Enterprise(HPE)는 두바이에서 4K 교통 카메라 영상을 처리하는 컨테이너형 셸에 Edgeline 서버를 통합하여 백홀 트래픽을 60% 줄였습니다. 실외 설치용으로 강화된 델의 APEX 노드는 라스트 마일 광섬유 인프라가 부족한 인도 농촌 지역까지 클라우드 기능을 확장하고 있습니다. 2027년까지 5G 기지국 수가 1,000만 개를 넘어설 것으로 예상되는 모바일 네트워크 사업자들은 초고신뢰성·저지연(URLS) 서비스 목표를 유지하기 위해 마이크로 데이터센터를 무선 기지국과 함께 배치하고 있습니다. 그러나 현장 서비스망의 커버리지가 좁고 On-Premise 엔지니어가 부족하기 때문에 아웃오브밴드 모니터링 및 자율 복구 소프트웨어에 대한 의존도가 높아지고 있습니다.
높은 초기 투자 비용(CAPEX)과 벤더 종속성
공장에서의 통합, 포장, 전용 전원 및 냉각 어셈블리로 인해 모듈형 데이터센터는 기존의 홀형 시설에 비해 1메가와트당 20-30%의 추가 비용이 듭니다. 재정 기반이 제한적인 중소기업의 경우, 자금 조달의 장벽이 높기 때문에 워크로드는 자체 개발한 모듈이 아닌 코로케이션 케이지로 이동하고 있습니다. 독자적인 냉각제 매니폴드, 버스웨이, 제어 소프트웨어는 전환 비용을 높이며, 전략적 방향 전환으로 인해 대체 생태계가 필요해질 경우 사업자는 좌초 자산의 위험에 노출될 수 있습니다. 2025년 사업자 조사에 따르면, 5분의 2의 사업자가 주로 락인(lock-in)에 대한 우려를 이유로 도입을 연기하고 있었으며, 제품 라인의 생산 종료 후 부품 조달 가능성에 대해서도 우려를 표명했습니다. 새로운 리스 모델은 자본 지출(CAPEX)을 운영 비용(OPEX)으로 전환하지만, 그 대가로 운영상의 자율성이 훼손되기 때문에 리스크 회피 성향이 강한 기업들은 종종 이러한 거래를 거절하고 있습니다.
부문 분석
2025년에는 기능 모듈형 솔루션이 매출 점유율 65.75%로 1위를 차지했으나, 사업자들이 성과 기반 모델로 전환함에 따라 서비스 부문은 연평균 성장률(CAGR) 19.42%를 나타낼 것으로 예측됩니다. 기업들은 건설 전에 디지털 트윈 시뮬레이션, 열적 병목 현상의 정량화, 중복 공급의 최적화를 수행하기 위해 컨설팅 회사에 의뢰하고 있으며, 소액의 설계 비용을 지불하는 대신 랙이 가득 찼을 때 발생하는 유휴 자본을 줄이고 있습니다. 통합 단계에서는 공장 인수 시험에 액체 루프의 균형 조정 및 유전성 유체 샘플링이 포함되는데, 이는 수천 달러에 달하는 가속기를 파손시킬 수 있는 열 폭주 사고를 미연에 방지하기 위한 조치입니다. 매니지드 서비스 포트폴리오에서는 IoT 텔레메트리, 머신러닝을 통한 고장 예측, 예비 부품 물류가 고정된 연간 요금으로 일괄 제공되며, 예상치 못한 가동 중단 위험이 공급업체 측으로 이전됩니다. 이미 높은 이익률을 자랑하는 이러한 지속적인 수익원을 통해 공급업체는 현장 업그레이드 키트나 순환 재활용 프로그램을 통해 모듈의 수명을 연장하도록 동기를 부여받게 되며, 고객을 여러 세대에 걸친 리프레시 주기에 묶어두는 선순환이 형성되고 있습니다.
그러나 모듈형 데이터센터 시장의 신규 건설 수요에서는 여전히 기능별 모듈이 주류를 차지하고 있습니다. 5-10MW 단위로 단계적인 확장을 도모하는 사업자들은 수주가 확정됨에 따라 부분적으로 확장할 수 있는 독립적인 전원, 냉각, IT 스키드를 선호합니다. 올인원형 컨테이너는 대역폭에 제약이 있는 지역에서 특히 매력적이며, 이러한 지역에서는 여러 하위 시스템을 수입할 경우 관세가 크게 증가할 우려가 있습니다. 리튬 이온 배터리와 UPS 개폐 장치를 결합한 이튼(Eaton)의 ‘xStorage’ 블록은 호주의 마이크로그리드에 도입되어 현장 작업 시간을 절반으로 줄였습니다. 한 공급업체의 모듈형 전원 트렁크와 다른 공급업체의 GPU 포드를 결합할 수 있는 능력 덕분에, 코로케이션 제공업체는 첨단 수냉식 모듈로 인해 공급업체와의 더 깊은 제휴가 요구되는 상황에서도 솔루션을 맞춤화하고 조달에 있어 협상력을 유지할 여지가 생겼습니다.
2025년에는 기존 용량 확장 프로젝트의 점유율이 38.78%를 차지했으나, 하이퍼스케일 엣지, AI, 고성능 컴퓨팅(HPC) 포드는 2031년까지 연평균 성장률(CAGR) 19.87%로 성장하여 다른 모든 이용 사례를 능가할 것으로 예측됩니다. 기업들은 수백 대의 GPU를 수용하는 수냉식 인클로저를 도입하여 기초 모델 훈련 및 자율주행차 시뮬레이션을 수행함으로써, 모델 훈련 주기를 수개월에서 수주로 단축하고 있습니다. 연구 컨소시엄은 유전체학, 기상 시뮬레이션, 전산유체역학(CFD)을 지원하기 위해 모듈식 클러스터를 도입하고 있으며, 보조금 배분 변경 시에도 조달 기간 단축과 이전의 용이성을 이유로 꼽고 있습니다. 일본이나 칠레 등 지진이 빈번하게 발생하는 지역의 재해 복구 의무화로 인해, 기업 캠퍼스 내에 사전에 설치되어 지진 발생 후 몇 시간 이내에 주요 부하를 인수할 준비가 된 유닛에 대한 수요가 증가하고 있습니다.
50-200kW의 IT 부하를 처리할 수 있는 초보자용 데이터센터는 지역 분석 허브를 구축하는 소매업체나 의료 체인으로부터 지지를 얻고 있습니다. 50만-150만 달러의 패키지 가격(대부분 벤더의 금융 지원이 포함되어 있음)은 서버실을 개조하는 내부 비용보다 저렴합니다. 지분 증명(PoS)으로의 전환에 따라 암호화폐 채굴에 대한 관심은 식었지만, 동일한 고밀도 컨테이너가 현재 렌더링 팜 및 엔지니어링 시뮬레이션의 급증하는 부하를 처리하고 있습니다. 전반적으로 AI 중심 워크로드를 위한 모듈형 데이터센터 시장은 2026년부터 2031년 사이에 3배 이상 확대될 전망이며, 이에 따라 벤더의 로드맵은 고밀도 냉각, 초저지연 패브릭, 그리고 차세대 가속기에 전력을 공급할 수 있는 고전압 버스웨이로 재구성될 것입니다.
지역별 분석
북미는 1,500억 달러를 넘는 하이퍼스케일러의 투자에 힘입어 2025년 매출의 40.12%를 차지했습니다. 모듈형 블록 덕분에 클라우드 대기업들은 피닉스, 댈러스, 애틀랜타와 같은 2차 대도시권으로 용량을 확장할 수 있게 되었습니다. 이러한 지역에서는 토지 및 전력 비용이 주요 허브보다 저렴했습니다. 재산세 감면 및 재생에너지 크레딧의 승수 효과를 포함한 주 차원의 우대 조치가 가치 제안을 더욱 강화한 반면, 전력 회사의 ‘중단 가능 요금’을 통해 전기 요금을 15-20% 절감할 수 있었습니다. 아이러니하게도, 이 지역의 보물인 북부 버지니아는 현재 40GW를 초과하는 송전망 여유 용량 부족에 직면해 있어, 개발업체들은 부지에 천연가스 피크 발전소를 설치하거나 가동률 목표를 저해하는 공급 제한을 수용할 수밖에 없는 실정입니다. 캐나다의 각 주는 풍부한 수력 발전을 활용하여 지속가능성을 중시하는 사업자를 퀘벡주와 브리티시컬럼비아주로 유치하는 동시에, 송전 변전소와 병설된 조립식 홀 클러스터를 조성하고 있습니다. 북미 제조업에서 멕시코를 활용한 니어쇼어링의 물결은 몬테레이와 티후아나에서 엣지 컴퓨팅 도입을 다시 활성화시키고 있으며, 이 지역에서는 모듈을 신규 공장과 동일한 일정에 따라 가동할 수 있습니다.
아시아태평양은 각국의 데이터 주권 관련 법령과 재해 복구 역량 강화를 위해 배정된 자본의 뒷받침을 받아, 2026-2031년 연평균 성장률(CAGR) 20.02%를 기록할 전망입니다. 중국의 ‘동부 데이터, 서부 컴퓨팅’ 구상은 풍력 및 태양광 자원이 풍부한 내륙 성으로 워크로드를 이전하고 있으며, 간쑤성이나 닝샤 후이족 자치구에서는 PUE 1.2 미만을 안정적으로 달성하는 모듈형 데이터센터 단지가 잇달아 들어서는 추세입니다. 인도에서는 인센티브를 포함한 전자 산업 진흥 정책에 힘입어 푸네와 하이데라바드에서 데이터센터 건설이 진행 중이며, 현지 시스템 통합사업자들이 국내 클라우드 신생 기업을 대상으로 랙이 적재된 컨테이너를 공급하고 있습니다. 일본 오사카와 후쿠오카의 옥상 설치형 데이터센터는 금융 부문의 재해 복구 수요에 부응하는 것으로, 조립식 구조물 아래에 면진 지지대를 매립하여 지진의 충격을 완화하고 있습니다. 호주에서는 태양광 발전소나 배터리 어레이를 모듈형 데이터센터와 결합함으로써, 운영 사업자가 시설 가동 첫날부터 ‘탄소 중립’을 표방할 수 있게 되었으며, 이는 다국적 기업을 유치하는 데 있어 마케팅상의 우위를 점하고 있습니다.
유럽에서는 열 재이용 및 배출량 공개를 의무화하는 엄격한 환경 규제를 준수하고 있습니다. 프랑크푸르트의 전력망 건설 중단으로 인해 투자가 뮌헨과 함부르크로 이동했으며, 이들 도시에서는 열병합 발전소가 서버의 폐열을 지역 난방에 활용하고 있습니다. 런던은 브렉시트 이후 체결된 데이터 보호 적격성 협정 덕분에 코로케이션 거점으로서의 매력을 유지하고 있으며, 모듈식 확장 시설은 스카이라인을 가리지 않는 위치에 철골 구조의 셸을 건설함으로써 도시 계획상의 반대를 피하고 있습니다. 중동에서는 사우디아라비아의 ‘비전 2030’을 선도적 모델로 삼아, 탄소 제로 에너지와 복합 용도의 지역 냉방을 통합한 ‘NEOM’과 같은 기가 프로젝트가 발표되고 있습니다. 아프리카의 모듈형 시설 규모는 작지만, 나이지리아, 이집트, 남아프리카공화국에 집중되어 있습니다. 태양광·디젤 하이브리드 컨테이너는 불안정한 전력망을 뛰어넘어 수백만 명의 모바일 가입자에게 50밀리초 미만의 지연 시간을 제공합니다. 남미에서는 브라질을 중심으로, 지역별 클라우드 가용성 구역이 전력 구매 계약을 통해 재생에너지로 가동되는 모듈식 블록에 의해 뒷받침되고 있습니다.
기타 혜택 :
- 엑셀 형식 시장 예측(ME) 시트
- 3개월간의 애널리스트 지원
자주 묻는 질문
목차
제1장 서론
제2장 조사 방법
제3장 주요 요약
제4장 시장 구도
제5장 시장 규모 및 성장 예측
제6장 경쟁 구도
제7장 시장 기회 및 향후 전망
AJY 26.09.09According to Mordor Intelligence, the modular data center market size was valued at USD 41.35 billion in 2025 and is estimated to grow from USD 42.65 billion in 2026 to reach USD 101.22 billion by 2031, at a CAGR of 18.87% during the forecast period (2026-2031).
This report is Segmented by Solution and Services (Functional-Module Solution, and Services), Application (Disaster Recovery, Hyperscale Edge, Data Center Expansion, Starter/SMB, AI/GPU Training Pods, and Crypto-Mining), Build Type (Containerized, and Prefabricated), Deployment Type (Outdoor, and Indoor), and Geography (North America, and More). Market Forecasts are Provided in Terms of Value (USD).
Global Modular Data Center Market Trends and Insights
AI-Driven High-Density Liquid-Cool Modules
Graphics-accelerated workloads routinely push rack densities past 40 kW, a level that conventional air systems cannot support without breaching energy budgets. Direct-to-chip cold plates, rear-door heat exchangers, and single-phase immersion loops now ship pre-integrated inside factory-built enclosures, enabling modules to host 700 W accelerators today and roadmap-ready 1,000 W devices tomorrow. Schneider Electric's liquid-aware orchestration dynamically regulates flow rates and fan curves, producing power-usage-effectiveness (PUE) ratios near 1.15, versus 1.4 for legacy air designs. Vertiv pilots in 2025 trimmed facility energy use by 30% by coupling coolant telemetry with machine-learning fault prediction. Adoption is spreading to sovereign-cloud builds in China, where ZTE modules pair immersion baths with modular power trunks, sustaining sub-10 ms inference latency for large-language models. A tightening supply chain for pumps, heat exchangers, and dielectric fluids is creating lead-time risk that operators must hedge through multisourcing contracts.
Rapid Edge-Computing Rollout
Latency targets of 10 ms for autonomous mobility, computer vision analytics, and industrial IoT are pushing compute outward from regional hyperscale campuses. Pre-engineered units can reach power-on in 6 to 9 months, one-third the time of a conventional build, letting operators seize a first-mover advantage in unserved metros. Hewlett Packard Enterprise bundled Edgeline servers into containerized shells that process 4K traffic-camera feeds in Dubai, cutting backhaul payloads by 60%. Dell's APEX nodes, fortified for outdoor deployment, extend cloud functions into rural India where last-mile fiber is sparse. Mobile network operators, on pace to exceed 10 million 5G base stations by 2027, co-locate micro-data centers with radio sites to uphold ultra-reliable low-latency service objectives. Yet thin field-service coverage and a scarcity of on-premises engineers escalate reliance on out-of-band monitoring and autonomous remediation software.
High Upfront CAPEX and Vendor Lock-In
Factory integration, crating, and specialized power or cooling assemblies add a 20-30% premium per megawatt to modular data centers compared to stick-built halls. For small and medium enterprises with limited balance sheets, financing hurdles push workloads toward colocation cages rather than proprietary modules. Proprietary coolant manifolds, busways, and control software harden switching costs, exposing operators to stranded assets if strategic pivots dictate alternative ecosystems. A 2025 operator survey found that two-fifths delayed adoption primarily due to lock-in concerns, and worried about parts availability once product lines sunset. Emerging leasing models shift capex to opex, yet trade off operational autonomy, a bargain risk-averse firms often decline.
Other drivers and restraints analyzed in the detailed report include:
- Hyperscale and Cloud Adoption Surge
- 5G-Triggered Quick-Build Demand
- Grid-Capacity and Permitting Bottlenecks
For complete list of drivers and restraints, kindly check the Table Of Contents.
Segment Analysis
A functional-module solution led with a 65.75% revenue share in 2025, yet services are forecast to post a 19.42% CAGR as operators pivot toward outcome-based models. Enterprises contract advisory firms to simulate digital twins, quantify thermal pinch points, and right-size redundant feeds before construction, trading modest design fees for lower stranded capital once racks fill out. During integration, factory-acceptance tests now include liquid-loop balancing and dielectric-fluid sampling, steps that avert thermal runaway incidents capable of destroying thousand-dollar accelerators. Managed-service portfolios bundle Internet-of-Things telemetry, machine-learning fault prediction, and spare-parts logistics under fixed annual fees, shifting the risk of unplanned downtime to vendors. These annuity streams, already commanding premium margins, motivate suppliers to prolong module lives through field-upgrade kits and circular-reuse programs, embedding a virtuous cycle that locks customers in for multiple refresh generations.
Functional modules, however, continue to dominate greenfield demand inside the modular data center market. Operators staging growth in 5-10 MW tranches prefer discrete power, cooling, and IT skids that expand piecemeal as bookings materialize. All-in-one containers have particular appeal in bandwidth-constrained geographies where importing multiple subsystems can inflate customs fees. Eaton's xStorage block, which couples lithium-ion batteries with UPS switchgear, rolled into Australian microgrids and trimmed on-site labor hours by half. The ability to blend modular power trunks from one vendor with GPU pods from another gives colocation providers room to tailor solutions and preserve sourcing leverage, even as advanced liquid-cool modules push them toward deeper vendor partnerships.
In 2025, conventional capacity-expansion projects held a 38.78% share; yet hyperscale edge, AI, and high-performance-computing (HPC) pods are projected to outgrow every other use case at a 19.87% CAGR through 2031. Enterprises train foundation models or simulate autonomous vehicles by installing liquid-cooled enclosures housing hundreds of GPUs, thereby shrinking model training cycles from months to weeks. Research consortia embedded modular clusters to support genomics, weather simulation, and computational fluid dynamics, citing faster procurement and easier relocation when grant funding shifts. Disaster-recovery mandates in seismic zones such as Japan and Chile sparked demand for units pre-staged on corporate campuses, ready to assume primary loads within hours of an earthquake.
Starter data centers sized for 50-200 kW IT loads resonate with retailers and healthcare chains launching regional analytics hubs. Packaged pricing of USD 500,000-1.5 million, often bundled with vendor financing, undercuts the internal cost of retrofitting server rooms. Crypto-mining interest cooled after proof-of-stake transitions, yet the same high-density containers now cater to rendering farms and engineering simulation bursts. Overall, the modular data center market for AI-centric workloads is set to more than triple between 2026-2031, remapping vendor roadmaps toward higher-density cooling, ultra-low-latency fabrics, and higher-voltage busways capable of powering next-generation accelerators.
Complete Report Scope:
- By Solution and Services
- Functional-Module Solution
- Individual Module
- All-in-One Module
- Services
- Consulting and Design
- Integration and Deployment
- Managed and Maintenance
- Functional-Module Solution
- By Application
- Disaster Recovery
- Hyperscale Edge / AI and High-Performance Computing
- Data Center Expansion
- Starter / SMB Data Centers
- AI / GPU Training Pods
- Crypto-Mining and HPC Containers
- By Build Type
- Containerized
- Prefabricated Modules
- By Deployment Type
- Outdoor Modular (Skid-Mounted)
- Indoor Modular (All-in-One Solutions)
- By Geography
- North America
- United States
- Canada
- Mexico
- South America
- Brazil
- Argentina
- Rest of South America
- Europe
- Germany
- France
- United Kingdom
- Italy
- Spain
- Rest of Europe
- Asia-Pacific
- China
- Japan
- India
- South Korea
- Australia
- Rest of Asia-Pacific
- Middle East and Africa
- Middle East
- Saudi Arabia
- United Arab Emirates
- Turkey
- Rest of Middle East
- Africa
- South Africa
- Egypt
- Nigeria
- Rest of Africa
- Middle East
- North America
Geography Analysis
North America preserved 40.12% of 2025 revenue, anchored by hyperscaler outlays topping USD 150 billion. Modular blocks enabled cloud titans to seed capacity in secondary metros such as Phoenix, Dallas, and Atlanta, where land and power costs undercut those in headline hubs. State-level incentives, including property-tax abatements and renewable-credit multipliers, sharpened the value proposition, while utility interruptible tariffs shaved 15-20% off electricity bills. Ironically, the region's crown jewel, Northern Virginia, now fights grid headroom shortages exceeding 40 GW, leading developers to bolt natural-gas peakers to sites or accept curtailments that dent uptime targets. Canada's provinces capitalize on abundant hydropower, luring sustainability-oriented operators to Quebec and British Columbia and spawning a cluster of prefabricated halls co-located with transmission substations. Mexico's near-shoring wave for North American manufacturing is reviving edge adoption in Monterrey and Tijuana, where modules can be commissioned on the same timeline as new factories.
Asia-Pacific is primed for a 20.02% CAGR over 2026-2031, driven by national data-sovereignty edicts and capital earmarked for disaster resilience. China's "East Data, West Computing" scheme diverts workloads to inland provinces flush with wind and solar, sparking modular parks in Gansu and Ningxia that routinely post sub-1.2 PUE. India's incentive-laden electronics push seeds data-center builds in Pune and Hyderabad, with local integrators supplying racked-and-stacked containers to domestic cloud challengers. Japan's rooftop installations in Osaka and Fukuoka cater to financial-sector disaster recovery, embedding seismic isolation bearings beneath prefabs to cushion quake shocks. Australia couples solar farms and battery arrays with modules, allowing operators to brand facilities "carbon neutral" from day one, a marketing edge when courting multinational tenants.
Europe navigates stringent environmental regulations mandating heat reuse and emissions disclosure. Frankfurt's power-grid moratorium rerouted investment to Munich and Hamburg, where combined-heat-and-power plants siphon server exhaust for district heating. London maintains colocation magnetism thanks to post-Brexit data-adequacy accords, and modular extensions slip past planning objections by erecting steel-framed shells below skyline sightlines. The Middle East, spearheaded by Saudi Arabia's Vision 2030, announces giga-projects such as NEOM that integrate carbon-free energy and mixed-use district cooling. Africa's modular footprint, although small, clusters in Nigeria, Egypt, and South Africa; solar-diesel hybrid containers leapfrog dicey grids to deliver sub-50 ms latency to millions of mobile subscribers. South America rallies around Brazil, where regional cloud availability zones hinge on modular blocks powered by renewable energy through power purchase agreements.
- Vertiv Holdings Co.
- Schneider Electric SE
- Huawei Technologies Co. Ltd.
- Dell Technologies Inc.
- Hewlett Packard Enterprise Co.
- IBM Corporation
- Rittal GmbH and Co. KG
- Eaton Corporation plc
- Delta Electronics Inc.
- ABB Ltd.
- Cannon Technologies Ltd.
- Baselayer Technology LLC
- Bladeroom Group Ltd.
- Instant Data Centers LLC
- Colt Data Centre Services
- EdgeConneX Inc.
- PCX Holding LLC
- Cisco Systems Inc.
- ZTE Corporation
- Aspen Systems Inc.
- DATAPOD Pty Ltd.
- Synergy Associates
- Johnson Controls International plc (Silent-Aire)
- Amazon Web Services Inc.
Additional Benefits:
- The market estimate (ME) sheet in Excel format
- 3 months of analyst support
TABLE OF CONTENTS
1 INTRODUCTION
- 1.1 Study Assumptions and Market Definition
- 1.2 Scope of the Study
2 RESEARCH METHODOLOGY
3 EXECUTIVE SUMMARY
4 MARKET LANDSCAPE
- 4.1 Market Overview
- 4.2 Market Drivers
- 4.2.1 Rapid Edge-Computing Rollout
- 4.2.2 Hyperscale and Cloud Adoption Surge
- 4.2.3 5G-Triggered Quick-Build Demand
- 4.2.4 AI-Driven High-Density Liquid-Cool Modules
- 4.2.5 Data-Sovereignty Micro-Regional Builds
- 4.2.6 Circular Economy Mandates Driving Modular Reuse
- 4.3 Market Restraints
- 4.3.1 High Upfront CAPEX and Vendor Lock-In
- 4.3.2 Power-Efficiency and Sustainability Gaps
- 4.3.3 Limited Customisation for Mega-Facilities
- 4.3.4 Grid-Capacity and Permitting Bottlenecks
- 4.4 Industry Value Chain Analysis
- 4.5 Technological Outlook
- 4.6 Regulatory Landscape
- 4.7 Porter's Five Forces Analysis
- 4.7.1 Bargaining Power of Suppliers
- 4.7.2 Bargaining Power of Buyers
- 4.7.3 Threat of New Entrants
- 4.7.4 Threat of Substitutes
- 4.7.5 Intensity of Competitive Rivalry
- 4.8 Sustainability and Energy-Efficiency Trends
- 4.9 Investment and Financing
- 4.10 Impact of Macroeconomic Trends on the Market
5 MARKET SIZE AND GROWTH FORECASTS (VALUE)
- 5.1 By Solution and Services
- 5.1.1 Functional-Module Solution
- 5.1.1.1 Individual Module
- 5.1.1.2 All-in-One Module
- 5.1.2 Services
- 5.1.2.1 Consulting and Design
- 5.1.2.2 Integration and Deployment
- 5.1.2.3 Managed and Maintenance
- 5.1.1 Functional-Module Solution
- 5.2 By Application
- 5.2.1 Disaster Recovery
- 5.2.2 Hyperscale Edge / AI and High-Performance Computing
- 5.2.3 Data Center Expansion
- 5.2.4 Starter / SMB Data Centers
- 5.2.5 AI / GPU Training Pods
- 5.2.6 Crypto-Mining and HPC Containers
- 5.3 By Build Type
- 5.3.1 Containerized
- 5.3.2 Prefabricated Modules
- 5.4 By Deployment Type
- 5.4.1 Outdoor Modular (Skid-Mounted)
- 5.4.2 Indoor Modular (All-in-One Solutions)
- 5.5 By Geography
- 5.5.1 North America
- 5.5.1.1 United States
- 5.5.1.2 Canada
- 5.5.1.3 Mexico
- 5.5.2 South America
- 5.5.2.1 Brazil
- 5.5.2.2 Argentina
- 5.5.2.3 Rest of South America
- 5.5.3 Europe
- 5.5.3.1 Germany
- 5.5.3.2 France
- 5.5.3.3 United Kingdom
- 5.5.3.4 Italy
- 5.5.3.5 Spain
- 5.5.3.6 Rest of Europe
- 5.5.4 Asia-Pacific
- 5.5.4.1 China
- 5.5.4.2 Japan
- 5.5.4.3 India
- 5.5.4.4 South Korea
- 5.5.4.5 Australia
- 5.5.4.6 Rest of Asia-Pacific
- 5.5.5 Middle East and Africa
- 5.5.5.1 Middle East
- 5.5.5.1.1 Saudi Arabia
- 5.5.5.1.2 United Arab Emirates
- 5.5.5.1.3 Turkey
- 5.5.5.1.4 Rest of Middle East
- 5.5.5.2 Africa
- 5.5.5.2.1 South Africa
- 5.5.5.2.2 Egypt
- 5.5.5.2.3 Nigeria
- 5.5.5.2.4 Rest of Africa
- 5.5.5.1 Middle East
- 5.5.1 North America
6 COMPETITIVE LANDSCAPE
- 6.1 Market Concentration
- 6.2 Strategic Moves
- 6.3 Market Share Analysis
- 6.4 Company Profiles (includes Global Level Overview, Market Level Overview, Core Segments, Financials as available, Strategic Information, Market Rank/Share for Key Companies, Products and Services, and Recent Developments)
- 6.4.1 Vertiv Holdings Co.
- 6.4.2 Schneider Electric SE
- 6.4.3 Huawei Technologies Co. Ltd.
- 6.4.4 Dell Technologies Inc.
- 6.4.5 Hewlett Packard Enterprise Co.
- 6.4.6 IBM Corporation
- 6.4.7 Rittal GmbH and Co. KG
- 6.4.8 Eaton Corporation plc
- 6.4.9 Delta Electronics Inc.
- 6.4.10 ABB Ltd.
- 6.4.11 Cannon Technologies Ltd.
- 6.4.12 Baselayer Technology LLC
- 6.4.13 Bladeroom Group Ltd.
- 6.4.14 Instant Data Centers LLC
- 6.4.15 Colt Data Centre Services
- 6.4.16 EdgeConneX Inc.
- 6.4.17 PCX Holding LLC
- 6.4.18 Cisco Systems Inc.
- 6.4.19 ZTE Corporation
- 6.4.20 Aspen Systems Inc.
- 6.4.21 DATAPOD Pty Ltd.
- 6.4.22 Synergy Associates
- 6.4.23 Johnson Controls International plc (Silent-Aire)
- 6.4.24 Amazon Web Services Inc.
7 MARKET OPPORTUNITIES AND FUTURE OUTLOOK
- 7.1 White-Space and Unmet-Need Assessment


