

|
시장보고서
상품코드
2121563
말레이시아의 전력 : 시장 점유율 분석, 업계 동향과 통계, 성장 예측(2026-2031년)Malaysia Power - Market Share Analysis, Industry Trends & Statistics, Growth Forecasts (2026 - 2031) |
||||||
 Mordor Intelligence
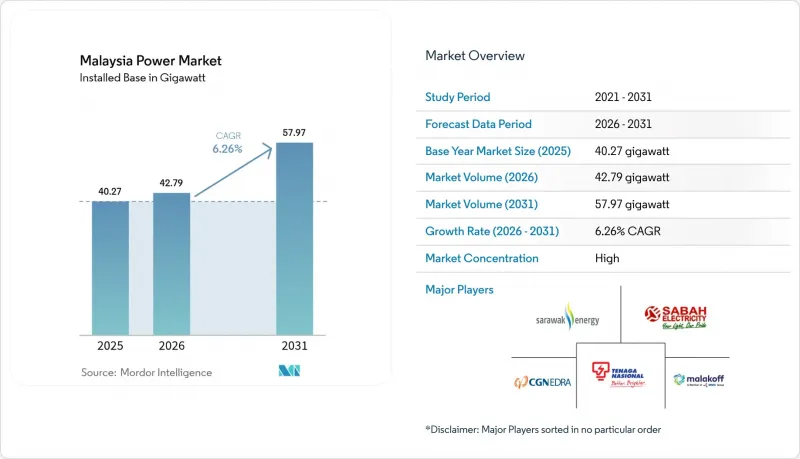
Mordor Intelligence에 따르면 말레이시아의 전력 시장 규모는 2026년에 42.79기가와트로 추정되며, 2025년 40.27기가와트에서 확대되어, 2031년에는 57.97기가와트에 달할 것으로 예측됩니다.
2026년부터 2031년까지 연평균 성장률(CAGR) 6.26%로 성장할 것으로 전망됩니다.
본 보고서는 발전원(화력, 원자력, 재생에너지) 및 최종사용자(유틸리티, 상업·산업용, 가정용)별로 분류되어 있습니다. 시장 규모 및 전망은 설치 용량(GW) 단위로 표시되어 있습니다.
말레이시아 전력 시장의 동향 및 분석
산업용 전력 수요의 급증
크림에 위치한 인피니온(Infineon)의 20억 유로 규모의 실리콘 카바이드 팹은 기존의 석유화학 산업에서 현재 말레이시아 전력 시장의 기반이 되고 있는 정밀 제조 산업으로의 구조적 전환을 상징합니다. TNB는 데이터센터 용도만으로도 총 11기가와트에 달할 것으로 확인했으며, 이에 따라 이 회사는 예상치 못한 부하 증가에 대비하여 163억 링깃의 조건부 설비 투자 중 30%를 확보할 수밖에 없게 되었습니다. 2030년까지 산업용 수요는 총 소비량의 절반을 계속 차지할 것으로 예상되지만, 그 구성은 저탄소 전력을 필요로 하는 반도체 및 클라우드 워크로드로 이동하고 있습니다. 발전 및 송전망 구축에 차질이 생기면, 보다 선진적인 재생에너지 조달 체계를 갖춘 지역의 경쟁사들에게 이러한 투자를 빼앗길 위험이 있습니다. 그 결과, 지방 자치 단체는 예비율을 적절한 수준으로 유지하기 위해 변전소 업그레이드를 서둘러 진행하고, 배터리 저장 시스템 도입을 장려하고 있습니다.
재생에너지 설비 용량 목표
‘국가 에너지 전환 로드맵’에서는 2025년까지 재생에너지 발전 용량을 31%, 2035년까지 40%로 늘리겠다는 목표가 제시되어 있습니다. 이러한 목표를 달성하려면 연간 약 1.5 GW의 신규 설비 도입이 필요하며, 이는 과거의 건설 속도를 크게 상회하는 수준입니다. 2024년 ‘대규모 태양광발전 제5차 입찰’에서는 말레이시아 자본을 가진 입찰자에게 2 GW가 배정되어 국내 콘텐츠 확보가 우선시된 반면, 개발업체의 선택지는 좁아졌습니다. TNB가 수력발전용 저수지에서 전개하는 2.5 GW 규모의 부유식 태양광발전 프로그램은 기존 송전 회랑을 활용하여 토지 이용상의 충돌을 최소화하고 있습니다. 한편, 사라왁 에너지의 7,300 MW 규모 수력발전 설비군은 국경을 넘는 송전망 연결이 진전된다면, 동말레이시아를 잠재적인 청정 전력 수출국으로 자리매김하게 될 것입니다. 2050년까지 재생에너지 비중을 70%로 늘리겠다는 목표는 석탄 화력발전을 거의 제로 수준으로 줄이는 것을 의미하며, 수소 대응 복합 사이클 가스 터빈이 가교 기술로 기능할 전망이지만, 연료 공급의 불확실성은 여전히 남아 있습니다.
천연가스 공급 제약과 가격 변동
국내 가스 생산량은 정점에 도달한 상태이며, 페트로나스가 LNG 수출을 우선시하고 있어 주기적인 연료 부족이 발생하고, 발전 사업자들은 더 비싼 디젤을 이용한 백업 발전으로 전환할 수밖에 없는 실정입니다. 2022년 세계 LNG 가격이 급등했을 때, 말레이시아의 요금 전가 메커니즘은 연료비 상승을 따라가지 못해 IPP(독립 발전 사업자)의 이익률을 압박했습니다. 계획된 수소 대응 터빈은 그린 수소가 점차 천연가스를 대체할 것이라는 전제를 바탕으로 하고 있지만, 산업 규모의 수소 인프라는 여전히 초기 단계에 머물러 있습니다. 저장, 수입, 가격 책정에 관한 개혁이 조화롭게 실현되지 않는 한, 천연가스에 대한 의존은 유연성이 높은 화력 발전 자산에 대한 투자자의 의욕을 저해하고, 말레이시아 전력 시장 확대 속도를 둔화시키는 요인이 될 것입니다.
부문별 분석
말레이시아 재생에너지 시장 규모는 연평균 성장률(CAGR) 22.89%로 확대될 것으로 예측되며, 2025년에는 말레이시아 전력 시장의 74.92%를 차지하는 화력 발전의 점유율을 잠식하게 될 것입니다. 재생에너지의 급속한 성장을 주도하는 것은 태양광발전이며, TNB의 2.5GW 부유식 태양광발전 도입과 ‘대규모 태양광발전 제5차 공모’에서 배정된 2GW 용량이 이를 뒷받침하고 있습니다. 수력발전은 동말레이시아에서 여전히 중요한 위치를 차지하고 있지만, 그 확대는 환경 영향 평가 및 지역 사회와의 대화를 통해 제약을 받고 있습니다. 석탄 화력 발전은 급격히 감소할 전망이며, 2030년까지 9.1 GW가 폐지될 예정이지만, 수소 대응 가스 터빈이 예비율을 향상시켜 미래의 연료 전환을 위한 송전망 준비를 갖추고 있습니다. 축전지 도입이 중요한 열쇠가 될 것입니다. 충분한 축전 용량이 확보된다면 태양광발전 도입률을 높일 수 있지만, 부족할 경우 중출력 가스 화력 발전소의 가동 시간이 길어지게 됩니다.
태양광발전의 균등화 발전 비용은 축전 설비를 도입하기 전부터 2024년에 가스 발전의 한계 비용을 밑돌게 되어, IPP(독립 발전 사업자)가 전력 회사의 입찰에 더해 기업 대상 PPA(전력 구매 계약)를 축적하는 움직임을 뒷받침하고 있습니다. 사라왁 주의 수력발전 자산은 낮은 변동 비용으로 베이스로드에 가까운 전력을 공급하고 있으며, 계통연계가 실현된다면 해당 주는 잠재적인 전력 수출지가 될 전망입니다. 풍력 및 지열발전은 여전히 시험 단계에 있으며, 바이오매스 발전의 확대는 원료 가격 급등으로 인해 주춤하고 있습니다. 이러한 전력 구성의 변화는 말레이시아 전력 시장 전체의 발전 순서, 배출 강도 및 투자 배분에 영향을 미칠 것입니다.
기타 혜택:
- Excel 형식의 시장 예측(ME) 시트
- 3개월간의 애널리스트 지원
자주 묻는 질문
목차
제1장 소개
제2장 분석 방법
제3장 주요 요약
제4장 시장 구도
제5장 시장 규모·성장률 예측
제6장 경쟁 구도
제7장 시장 기회와 향후 전망
KSM 26.09.07According to Mordor Intelligence, Malaysia power market size in 2026 is estimated at 42.79 gigawatt, growing from 2025 value of 40.27 gigawatt with 2031 projections showing 57.97 gigawatt, growing at 6.26% CAGR over 2026-2031.
This report is Segmented by Power Source (Thermal, Nuclear, and Renewables) and End-User (Utilities, Commercial and Industrial, and Residential). The Market Sizes and Forecasts are Provided in Terms of Installed Capacity (GW).
Malaysia Power Market Trends and Insights
Industrial Electricity-Demand Surge
Infineon's EUR 2 billion silicon-carbide fab in Kulim exemplifies the structural shift from legacy petrochemicals toward precision manufacturing that now underpins the Malaysian power market. TNB has confirmed that data-center applications alone total 11 GW, compelling the utility to reserve 30% of its RM 16.3 billion contingent capital expenditure for unanticipated load growth. Industrial demand is expected to maintain half of total consumption through 2030, but the composition tilts toward semiconductor and cloud workloads that require low-carbon electricity. Any lapse in generation or transmission build-out risks divesting these investments to regional competitors with more advanced renewable procurement frameworks. Consequently, local authorities are fast-tracking substation upgrades and incentivizing battery storage to keep reserve margins adequate.
Renewable-Energy Capacity Targets
The National Energy Transition Roadmap sets milestones of 31% renewable capacity by 2025 and 40% by 2035. Achieving these goals requires annual additions near 1.5 GW, notably faster than historical build-out rates. Large-Scale Solar Round 5 allocated 2 GW in 2024 to Malaysian-controlled bidders, favoring domestic content capture but narrowing the developer field. TNB's 2.5 GW floating-solar program across hydro reservoirs leverages existing transmission corridors and minimizes land-use conflicts, while Sarawak Energy's 7,300 MW hydro fleet positions East Malaysia as a potential clean-power exporter once cross-border interconnections advance. The 70% renewable aspiration by 2050 implies near-zero coal, with hydrogen-ready combined-cycle gas turbines providing a bridge technology, albeit with fuel-supply uncertainties.
Natural-Gas Supply Constraints and Price Volatility
Domestic gas production has plateaued, and Petronas prioritizes LNG exports, resulting in periodic fuel shortages that force generators to switch to costlier diesel back-up.When global LNG prices spiked in 2022, Malaysia's tariff-pass-through mechanism lagged fuel costs, compressing IPP margins. Planned hydrogen-ready turbines assume green hydrogen will gradually displace gas, yet industrial-scale hydrogen infrastructure remains nascent. Unless coordinated storage, import, and pricing reforms materialize, gas exposure will weigh on Malaysia's power market expansion speed by suppressing investor appetite for flexible thermal assets.
Other drivers and restraints analyzed in the detailed report include:
- Aging Coal-Fleet Retirements Triggering Replacement Build-Outs
- Hyperscale Data-Center Clusters Driving Load Pockets
- Electricity-Tariff Subsidy Reforms
For complete list of drivers and restraints, kindly check the Table Of Contents.
Segment Analysis
The Malaysian power market size for renewables is projected to rise at a 22.89% CAGR, eating into thermal technology's 74.92% Malaysia power market share in Malaysia in 2025. Solar leads the renewable surge, propelled by TNB's 2.5 GW floating-solar roll-out and 2 GW of allocated capacity under Large-Scale Solar Round 5. Hydro remains pivotal in East Malaysia, yet expansion is bound by environmental assessment and community engagement. Coal will decline sharply, with 9.1 GW scheduled to retire by 2030, while hydrogen-ready gas turbines pick up reserve margins and prepare the grid for future fuel transitions. Battery storage adoption becomes a gating factor: adequate storage unlocks higher solar penetration, while shortfalls would keep mid-merit gas plants online longer.
Solar's levelized cost fell below marginal gas generation in 2024, even before storage, encouraging IPPs to stack corporate PPAs on top of utility tenders. Hydro assets in Sarawak supply near-baseload output at low variable cost, positioning the state as a potential exporter pending interconnection. Wind and geothermal remain exploratory, and biomass expansion slows due to rising feedstock prices. The evolving mix will influence dispatch order, emissions intensity, and investment allocation across the Malaysia power market.
Complete Report Scope:
- By Power Source
- Thermal (Coal, Natural Gas, Oil and Diesel)
- Nuclear
- Renewables (Solar, Wind, Hydro, Geothermal, Biomass & Waste, Tidal)
- By End User
- Utilities
- Commercial and Industrial
- Residential
- By T&D Voltage Level (Qualitative Analysis only)
- High-Voltage Transmission (Above 230 kV)
- Sub-Transmission (69 to 161 kV)
- Medium-Voltage Distribution (13.2 to 34.5 kV)
- Low-Voltage Distribution (Up to 1 kV)
List of Companies Covered in this Report:
- Tenaga Nasional Berhad (TNB)
- Sarawak Energy Berhad
- Sabah Electricity Sdn Bhd (SESB)
- Edra Power Holdings
- Malakoff Corporation Berhad
- YTL Power International
- Genting Sanyen Power
- Petronas Power Sdn Bhd
- Cypark Resources Berhad
- Solarvest Holdings Berhad
- ERS Energy Sdn Bhd
- Verdant Solar
- LYS Energy Group
- Pathgreen Energy Sdn Bhd
- Sunway Construction Group Bhd (RE EPC)
- JinkoSolar (Malaysia Module Fab)
- First Solar Malaysia
- KEPCO Engineering & Construction
- Huawei Digital Power Malaysia
- Siemens Energy Malaysia
Additional Benefits:
- The market estimate (ME) sheet in Excel format
- 3 months of analyst support
TABLE OF CONTENTS
1 Introduction
- 1.1 Study Assumptions & Market Definition
- 1.2 Scope of the Study
2 Research Methodology
3 Executive Summary
4 Market Landscape
- 4.1 Market Overview
- 4.2 Market Drivers
- 4.2.1 Industrial electricity-demand surge
- 4.2.2 Renewable-energy capacity targets (31 % by 2025; 40 % by 2035)
- 4.2.3 Aging coal-fleet retirements triggering replacement build-outs
- 4.2.4 Grid-modernisation & T&D capex push
- 4.2.5 Corporate PPAs enabled by Third-Party Access rules
- 4.2.6 Hyperscale data-centre clusters driving load pockets
- 4.3 Market Restraints
- 4.3.1 Natural-gas supply constraints & price volatility
- 4.3.2 Electricity-tariff subsidy reforms
- 4.3.3 Land & permitting hurdles for utility-scale RE
- 4.3.4 Curtailment risk in East-Malaysia weak grids
- 4.4 Supply-Chain Analysis
- 4.5 Regulatory Landscape
- 4.6 Technological Outlook (Smart grid, hydrogen-ready CCGT, BESS)
- 4.7 Porters Five Forces
- 4.7.1 Threat of New Entrants
- 4.7.2 Bargaining Power of Suppliers
- 4.7.3 Bargaining Power of Buyers
- 4.7.4 Threat of Substitutes
- 4.7.5 Competitive Rivalry
- 4.8 PESTLE Analysis
5 Market Size & Growth Forecasts
- 5.1 By Power Source
- 5.1.1 Thermal (Coal, Natural Gas, Oil and Diesel)
- 5.1.2 Nuclear
- 5.1.3 Renewables (Solar, Wind, Hydro, Geothermal, Biomass & Waste, Tidal)
- 5.2 By End User
- 5.2.1 Utilities
- 5.2.2 Commercial and Industrial
- 5.2.3 Residential
- 5.3 By T&D Voltage Level (Qualitative Analysis only)
- 5.3.1 High-Voltage Transmission (Above 230 kV)
- 5.3.2 Sub-Transmission (69 to 161 kV)
- 5.3.3 Medium-Voltage Distribution (13.2 to 34.5 kV)
- 5.3.4 Low-Voltage Distribution (Up to 1 kV)
6 Competitive Landscape
- 6.1 Market Concentration
- 6.2 Strategic Moves (M&A, Partnerships, PPAs)
- 6.3 Market Share Analysis (Market Rank/Share for key companies)
- 6.4 Company Profiles (includes Global level Overview, Market level overview, Core Segments, Financials as available, Strategic Information, Products & Services, and Recent Developments)
- 6.4.1 Tenaga Nasional Berhad (TNB)
- 6.4.2 Sarawak Energy Berhad
- 6.4.3 Sabah Electricity Sdn Bhd (SESB)
- 6.4.4 Edra Power Holdings
- 6.4.5 Malakoff Corporation Berhad
- 6.4.6 YTL Power International
- 6.4.7 Genting Sanyen Power
- 6.4.8 Petronas Power Sdn Bhd
- 6.4.9 Cypark Resources Berhad
- 6.4.10 Solarvest Holdings Berhad
- 6.4.11 ERS Energy Sdn Bhd
- 6.4.12 Verdant Solar
- 6.4.13 LYS Energy Group
- 6.4.14 Pathgreen Energy Sdn Bhd
- 6.4.15 Sunway Construction Group Bhd (RE EPC)
- 6.4.16 JinkoSolar (Malaysia Module Fab)
- 6.4.17 First Solar Malaysia
- 6.4.18 KEPCO Engineering & Construction
- 6.4.19 Huawei Digital Power Malaysia
- 6.4.20 Siemens Energy Malaysia
7 Market Opportunities & Future Outlook
- 7.1 White-space & Unmet-Need Assessment


