|
시장보고서
상품코드
2121572
스마트 팩토리 : 시장 점유율 분석, 업계 동향과 통계, 성장 예측(2026-2031년)Smart Factory - Market Share Analysis, Industry Trends & Statistics, Growth Forecasts (2026 - 2031) |
||||||
 Mordor Intelligence
Mordor Intelligence에 따르면 스마트 팩토리 시장 규모는 2025년에 3,855억 5,000만 달러로 평가되며, 2026년 4,266억 6,000만 달러에서 2031년까지 6,758억 2,000만 달러에 달할 것으로 예측되며, 2026년부터 2031년까지 예측 기간의 CAGR은 9.64%가 될 전망입니다.
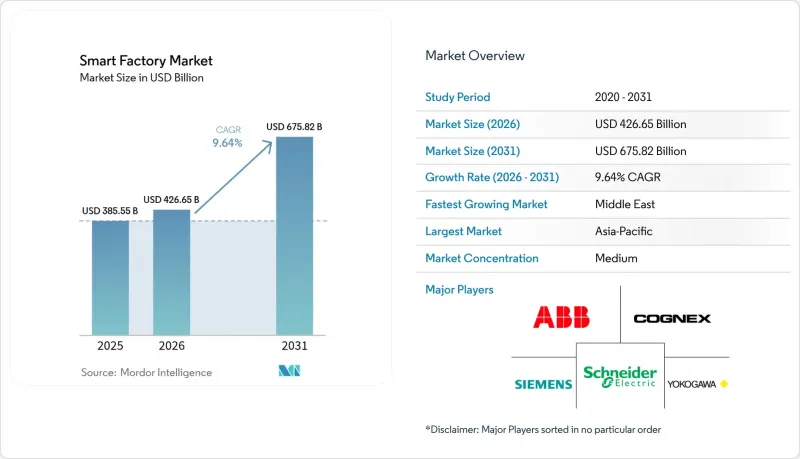
본 보고서는 제품 유형(머신비전 시스템, 산업용 로봇, 제어 장치, 센서, 통신 기술, 기타 제품 유형), 기술(PLM, HMI, ERP, MES, DCS, SCADA, 기타), 최종사용자 산업(자동차, 반도체, 석유·가스, 기타), 구축 방식(온프레미스, 클라우드 기반), 및 지역별로 분류되어 있습니다. 시장 예측은 금액(달러) 기준으로 제시되어 있습니다.
세계 스마트 팩토리 시장의 동향 및 인사이트
산업용 IoT 플랫폼 도입 확대
산업용 IoT 플랫폼은 PLC, 감시 제어 시스템, ERP 계층의 데이터를 단일 저장소로 통합합니다. 지멘스는 2025년 자사의 MindSphere 클라우드에 120만 건 이상의 자산을 연결했으며, 이는 2024년 대비 40% 증가한 수치입니다. 타임 센시티브 네트워킹(TSN) 상에서 OPC 통합 아키텍처를 실행하는 엣지 게이트웨이는 현재 1밀리초 미만의 지연 시간을 지원하므로, 예측 알고리즘을 통해 예기치 못한 가동 중지 시간을 25-35% 줄일 수 있게 되었습니다. 또한, 구독형 가격 정책을 통해 자본 지출이 운영비로 전환됨에 따라 중소 제조업체의 이용 문호가 넓어지고 있습니다. 그 결과, 인공지능(AI), 디지털 트윈, 자율적인 워크플로우를 지원할 수 있는 도입 기반이 마련되었습니다.
스마트 제조를 위한 정부의 인센티브 확대
베이징에서 리야드에 이르는 재정 프로그램이 자동화에 수반되는 위험을 상쇄하고 있습니다. 중국은 2024년부터 2026년까지 스마트 제조로의 업그레이드를 위해 2,000억 위안(280억 달러)을 배정했습니다. 사우디아라비아의 ‘비전 2030’에서는 2025년에 석유화학 및 광업 시설을 위해 150억 사우디아라비아 리얄(40억 달러)을 배정했으며,인도의 ‘생산 연계형 인센티브(PLI)’ 제도에서는 자동화 설비에 대해 6-8%의 리베이트가 적용됩니다. 미국이나 독일의 가속 상각 규정에 따라 중소기업의 투자 회수 기간이 단축되어, 자본 제약이 있는 부문에서도 도입률이 향상되고 있습니다.
부문별 분석
산업용 로봇은 2025년 매출의 28.41%를 차지하며, 제품 카테고리 중 스마트 팩토리 시장에서 가장 큰 점유율을 기록했습니다. 한편, 코봇은 연평균 성장률(CAGR) 10.27%로 확대되고 있으며, 자동차 및 제약 업계의 생산 라인에서 울타리가 없는 유연한 자동화가 선호됨에 따라 2031년까지 스마트 팩토리 시장 규모에서 점유율을 확대해 나갈 것으로 예측됩니다. 유니버설 로보틱스(Universal Robotics)에 따르면, 2025년 중소기업의 코봇 도입은 전년 대비 35% 증가했습니다.
보완적인 장치 전반에 걸쳐 제어 구성요소는 정밀한 구동을 실현하고, 멀티모달 센서는 조건에 따른 모니터링을 위한 실시간 데이터 스트림을 생성합니다. EtherCAT과 같은 유선 프로토콜이 결정론적 모션 제어를 주도하는 반면, 5G는 모바일 플랫폼 및 개조 시나리오를 지원합니다. 하드웨어, 소프트웨어 및 통합 서비스는 라이프사이클의 가치를 확대하는 풀스택 솔루션으로 융합되고 있습니다.
2025년 지출 중 제조 실행 시스템(MES)이 24.18%를 차지한 반면, 고급 분석 및 인공지능(AI) 플랫폼은 연평균 성장률(CAGR) 10.31%로 성장하고 있어, 스마트 팩토리 시장 규모가 처방형 소프트웨어로 빠르게 재분배되고 있음을 보여줍니다. SAP의 ‘Digital Manufacturing Cloud’는 2025년에 800개 이상의 고객을 확보했습니다.
분산 제어 시스템과 PLC는 실시간 루프에서 여전히 필수적이지만, 컨테이너화된 애플리케이션을 호스팅하는 엣지 컨트롤러를 통해 하이브리드 워크로드가 가능해졌습니다. 증강 현실(AR) 인터페이스는 평균 수리 시간(MTTR)을 단축하고, 디지털 트윈 시뮬레이터는 시운전 기간을 단축합니다. 오픈 API(애플리케이션 프로그래밍 인터페이스)는 새로운 모듈을 얼마나 신속하게 배포할 수 있는지를 결정하며, 경쟁력을 좌우합니다.
지역별 분석
아시아태평양은 2025년 매출의 43.19%를 차지하며, 스마트 팩토리 시장에서 가장 큰 지역 블록으로 자리매김하고 있습니다. 중국의 ‘중국 제조 2025’에 따른 보조금, 일본의 ‘사회 5.0’에서 협업 로봇(코봇)에 대한 우대 조치, 그리고 한국의 디스플레이 및 반도체 분야에 대한 지원금이 맞물려 지출을 확대하고 있습니다. 인도의 ‘생산 연계형 인센티브(PLI)’ 제도는 전자 및 제약 분야에 더욱 탄력을 불어넣고 있습니다. 호주와 뉴질랜드에서는 외딴 지역의 광업에 산업용 IoT 네트워크가 활용되고 있어, 해당 지역의 사업 범위가 광범위함을 여실히 보여주고 있습니다.
북미에서는 기존 시설의 개보수와 신규 전기자동차 및 배터리 투자가 병행되고 있습니다. 미국의 ‘CHIPS and Science Act’는 반도체 자동화에 520억 달러를 투입하고 있으며, 멕시코는 자동차 및 항공우주 공급업체를 위한 니어쇼어링 거점으로 부상하고 있습니다. 캐나다는 배출량 감축을 중시하는 항공우주 및 광업 프로젝트에 공동 투자하며, 지속가능성에 대한 의지를 강조하고 있습니다.
유럽은 인더스트리 4.0의 상호 운용성에 투자하고 있습니다. 독일의 ‘Plattform Industrie 4.0’은 2025년에 개방형 표준을 발표하여 벤더 간의 통합을 가속화하고 있습니다. 영국과 프랑스는 제약 및 항공우주 분야를 중점적으로 공략하는 반면, 이탈리아와 스페인은 식품 가공 공장의 활성화에 주력하고 있습니다. 중동은 규모는 작지만 사우디아라비아의 ‘비전 2030’과 아랍에미리트(UAE)의 자유무역지대 우대 조치에 힘입어 연평균 성장률(CAGR) 9.96%로 가장 빠르게 성장하고 있는 지역입니다. 남미와 아프리카는 뒤처져 있지만, 자동차, 펄프, 광업 분야에서 중점적인 도입이 진행되고 있습니다.
기타 혜택:
- Excel 형식의 시장 예측(ME) 시트
- 3개월간 애널리스트 지원
자주 묻는 질문
목차
제1장 소개
제2장 분석 방법
제3장 주요 요약
제4장 시장 구도
제5장 시장 규모·성장률 예측
제6장 경쟁 구도
제7장 시장 기회와 향후 전망
KSM 26.09.07According to Mordor Intelligence, the smart factory market size was valued at USD 385.55 billion in 2025 and estimated to grow from USD 426.66 billion in 2026 to reach USD 675.82 billion by 2031, at a CAGR of 9.64% during the forecast period 2026-2031.
This report is Segmented by Product Type (Machine Vision Systems, Industrial Robotics, Control Devices, Sensors, Communication Technologies, and More Product Types), Technology (PLM, HMI, ERP, MES, DCS, SCADA, and More), End-User Industry (Automotive, Semiconductors, Oil and Gas, and More), Deployment Model (On-Premise, and Cloud-Based), and Geography. The Market Forecasts are Provided in Terms of Value (USD).
Global Smart Factory Market Trends and Insights
Growing Adoption of Industrial IoT Platforms
Industrial Internet of Things platforms are consolidating data from programmable logic controllers, supervisory systems, and enterprise resource planning layers into single repositories. Siemens connected more than 1.2 million assets on its MindSphere cloud in 2025, a 40% jump from 2024. Edge gateways running OPC Unified Architecture over time-sensitive networking now handle sub-millisecond latency, so predictive algorithms can trim unplanned downtime by 25-35%. Subscription pricing also converts capital outlay into operating expense, widening access among small manufacturers. The result is an installed base ready for artificial intelligence, digital twins, and autonomous workflows.
Rising Government Incentives for Smart Manufacturing
Fiscal programs from Beijing to Riyadh offset automation risk. China earmarked CNY 200 billion (USD 28 billion) for intelligent manufacturing upgrades during 2024-2026. Saudi Arabia's Vision 2030 set aside SAR 15 billion (USD 4 billion) in 2025 for petrochemical and mining facilities, and India's Production Linked Incentive scheme extends 6-8% rebates on automation equipment. Accelerated depreciation rules in the United States and Germany shorten payback periods for small and medium enterprises, lifting adoption rates in otherwise capital-constrained segments.
Other drivers and restraints analyzed in the detailed report include:
- Demand for End-to-End Energy Optimisation
- Edge AI Chips Enabling Real-Time Quality Control
For complete list of drivers and restraints, kindly check the Table Of Contents.
Segment Analysis
Industrial robotics captured 28.41% of 2025 revenue, giving it the largest smart factory market share among product categories. Cobots, however, are expanding at 10.27% CAGR and are projected to capture a growing slice of the smart factory market size through 2031 as automotive and pharmaceutical lines favour flexible, uncaged automation. Universal Robots reported 35% year-over-year cobot growth in small and medium enterprises during 2025.
Across complementary devices, control components deliver precise actuation, and multi-modal sensors create real-time data streams for conditional monitoring. Wired protocols such as EtherCAT dominate deterministic motion, while 5G supports mobile platforms and retrofit scenarios. Hardware, software, and integration services are converging into full-stack offerings that extend lifecycle value.
Manufacturing execution systems accounted for 24.18% of 2025 spending, but advanced analytics and artificial intelligence platforms are growing at a 10.31% CAGR, indicating a rapid reallocation of the smart factory market size toward prescriptive software. SAP's Digital Manufacturing Cloud added more than 800 customers in 2025.
Distributed control systems and programmable logic controllers remain indispensable for real-time loops, yet edge controllers that host containerized applications enable hybrid workloads. Augmented-reality interfaces reduce mean-time-to-repair, and digital twin simulators cut commissioning timelines. Open application programming interfaces dictate how quickly new modules can be deployed, shaping competitiveness.
Complete Report Scope:
- By Product Type
- Machine Vision Systems
- Cameras
- Processors
- Software
- Enclosures
- Frame Grabbers
- Integration Services
- Lighting
- Industrial Robotics
- Articulated Robots
- Cartesian Robots
- Cylindrical Robots
- SCARA Robots
- Parallel Robots
- Collaborative Industry Robots
- Control Devices
- Relays and Switches
- Servo Motors and Drives
- Sensors
- Communication Technologies
- Wired
- Wireless
- Other Product Types
- Machine Vision Systems
- By Technology
- Product Lifecycle Management (PLM)
- Human Machine Interface (HMI)
- Enterprise Resource Planning (ERP)
- Manufacturing Execution System (MES)
- Distributed Control System (DCS)
- Supervisory Control and Data Acquisition (SCADA)
- Programmable Logic Controller (PLC)
- Advanced Analytics and AI Platforms
- Other Technologies
- By End-User Industry
- Automotive
- Semiconductors
- Oil and Gas
- Chemical and Petrochemical
- Pharmaceutical
- Aerospace and Defense
- Food and Beverage
- Mining
- Other End-User Industries
- By Deployment Model
- On-Premise
- Cloud-based
- By Geography
- North America
- United States
- Canada
- Mexico
- South America
- Brazil
- Argentina
- Rest of South America
- Europe
- Germany
- United Kingdom
- France
- Italy
- Rest of Europe
- Asia-Pacific
- China
- Japan
- India
- South Korea
- Australia and New Zealand
- Rest of Asia-Pacific
- Middle East
- Saudi Arabia
- United Arab Emirates
- Turkey
- Rest of Middle East
- Africa
- South Africa
- Nigeria
- Kenya
- Rest of Africa
- North America
Geography Analysis
Asia-Pacific contributed 43.19% of 2025 revenue, making it the largest regional block within the smart factory market. China's Made in China 2025 subsidies, Japan's Society 5.0 cobot incentives, and South Korea's display and semiconductor grants collectively amplify spending. India's Production Linked Incentive schemes add momentum in electronics and pharmaceuticals. Australia and New Zealand apply Industrial Internet of Things networks to remote mining, highlighting the region's breadth.
North America combines brownfield retrofits with greenfield electric vehicle and battery investments. The United States CHIPS and Science Act directs USD 52 billion into semiconductor automation, and Mexico emerges as a nearshoring magnet for automotive and aerospace suppliers. Canada co-funds aerospace and mining projects that emphasize emissions reduction, underscoring a sustainability tilt.
Europe invests in Industry 4.0 interoperability. Germany's Plattform Industrie 4.0 published open standards in 2025, accelerating vendor integration. The United Kingdom and France target pharmaceutical and aerospace lines, while Italy and Spain revitalize food processing plants. The Middle East, though smaller, is the fastest-growing region at 9.96% CAGR, underpinned by Saudi Vision 2030 and United Arab Emirates free-zone incentives. South America and Africa trail but showcase focused deployments in automotive, pulp, and mining.
- Siemens AG
- ABB Ltd
- Schneider Electric SE
- Rockwell Automation Inc.
- Honeywell International Inc.
- Mitsubishi Electric Corporation
- Fanuc Corporation
- Emerson Electric Co.
- Yokogawa Electric Corporation
- KUKA AG
- Cognex Corporation
- Robert Bosch GmbH
- Teledyne FLIR LLC
- General Electric Company
- Cisco Systems Inc.
- SAP SE
- PTC Inc.
- Dassault Systemes SE
- Intel Corporation
- Hewlett Packard Enterprise Company
- Keyence Corporation
- Omron Corporation
- Universal Robots A/S
- Johnson Controls International plc
Additional Benefits:
- The market estimate (ME) sheet in Excel format
- 3 months of analyst support
TABLE OF CONTENTS
1 INTRODUCTION
- 1.1 Study Assumptions and Market Definition
- 1.2 Scope of the Study
2 RESEARCH METHODOLOGY
3 EXECUTIVE SUMMARY
4 MARKET LANDSCAPE
- 4.1 Market Overview
- 4.2 Market Drivers
- 4.2.1 Growing Adoption of Industrial IoT Platforms
- 4.2.2 Demand for End-to-End Energy Optimisation
- 4.2.3 Rising Government Incentives for Smart Manufacturing
- 4.2.4 Edge AI Chips Enabling Real-Time Quality Control
- 4.2.5 Open-Source Digital Twins Lowering Integration Cost
- 4.2.6 Quantum-Safe Encryption Boosting OEM Trust (Under-the-Radar)
- 4.3 Market Restraints
- 4.3.1 High Upfront CAPEX for Brownfield Transformation
- 4.3.2 Cybersecurity Vulnerabilities within OT Networks
- 4.3.3 Shortage of Interoperable OT-IT Talent
- 4.3.4 Volatile Rare-Earth Supply for Robotics Actuators
- 4.3.5 Regulatory Uncertainty Around Industrial Data Sovereignty (Under-the-Radar)
- 4.4 Industry Value-Chain Analysis
- 4.5 Impact of Macroeconomic Factors on the Market
- 4.6 Regulatory Landscape
- 4.7 Technological Outlook
- 4.8 Porter's Five Forces Analysis
- 4.8.1 Bargaining Power of Suppliers
- 4.8.2 Bargaining Power of Buyers
- 4.8.3 Threat of New Entrants
- 4.8.4 Threat of Substitute Products
- 4.8.5 Intensity of Competition
5 MARKET SIZE AND GROWTH FORECASTS (VALUE)
- 5.1 By Product Type
- 5.1.1 Machine Vision Systems
- 5.1.1.1 Cameras
- 5.1.1.2 Processors
- 5.1.1.3 Software
- 5.1.1.4 Enclosures
- 5.1.1.5 Frame Grabbers
- 5.1.1.6 Integration Services
- 5.1.1.7 Lighting
- 5.1.2 Industrial Robotics
- 5.1.2.1 Articulated Robots
- 5.1.2.2 Cartesian Robots
- 5.1.2.3 Cylindrical Robots
- 5.1.2.4 SCARA Robots
- 5.1.2.5 Parallel Robots
- 5.1.2.6 Collaborative Industry Robots
- 5.1.3 Control Devices
- 5.1.3.1 Relays and Switches
- 5.1.3.2 Servo Motors and Drives
- 5.1.4 Sensors
- 5.1.5 Communication Technologies
- 5.1.5.1 Wired
- 5.1.5.2 Wireless
- 5.1.6 Other Product Types
- 5.1.1 Machine Vision Systems
- 5.2 By Technology
- 5.2.1 Product Lifecycle Management (PLM)
- 5.2.2 Human Machine Interface (HMI)
- 5.2.3 Enterprise Resource Planning (ERP)
- 5.2.4 Manufacturing Execution System (MES)
- 5.2.5 Distributed Control System (DCS)
- 5.2.6 Supervisory Control and Data Acquisition (SCADA)
- 5.2.7 Programmable Logic Controller (PLC)
- 5.2.8 Advanced Analytics and AI Platforms
- 5.2.9 Other Technologies
- 5.3 By End-User Industry
- 5.3.1 Automotive
- 5.3.2 Semiconductors
- 5.3.3 Oil and Gas
- 5.3.4 Chemical and Petrochemical
- 5.3.5 Pharmaceutical
- 5.3.6 Aerospace and Defense
- 5.3.7 Food and Beverage
- 5.3.8 Mining
- 5.3.9 Other End-User Industries
- 5.4 By Deployment Model
- 5.4.1 On-Premise
- 5.4.2 Cloud-based
- 5.5 By Geography
- 5.5.1 North America
- 5.5.1.1 United States
- 5.5.1.2 Canada
- 5.5.1.3 Mexico
- 5.5.2 South America
- 5.5.2.1 Brazil
- 5.5.2.2 Argentina
- 5.5.2.3 Rest of South America
- 5.5.3 Europe
- 5.5.3.1 Germany
- 5.5.3.2 United Kingdom
- 5.5.3.3 France
- 5.5.3.4 Italy
- 5.5.3.5 Rest of Europe
- 5.5.4 Asia-Pacific
- 5.5.4.1 China
- 5.5.4.2 Japan
- 5.5.4.3 India
- 5.5.4.4 South Korea
- 5.5.4.5 Australia and New Zealand
- 5.5.4.6 Rest of Asia-Pacific
- 5.5.5 Middle East
- 5.5.5.1 Saudi Arabia
- 5.5.5.2 United Arab Emirates
- 5.5.5.3 Turkey
- 5.5.5.4 Rest of Middle East
- 5.5.6 Africa
- 5.5.6.1 South Africa
- 5.5.6.2 Nigeria
- 5.5.6.3 Kenya
- 5.5.6.4 Rest of Africa
- 5.5.1 North America
6 COMPETITIVE LANDSCAPE
- 6.1 Market Concentration
- 6.2 Strategic Moves
- 6.3 Market Share Analysis
- 6.4 Company Profiles (includes Global Level Overview, Market Level Overview, Core Segments, Financials as available, Strategic Information, Market Rank/Share, Products and Services, Recent Developments)
- 6.4.1 Siemens AG
- 6.4.2 ABB Ltd
- 6.4.3 Schneider Electric SE
- 6.4.4 Rockwell Automation Inc.
- 6.4.5 Honeywell International Inc.
- 6.4.6 Mitsubishi Electric Corporation
- 6.4.7 Fanuc Corporation
- 6.4.8 Emerson Electric Co.
- 6.4.9 Yokogawa Electric Corporation
- 6.4.10 KUKA AG
- 6.4.11 Cognex Corporation
- 6.4.12 Robert Bosch GmbH
- 6.4.13 Teledyne FLIR LLC
- 6.4.14 General Electric Company
- 6.4.15 Cisco Systems Inc.
- 6.4.16 SAP SE
- 6.4.17 PTC Inc.
- 6.4.18 Dassault Systemes SE
- 6.4.19 Intel Corporation
- 6.4.20 Hewlett Packard Enterprise Company
- 6.4.21 Keyence Corporation
- 6.4.22 Omron Corporation
- 6.4.23 Universal Robots A/S
- 6.4.24 Johnson Controls International plc
7 MARKET OPPORTUNITIES AND FUTURE OUTLOOK
- 7.1 White-Space and Unmet-Need Assessment