|
시장보고서
상품코드
2121587
배터리 재활용 : 시장 점유율 분석, 업계 동향과 통계, 성장 예측(2026-2031년)Battery Recycling - Market Share Analysis, Industry Trends & Statistics, Growth Forecasts (2026 - 2031) |
||||||
 Mordor Intelligence
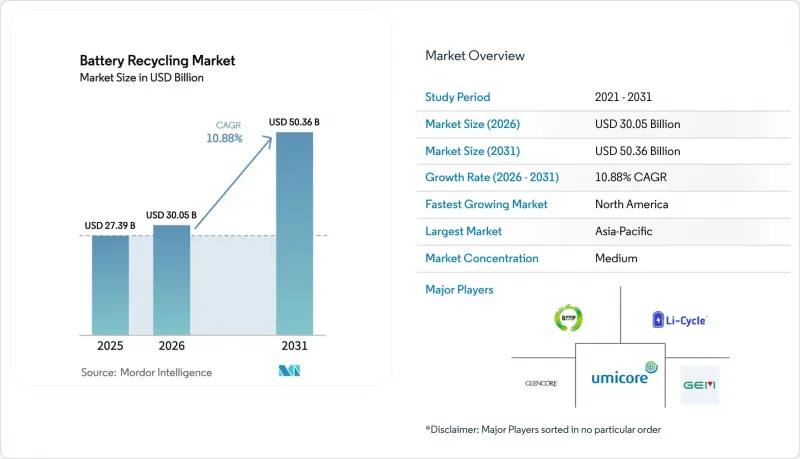
Mordor Intelligence에 따르면 배터리 재활용 시장 규모는 2025년 273억 9,000만 달러에서 2026년에는 300억 5,000만 달러로 확대되고, 2026년부터 2031년까지 CAGR 10.88%를 기록하며 2031년까지 503억 6,000만 달러에 달할 것으로 예측됩니다.
본 보고서는 배터리의 화학 조성(납산, 리튬이온 등), 스크랩 발생원(자동차 등), 재활용 기술(습식 야금, 건식 야금 등), 공정 단계(재료 정제·회수 등), 회수된 재료의 용도(음극 활물질 등), 최종사용자 산업(자동차 등), 지역(아시아태평양 등)별로 분류되어 있습니다.
세계 배터리 재활용 시장의 동향 및 인사이트
전기자동차(EV) 보급률의 급증
2024년, 전 세계 배터리식 전기자동차 및 플러그인 하이브리드차 판매 대수는 1,400만 대를 돌파했으며, 약 1.1 TWh의 리튬이온 배터리 용량이 탑재되었습니다. 이 차량들은 2032년 이후 수명이 다하게 되어, 예측 가능한 원료 공급 물결을 만들어낼 것입니다. 테슬라는 네바다주 시설에서 폐배터리 팩에서 중요 광물을 92% 회수하여 대규모 회수의 기술적 실현 가능성을 입증했습니다. 중국에서는 2030년까지 1,200만 톤의 사용 후 리튬이온 배터리가 발생할 것으로 예측되며, 이는 현재 전 세계 재활용 처리 능력의 3배에 해당합니다. 유럽에서는 차량 1대당 평균 CO2 배출량 규제가 강화됨에 따라 전기자동차의 보급이 가속화되어, 1세대 배터리 팩이 더 조기에 해체 네트워크로 유입될 것입니다. 판매부터 사용 종료까지의 기간이 짧아짐에 따라, 재활용 사업자가 처리 능력을 확충하고 양극재 제조사와의 수거 계약을 확보하기 위한 유예 기간이 단축되고 있습니다.
세계 폐배터리 규제가 강화
EU의 배터리 규제는 2031년까지 신규 전기자동차 배터리에 재활용 코발트 16%, 재활용 리튬 6%, 재활용 니켈 6%의 사용을 의무화하고 있으며, 2036년까지 더욱 엄격한 기준이 설정되어 있습니다. 중국의 2024년판 확대 생산자 책임(EPR) 규정에 따르면, 자동차 제조업체는 수거 네트워크에 자금을 지원하고 리튬 이온 회수율 85%를 달성해야 하며, 위반 건당 최대 50만 위안의 벌금이 부과됩니다. 미국 환경보호청(EPA)은 2025년, 인증된 재활용 경로가 없는 배터리 셀에 대해 생산자 부담금을 부과하는 스튜어드십 체계를 제안했습니다. 인도의 EPR 규정안은 2028년까지 70%의 회수율을 목표로 하고 있으나, 집행에 관한 명확성이 부족합니다. 이러한 정책들은 재활용 사업자에게는 수익 변동을 억제하는 한편, 관할 구역을 가로지르는 공급망의 단절을 초래하고 있습니다.
재활용 플랜트의 높은 설비 투자(Capex)/운영비(Opex)
연간 처리 능력 2만 톤 규모의 습식 제련 시설에는 1억 8,000만-2억 5,000만 달러가 필요하며, 그 설치 비용의 60%를 반응기와 용매 추출 라인이 차지합니다. 운영 비용은 산 소비량과 폐수처리 비용에 따라 투입량 1톤당 1,800-2,400달러 범위입니다. Li-Cycle사의 로체스터 허브 예산은 2024년 중반까지 4억 8,500만-9억 6,000만 달러로 급증하여 비용 초과 위험이 드러나고 있습니다. 신흥 시장의 중소기업은 18-22%의 차입 비용에 직면해 있어 인프라 격차를 확대시키고 있습니다.
부문별 분석
납축배터리는 2025년 매출의 70.9%를 계속 차지하고 있는데, 이는 폐배터리의 거의 99%가 선진국 시장에서 회수되어 기존 제련소를 통해 재활용되고 있기 때문입니다. 리튬이온 배터리의 연평균 성장률(CAGR) 23.9%는 배터리 재활용 시장이 어떤 방향으로 나아가고 있는지를 보여줍니다. 국제에너지기구(IEA)의 데이터에 따르면, 2030년까지 연간 180만 톤의 리튬이온 배터리 스크랩이 발생하여, 해당 배터리 재활용 시장 규모가 급속히 확대될 것으로 전망됩니다. 기존 납축배터리 재활용 업체들은 열처리 라인의 현대화를 추진하는 한편, 신규 진입 기업들은 향후 증가가 예상되는 리튬 함량이 높은 폐배터리의 흐름을 확보하기 위해 습식 제련 거점에 대한 자금 조달을 진행하고 있습니다. 레드우드 머티리얼즈(Redwood Materials)는 2024년에 1만 8,000톤의 리튬이온 배터리 스크랩을 처리하며 사업으로서의 성장세를 입증했습니다.
따라서 배터리 재활용 시장은 양극화되어 있습니다. 납축배터리는 안정적이고 저성장의 현금 흐름을 가져오는 반면, 리튬이온 배터리는 고성장 및 기술 집약적인 성장 잠재력을 지니고 있습니다. 경쟁 우위는 2028년 이후의 전환기를 앞두고 전기자동차(EV)에서 유래한 원료를 확보하는 것과, 자동차 제조사의 사양을 충족하기 위해 90% 이상의 금속 회수율을 달성할 수 있는지에 달려 있습니다.
2025년 처리량의 58.5%를 자동차용 배터리가 차지하고 있으며, 이는 납축배터리의 대량 교체나 2013년부터 2016년형 닛산 리프의 배터리 팩 등 조기 폐차되는 전기자동차의 영향을 반영한 것입니다. 가전제품 스크랩은 기기의 수명주기가 단축됨에 따라 연평균 성장률(CAGR) 20.5%로 확대되고 있지만, 회수율이 40% 미만에 그치고 있어 정책 주도형 회수 프로그램에는 개선의 여지가 있습니다. 제조 스크랩은 고순도 원료를 공급하며, CATL의 닝더 캠퍼스에서는 45일 이내에 재고 회전이 이루어지기 때문에 사용 후 제품에서 발생하는 흐름에 비해 운전 자본이 개선됩니다.
가전제품의 급속한 성장으로 인해 배터리 재활용 시장에서는 원료의 다양화가 진행되고 있으며, 자동차 분야에 대한 의존도가 낮아지고 있습니다. 또한, 고품질의 제조 스크랩이 저품질의 가정용 배터리를 상쇄함으로써 블렌드 마진의 개선이 이루어지고 있습니다.
지역별 분석
아시아태평양은 2025년 매출의 52.4%를 차지하며, 이를 주도하는 것은 재활용 업체와 기가팩토리 클러스터가 수처리 공정을 통해 88-92%의 금속 회수율을 달성하고 있는 중국의 수직 통합형 생태계입니다. 2024년에 도입된 ‘국가 배터리 여권’은 추적성 확보를 위해 모든 셀에 태그를 부착하여 오염을 15-18% 줄이고 있습니다. 일본에서는 6만 8,000톤의 니켈-수소(NiMH) 및 리튬이온 배터리 스크랩이 처리되었으며, 도요타·스미토모의 오나하마 제련소에서 희토류 원소가 회수되었습니다. 한국에서는 수수료를 재원으로 하는 EPR(생산자 책임 회수) 제도를 통해 2025년 말까지 리튬이온 배터리 회수율이 72%에 달했습니다. 인도는 4만 2,000톤의 처리 능력을 보유하고 있지만, 비공식 해체업자들이 여전히 처리량의 60%를 가로채고 있습니다.
북미는 연평균 성장률(CAGR) 21.3%를 기록하며 가장 빠르게 성장하는 지역입니다. ‘섹션 45X’에서는 재활용 재료에 대해 1kWh당 10달러의 생산세 공제가 제공되며, ‘섹션 30D’에서는 2026년까지 배터리 가치의 50%를 북미 또는 자유무역협정(FTA) 체결국에서 조달해야 할 의무가 부과됩니다. 레드우드 머티리얼즈는 재활용 원료를 30% 사용한 100GWh 규모의 양극·음극 제조 거점에 35억 달러를 투자하고 있습니다. Li-Cycle사의 로체스터 허브는 미국 에너지부(DOE)로부터 4억 7,500만 달러의 대출 보증을 확보했으며, 2026년 하반기 가동을 목표로 하고 있습니다. 캐나다는 재활용 인프라에 15억 캐나다 달러를 배정하고 있으며, 글렌코어(Glencore)와 일렉트라(Electra)는 퀘벡주 및 온타리오주에서 습식 제련 시설 확장을 추진하고 있습니다.
유럽 시장 점유율도 노스볼트사의 강력한 수주 실적에 힘입어 빠른 속도로 확대되고 있습니다. 노스볼트사의 ‘레볼트’ 시설은 처리 능력 8,000톤 규모로 리튬,니켈, 코발트의 회수율 95%를 달성하고 있으며, 2030년까지 연간 12만 5,000톤 처리를 목표로 하고 있습니다. 독일은 두젠펠트사와 아큐렉사에 대해 5만 톤 규모의 수력 야금 처리 능력 구축을 위해 2억 유로를 지원했습니다. 프랑스의 베올리아-솔베이 합작회사는 ACC의 기가팩토리와 동일한 부지 내에 1만 5,000톤 규모의 공장을 건설할 예정입니다. 남미 및 중동 및 아프리카(MEA) 지역의 시장 점유율은 브라질의 네트워크와 남아프리카의 Eco-Bat 제련소로 한정되어 있습니다. 대규모 리튬이온 프로젝트는 전기자동차(EV) 보급률 향상이 기대되고 있습니다.
기타 혜택:
- Excel 형식의 시장 예측(ME) 시트
- 3개월간의 애널리스트 지원
자주 묻는 질문
목차
제1장 소개
제2장 분석 방법
제3장 주요 요약
제4장 시장 구도
제5장 시장 규모·성장률 예측
제6장 경쟁 구도
제7장 시장 기회와 향후 전망
KSM 26.09.07According to Mordor Intelligence, the battery recycling market size is expected to grow from USD 27.39 billion in 2025 to USD 30.05 billion in 2026 and is forecast to reach USD 50.36 billion by 2031 at 10.88% CAGR over 2026-2031.
This report is Segmented by Battery Chemistry (Lead-Acid, Lithium-Ion, and More), Source of Scrap (Automotive, and More), Recycling Technology (Hydrometallurgical, Pyrometallurgical, and More), Process Stage (Material Refining and Recovery, and More), Application of Recovered Materials (Cathode Active Materials, and More), End-User Industry (Automotive, and More) and Geography (Asia-Pacifica, and More).
Global Battery Recycling Market Trends and Insights
EV penetration surge
Global battery-electric and plug-in hybrid sales passed 14 million units in 2024, embedding roughly 1.1 TWh of lithium-ion capacity that will reach end-of-life after 2032, creating a predictable feedstock wave. Tesla recovered 92% of critical minerals from retired packs at its Nevada facility, proving technical feasibility at scale. China projects 12 million t of retired lithium-ion cells by 2030, triple the current global recycling capacity. Europe's tightening fleet-average CO2 limits accelerate EV adoption and bring first-generation packs into dismantling networks earlier. The lag between sales and retirements compresses the window for recyclers to build capacity and secure offtake agreements with cathode makers.
Global End-of-Life Battery Regulations Tighten
The EU Battery Regulation requires 16% recycled cobalt, 6% recycled lithium, and 6% recycled nickel in new EV batteries by 2031, with steeper thresholds by 2036. China's 2024 extended-producer-responsibility rules oblige automakers to finance collection networks and reach 85% lithium-ion recovery, alongside penalties up to CNY 500,000 per violation. The U.S. Environmental Protection Agency proposed a stewardship framework in 2025 that would impose producer fees on cells lacking certified recycling pathways. India's draft EPR rules target 70% collection by 2028 but lack enforcement clarity. These policies reduce revenue volatility for recyclers but fragment supply chains across jurisdictions.
High Capex / Opex of Recycling Plants
A 20,000 t y hydrometallurgical facility requires USD 180-250 million, with reactors and solvent-extraction trains comprising 60% of the installed cost. Operating expenses range USD 1,800-2,400 t input, driven by acid consumption and wastewater treatment. Li-Cycle's Rochester Hub budget ballooned from USD 485 million to USD 960 million by mid-2024, exposing cost-overrun risk. Smaller firms in emerging markets face debt costs of 18-22%, widening the infrastructure gap.
Other drivers and restraints analyzed in the detailed report include:
- Critical-Metal Price Inflation
- OEM ESG & Circular-Economy Mandates
- Patchy Collection Logistics in Emerging Markets
For complete list of drivers and restraints, kindly check the Table Of Contents.
Segment Analysis
Lead-acid retained 70.9% of 2025 revenue as nearly 99% of spent units are collected in developed markets and recycled through established smelters. Lithium-ion's 23.9% CAGR signals where the battery recycling market is pivoting; International Energy Agency data show 1.8 million t of lithium-ion scrap annually by 2030, creating an addressable battery recycling market size surge. Incumbent lead-acid recyclers are modernizing pyro lines, while new entrants finance hydrometallurgical hubs to capture upcoming lithium-rich flows. Redwood Materials processed 18,000 t of lithium-ion scrap in 2024, confirming commercial momentum.
The battery recycling market is therefore split: lead-acid offers stable, low-growth cash flows; lithium-ion offers high-growth, technology-intensive upside. Competitive advantage will hinge on securing EV-derived feedstock ahead of the post-2028 inflection and on achieving metal-recovery rates above 90% to satisfy automaker specifications.
Automotive batteries supplied 58.5% of 2025 throughput, reflecting large lead-acid replacement volumes and early EV retirements such as 2013-16 Nissan Leaf packs. Consumer electronics scrap is expanding 20.5% CAGR as device lifecycles shorten; however, sub-40% collection rates reveal upside for policy-driven capture programs. Manufacturing scrap delivers high-purity feedstock and turns inventory within 45 days at CATL's Ningde campus, improving working capital compared with post-consumer flows.
Rapid consumer electronics growth ensures the battery recycling market continues diversifying feedstock, reducing reliance on automotive volumes, and improving blended margins as clean manufacturing scrap offsets lower-grade household batteries.
Complete Report Scope:
- By Battery Chemistry
- Lead-acid
- Lithium-ion (NMC, LFP, NCA, LMO)
- Nickel-based
- Other chemistries (Zn-air, Sodium-ion etc.)
- By Source of Scrap
- Automotive Batteries
- Consumer Electronics Batteries
- Industrial and ESS Batteries
- Manufacturing Scrap
- By Recycling Technology
- Hydrometallurgical
- Pyrometallurgical
- Direct/Mechanical
- Hybrid and Emerging (Bio/ Electro-chemical)
- By Process Stage
- Collection and Logistics
- Dismantling and Discharge
- Mechanical Shredding/Sorting
- Black-Mass Production
- Material Refining and Recovery
- By Application of Recovered Materials
- Cathode Active Materials
- Anode/Graphite
- Battery-grade Lithium Compounds
- Cobalt and Nickel Salts
- Manganese
- Others (Cu, Al)
- By End-user Industry
- Automotive
- Marine
- Power and Energy Storage
- Consumer Electronics
- Others
- By Geography
- North America
- United States
- Canada
- Mexico
- Europe
- Germany
- United Kingdom
- Italy
- France
- Spain
- NORDIC Countries
- Russia
- Rest of Europe
- Asia-Pacific
- China
- India
- Japan
- South Korea
- ASEAN Countries
- Australia and New Zealand
- Rest of Asia-Pacific
- South America
- Brazil
- Argentina
- Colombia
- Rest of South America
- Middle East and Africa
- Saudi Arabia
- United Arab Emirates
- South Africa
- Egypt
- Rest of Middle East and Africa
- North America
Geography Analysis
Asia-Pacific captured 52.4% of 2025 revenue, led by China's vertically integrated ecosystem where recycler-gigafactory clusters reach 88-92% metal-recovery through hydro routes. The national battery passport, launched in 2024, tags every cell for traceability, cutting contamination by 15-18%. Japan processed 68,000 t of NiMH and lithium-ion scrap, recovering rare-earth elements at Toyota-Sumitomo's Onahama smelter. South Korea's fee-backed EPR scheme lifted lithium-ion recovery to 72% by end-2025. India has 42,000 t capacity, but informal dismantlers still siphon 60% of volumes.
North America is the fastest-growing region at 21.3% CAGR. Section 45X provides a USD 10 kWh production credit for recycled material, and Section 30D requires 50% battery value from North America or FTA partners by 2026. Redwood Materials is investing USD 3.5 billion in a 100 GWh cathode-anode campus, with 30% recycled feedstock. Li-Cycle's Rochester Hub secured a USD 475 million DOE loan guarantee, targeting late-2026 commissioning. Canada earmarked CAD 1.5 billion for recycling infrastructure, with Glencore and Electra expanding hydrometallurgy in Quebec and Ontario.
Europe's share is also increasing at a high rate, driven by rNorthvolt'stent strong mandates. Northvolt's Revolt facility achieved 95% lithium, nickel, and cobalt recovery at 8,000 t throughput and targets 125,000 t/y by 2030. Germany granted EUR 200 million to Duesenfeld and Accurec for 50,000 tFrance'sd hydro capacity. France's Veolia-Solvay JV will build a 15,000 t plant in ACC 'sirk, co-located with ACC's gigafactory. South America and MEA combined for share, limited to Brazil's network and South Africa's Eco-Bat smelter; large-scale lithium-ion projects await higher EV penetration.
- Umicore SA
- Glencore PLC
- Brunp Recycling (CATL)
- GEM Co., Ltd.
- Li-Cycle Holdings Corp.
- Redwood Materials Inc.
- Ascend Elements (Battery Resources)
- Ecobat
- American Battery Technology Co. (ABTC)
- RecycLiCo Battery Materials
- Retriev Technologies Inc.
- Cirba Solutions
- Duesenfeld GmbH
- TES-AMM Pte Ltd.
- Recupyl SAS
- Raw Materials Company Inc.
- Glencore-Li-Cycle Portovesme JV
- Ganfeng Lithium Co., Ltd.
- Eramet-Suez JV (Recyclage Batteries)
- InoBat-Minerals JV
Additional Benefits:
- The market estimate (ME) sheet in Excel format
- 3 months of analyst support
TABLE OF CONTENTS
1 Introduction
- 1.1 Study Assumptions & Market Definition
- 1.2 Scope of the Study
2 Research Methodology
3 Executive Summary
4 Market Landscape
- 4.1 Market Overview
- 4.2 Market Drivers
- 4.2.1 Accelerating wave of EV battery retirements
- 4.2.2 Tightening global EPR & EU Battery Regulation mandates
- 4.2.3 Raw-material price inflation spurring closed-loop supply chains
- 4.2.4 Step-change yields from next-gen hydro & direct recycling
- 4.2.5 OEM design-for-recycling battery packs reducing dismantling cost
- 4.2.6 Emergence of liquid "black-mass" spot markets
- 4.3 Market Restraints
- 4.3.1 Volatile metal prices & high reverse-logistics costs
- 4.3.2 Safety & haz-mat compliance in high-voltage collection
- 4.3.3 Regional over-capacity creating feedstock scarcity risk
- 4.3.4 Low intrinsic value of LFP chemistries
- 4.4 Supply-Chain Analysis
- 4.5 Regulatory Landscape
- 4.6 Technological Outlook
- 4.7 Porter's Five Forces
- 4.7.1 Bargaining Power of Suppliers
- 4.7.2 Bargaining Power of Buyers
- 4.7.3 Threat of New Entrants
- 4.7.4 Threat of Substitutes
- 4.7.5 Intensity of Competitive Rivalry
5 Market Size & Growth Forecasts
- 5.1 By Battery Chemistry
- 5.1.1 Lead-acid
- 5.1.2 Lithium-ion (NMC, LFP, NCA, LMO)
- 5.1.3 Nickel-based
- 5.1.4 Other chemistries (Zn-air, Sodium-ion etc.)
- 5.2 By Source of Scrap
- 5.2.1 Automotive Batteries
- 5.2.2 Consumer Electronics Batteries
- 5.2.3 Industrial and ESS Batteries
- 5.2.4 Manufacturing Scrap
- 5.3 By Recycling Technology
- 5.3.1 Hydrometallurgical
- 5.3.2 Pyrometallurgical
- 5.3.3 Direct/Mechanical
- 5.3.4 Hybrid and Emerging (Bio/ Electro-chemical)
- 5.4 By Process Stage
- 5.4.1 Collection and Logistics
- 5.4.2 Dismantling and Discharge
- 5.4.3 Mechanical Shredding/Sorting
- 5.4.4 Black-Mass Production
- 5.4.5 Material Refining and Recovery
- 5.5 By Application of Recovered Materials
- 5.5.1 Cathode Active Materials
- 5.5.2 Anode/Graphite
- 5.5.3 Battery-grade Lithium Compounds
- 5.5.4 Cobalt and Nickel Salts
- 5.5.5 Manganese
- 5.5.6 Others (Cu, Al)
- 5.6 By End-user Industry
- 5.6.1 Automotive
- 5.6.2 Marine
- 5.6.3 Power and Energy Storage
- 5.6.4 Consumer Electronics
- 5.6.5 Others
- 5.7 By Geography
- 5.7.1 North America
- 5.7.1.1 United States
- 5.7.1.2 Canada
- 5.7.1.3 Mexico
- 5.7.2 Europe
- 5.7.2.1 Germany
- 5.7.2.2 United Kingdom
- 5.7.2.3 Italy
- 5.7.2.4 France
- 5.7.2.5 Spain
- 5.7.2.6 NORDIC Countries
- 5.7.2.7 Russia
- 5.7.2.8 Rest of Europe
- 5.7.3 Asia-Pacific
- 5.7.3.1 China
- 5.7.3.2 India
- 5.7.3.3 Japan
- 5.7.3.4 South Korea
- 5.7.3.5 ASEAN Countries
- 5.7.3.6 Australia and New Zealand
- 5.7.3.7 Rest of Asia-Pacific
- 5.7.4 South America
- 5.7.4.1 Brazil
- 5.7.4.2 Argentina
- 5.7.4.3 Colombia
- 5.7.4.4 Rest of South America
- 5.7.5 Middle East and Africa
- 5.7.5.1 Saudi Arabia
- 5.7.5.2 United Arab Emirates
- 5.7.5.3 South Africa
- 5.7.5.4 Egypt
- 5.7.5.5 Rest of Middle East and Africa
- 5.7.1 North America
6 Competitive Landscape
- 6.1 Market Concentration
- 6.2 Strategic Moves (M&A, Partnerships, PPAs)
- 6.3 Market Share Analysis (Market Rank/Share for key companies)
- 6.4 Company Profiles (includes Global level Overview, Market level overview, Core Segments, Financials as available, Strategic Information, Products & Services, and Recent Developments)
- 6.4.1 Umicore SA
- 6.4.2 Glencore PLC
- 6.4.3 Brunp Recycling (CATL)
- 6.4.4 GEM Co., Ltd.
- 6.4.5 Li-Cycle Holdings Corp.
- 6.4.6 Redwood Materials Inc.
- 6.4.7 Ascend Elements (Battery Resources)
- 6.4.8 Ecobat
- 6.4.9 American Battery Technology Co. (ABTC)
- 6.4.10 RecycLiCo Battery Materials
- 6.4.11 Retriev Technologies Inc.
- 6.4.12 Cirba Solutions
- 6.4.13 Duesenfeld GmbH
- 6.4.14 TES-AMM Pte Ltd.
- 6.4.15 Recupyl SAS
- 6.4.16 Raw Materials Company Inc.
- 6.4.17 Glencore-Li-Cycle Portovesme JV
- 6.4.18 Ganfeng Lithium Co., Ltd.
- 6.4.19 Eramet-Suez JV (Recyclage Batteries)
- 6.4.20 InoBat-Minerals JV
7 Market Opportunities & Future Outlook
- 7.1 White-space & Unmet-Need Assessment