

|
시장보고서
상품코드
2121642
재활용 PET : 시장 점유율 분석, 업계 동향과 통계, 성장 예측(2026-2031년)Recyclate PET - Market Share Analysis, Industry Trends & Statistics, Growth Forecasts (2026 - 2031) |
||||||
 Mordor Intelligence
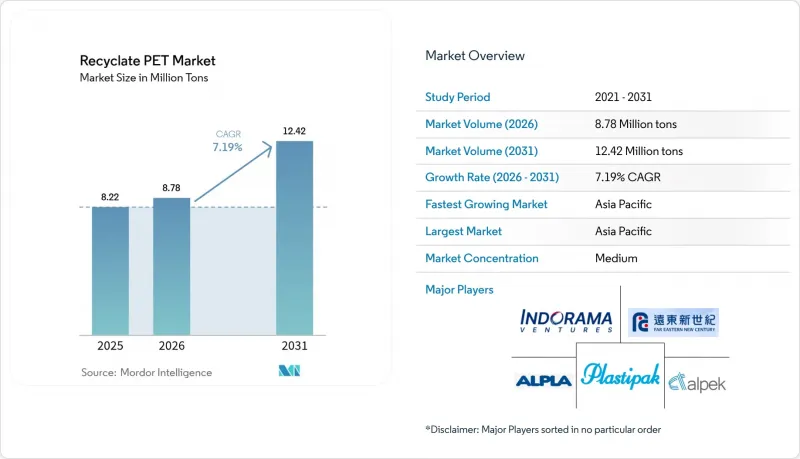
Mordor Intelligence에 의하면, 재생 PET 시장 규모는 2025년 822만 톤에서 2026년에는 878만 톤, 2031년까지 1,242만 톤에 이를 것으로 예상되고 있어 2026-2031년 CAGR 7.19%를 기록할 전망입니다.
본 보고서는 제품 유형(PET 스테이플 섬유, PET 스트랩, PET 시트 및 필름, 식품용 PET 병, 비식품용 PET 병, 기타 제품 유형), 용도(포장, 산업용 실, 건축자재, 기타 용도), 지역(아시아태평양, 북미, 유럽, 남미, 중동 및 아프리카)별로 분류되어 있습니다. 시장 전망은 수량(톤) 단위로 제시되어 있습니다.
전 세계 재생 PET 시장 동향 및 인사이트
재활용 소재 함유율에 관한 규제 강화가 구조적 수요를 견인
유럽의 ‘포장 및 포장 폐기물 규정’에서는 음료 병에 재생 소재를 포함하도록 의무화하고 있습니다. 위반 시 부과되는 벌금은 기업 수익에 상응하는 금액에 달할 수 있으며, 이로 인해 식품 등급 재활용 PET에 대한 최소한 수요가 사실상 확립되었습니다. 미국에서는 캘리포니아주를 필두로 여러 주가 이러한 움직임에 동참하여 재생 소재 함유율의 최소 기준을 설정하고 있습니다. 이러한 추세는 특히 여러 주에 걸쳐 광범위한 수거 네트워크를 보유한 가공업체에게 유리하게 작용합니다. 또한 규제 당국은 ‘재활용’의 정의를 소비 후 폐기물로만 한정하는 방향으로 규제를 강화하고 있어, 투자의 초점은 가정용 쓰레기 수거 시스템으로 이동하고 있습니다. ISO 14021과 같은 검증 프로토콜 및 디지털 패스포트의 도입으로 감사 기준은 더욱 높아지고 있습니다. 이에 대응하여 선견지명을 가진 기업들은 베일 추적을 위해 블록체인 기술을 도입하고 있습니다. 이러한 전략들이 결합되면서 재활용 PET 시장은 안정화되었으며, 원료 가격 변동에 따른 영향으로부터 보호받고, 안정적인 수요가 확보되고 있습니다.
브랜드의 노력이 장기적인 수거량을 뒷받침
2030년까지 코카콜라의 재활용 소재 사용 목표는 전 세계적으로 연간 rPET 수요로 이어질 것입니다. 한편, 펩시코의 유럽 내 노력도 이 총 수요에 기여하고 있습니다. 유니레버는 재활용 플라스틱 목표를 신속히 달성한 데 이어, 2030년을 향한 새로운 야심찬 목표를 설정했습니다. 이러한 브랜드들은 인플레이션 조정된 다년 계약을 통해 약속을 강화하고 있으며, 이를 통해 재활용 업체들은 새로운 생산 라인을 위한 차입 자금을 조달할 수 있게 되었습니다. 이러한 조달 동향의 변화를 여실히 보여주는 것이 다논(Danone)의 식품 등급 수거 계약입니다. 대기업들이 입지를 공고히 하는 반면, 소규모 기계식 재활용 업체들에게는 이러한 확립된 체계 밖에서 베일 확보 경쟁에 뛰어들어야 하는 과제가 되고 있습니다.
수거 인프라 부족이 원료 공급을 제약
2025년, 인도에서는 PET 병 회수가 일부에 그쳐 상당량이 회수되지 못했습니다. 인도네시아의 회수율은 중간 수준이었으나, 나이지리아의 회수율은 현저히 낮았습니다. 이러한 부족으로 인해 가동 중인 재활용 라인은 안정적인 원료 공급 확보에 어려움을 겪고 있습니다. 이에 대응하여 주요 브랜드 기업들은 현재 지자체 회수 시스템에 대한 공동 투자를 추진하고 있습니다. 코카콜라는 2027년까지 라고스와 아부자에 수거 거점을 설치하는 것을 목표로 하고 있습니다. 한편, 펩시코는 인도네시아의 자원 수거 시설에 자금을 투입하여 2028년까지 해당 국가의 수거율을 높이는 것을 목표로 하고 있습니다. 그러나 이러한 노력이 확대되기 전까지는 베일공급량이 제한적이라는 점이, 특히 독자적인 네트워크를 구축할 자원을 갖추지 못한 독립 재활용 업체들에게는 단기적인 성장의 걸림돌이 될 것입니다.
부문별 분석
PET 스테이플 섬유는 아시아의 의류 및 가정용 직물 수요를 배경으로 2025년 총량의 41.58%를 차지하고 있으며, 2031년까지 연평균 7.44%의 성장률을 보일 전망입니다. 이러한 성장세에 힘입어 예측 기간 동안 재생 PET 시장에서 주요한 위치를 차지할 것으로 보입니다. 대조적으로, PET 병, 특히 식품용 병은 가장 빠르게 성장하는 하위 부문으로 부상하고 있습니다. 이러한 성장은 유럽 및 미국 각 주에서 시행되는 음료병 관련 규제는 물론, 불투명한 소재나 다층 구조의 원료에도 대응할 수 있게 된 화학 재활용 기술의 발전에 힘입은 것입니다. PET 시트 및 필름은 유럽 소매업체들이 폴리스티렌에서 순환형 열성형 제품으로 전환하고 있는 데 힘입어 완만한 증가세를 보이고 있는 반면, PET 스트랩은 틈새 시장이지만 기업들이 물류 분야에서 버진 플라스틱 사용을 줄이려는 가운데 전자상거래 주문 처리 분야에서 점차 확산되고 있습니다.
규제 체계와 식품 접촉에 관한 지침은 병용 PET 수요를 뒷받침하고 있습니다. 유럽식품안전청(EFSA) 및 미국 식품의약국(FDA)은 기계적 및 화학적 공정의 타당성 확인에 관한 명확한 기준을 설정하여 개발자들의 불확실성을 줄이고 있습니다. 세제나 퍼스널케어 제품 등 비식품용 병은 규정 준수 요건이 비교적 완화되어 있지만, 유럽의 재활용 소재 함유율 목표에서 볼 수 있듯이 브랜드의 노력으로부터 혜택을 받고 있습니다. 엔지니어링 등급 펠릿에서 전자기기용 필름에 이르는 기타 카테고리는 현재 시장 점유율이 작지만, 탈중합 공장이 엄격한 기계적 기준을 충족하는 버진 수지와 동등한 수지를 생산함에 따라 성장세가 가속화될 전망입니다.
지역별 분석
아시아태평양은 2025년 생산량의 43.36%를 차지할 것으로 예상되며, 2031년까지 연평균 8.38%의 성장률을 보일 것으로 전망됩니다. 2028년까지 병 재활용 소재의 함유율을 높이겠다는 중국의 야심찬 목표에 따라, Far Eastern New Century 등의 기업들이 생산 능력 확대를 추진하고 있습니다. 한편, 2025년부터 기준치를 적용하는 인도에서는 릴라이언스와 가네샤 에코스피어가 생산 능력에 대한 대규모 투자를 진행하고 있습니다. 인도네시아와 베트남에서는 회수율이 낮은 상황이지만, 브랜드가 자금을 지원하는 보증금 반환 제도를 통해 2028년까지 이러한 회수율이 2배로 증가할 전망입니다. 높은 회수율을 자랑하는 일본과 한국은 화학 재활용으로 중점을 옮기고 있으며, 미쓰비시 화학과 SK케미칼은 2026년부터 2027년에 걸쳐 글리콜리시스 플랜트의 가동을 시작할 예정입니다.
2025년 전 세계 총량의 대부분을 차지하는 유럽에서는 꾸준한 확대가 예상됩니다. 높은 회수율을 달성하고 있는 성숙한 보증금 제도와 베올리아, 수에즈와 같은 수직 통합형 기업의 존재 덕분에 독일, 영국, 프랑스, 이탈리아가 해당 지역의 rPET 대부분을 공동으로 활용하고 있습니다. 북유럽 국가들에서는 QR 코드를 활용한 디지털 보증금 시범 사업이 이미 눈부신 회수율을 달성하고 있습니다. 자금 조달 이니셔티브의 지원을 받아 튀르키예와 러시아는 새로운 선별·세척 공장을 건설 중이며, 2028년까지 회수율 향상을 목표로 하고 있습니다. 경쟁 구도는 변화하고 있으며, 기계적 재활용 업체들이 베일(bale)에 대한 접근 가격을 인상하는 한편, 화학적 재활용 업체들은 기존 라인에서 간과되었던 원료 흐름에 초점을 맞추었습니다.
2025년 처리량의 상당 부분을 차지하는 북미에서는 꾸준한 성장이 나타나고 있습니다. 캘리포니아주, 뉴욕주, 워싱턴주, 오리건주 등의 주가 수요를 주도하고 있으며, 2030년까지 일회용 플라스틱에 대한 야심찬 기준을 설정하고 있습니다. 미국에서는 이스트먼(Eastman)사의 주력 메탄올 분해 플랜트와 루프(Loop)사의 사업 등 중요한 프로젝트가 진행 중이며, 이는 기계적 재활용 분야의 선도 기업인 플라스티팩(Plastipack)사와 폴리퀘스트(PolyQuest)사의 노력을 보완하는 역할을 합니다. 캐나다의 ‘연방 플라스틱 등록 제도’는 2027년까지 의무적 기준으로 발전해 가고 있으며, 연간 수요가 점진적으로 증가할 것으로 전망됩니다. 멕시코에서는 알펙(Alpek)이 지원하는 선별 시스템의 업그레이드로 인해 회수율이 상승하고 있습니다. 남미, 중동 및 아프리카는 세계 수요에서 차지하는 비중은 작지만, 개발은행 자금을 통한 리버스 벤딩 및 EPR(생산자 책임 회수) 프로그램을 통해 꾸준한 진전을 보이고 있으며, 2028년까지 지역 내 회수율 향상을 목표로 하고 있습니다.
기타 혜택:
- 엑셀 형식 시장 예측(ME) 시트
- 3개월간의 애널리스트 지원
자주 묻는 질문
목차
제1장 서론
제2장 조사 방법
제3장 주요 요약
제4장 시장 구도
제5장 시장 규모와 성장 예측
제6장 경쟁 구도
제7장 시장 기회와 향후 전망
LSH 26.09.09According to Mordor Intelligence, the recyclate PET market size is expected to increase from 8.22 million tons in 2025 to 8.78 million tons in 2026 and reach 12.42 million tons by 2031, growing at a CAGR of 7.19% over 2026-2031.
This report is Segmented by Product Type (PET Staple Fiber, PET Straps, PET Sheets or Films, PET Bottles Food Grade, PET Bottles Non-Food Grade, and Other Product Types), Application (Packaging, Industrial Yarn, Building Materials, and Other Applications), and Geography (Asia-Pacific, North America, Europe, South America, and Middle-East and Africa). The Market Forecasts are Provided in Terms of Volume (Tons).
Global Recyclate PET Market Trends and Insights
Stricter Recycled-Content Mandates Drive Structural Demand
The European Packaging and Packaging Waste Regulation mandates that beverage bottles must contain recycled material. Fines for non-compliance can reach up to a company's revenue, effectively establishing a minimum demand for food-grade recyclate. In the U.S., several states, spearheaded by California, are echoing this initiative, setting minimum recycled content thresholds. This move particularly benefits converters with expansive multistate collection networks. Furthermore, regulators are tightening the definition of "recycled" to only include post-consumer streams, shifting investment focus towards curbside systems. With verification protocols like ISO 14021 and the introduction of digital passports, the standards for audits are rising. In response, proactive players are adopting blockchain technology for bale tracing. Collectively, these strategies stabilize the recyclate PET market, shielding it from the volatility of virgin-price fluctuations and ensuring consistent demand.
Brand Commitments Anchor Long-Term Offtake
By 2030, Coca-Cola's ambition for recycled content translates to an annual demand of rPET globally. Meanwhile, PepsiCo's European initiative contributes to the tally. Unilever, having swiftly achieved its recycled-plastic target, has now set an ambitious goal for 2030. These brands bolster their commitments through multiyear contracts, adjusted for inflation, which empower recyclers to obtain debt financing for new production lines. A testament to this shift in procurement dynamics is Danone's food-grade offtake agreement. While major players secure their positions, smaller mechanical recyclers find it challenging to compete for bales outside these established frameworks.
Collection Infrastructure Gaps Constrain Feedstock
In 2025, India managed to collect only a portion of its PET bottles, leaving a significant amount unrecovered. Indonesia's collection rate was moderate, while Nigeria's was considerably low. This shortfall has left installed recycling lines struggling for a consistent input. In response, major brands are now co-investing in municipal systems. Coca-Cola has set its sights on establishing collection points in Lagos and Abuja by 2027. Meanwhile, PepsiCo is channeling funds into material-recovery facilities in Indonesia, targeting an improved national collection rate by 2028. However, until these initiatives expand, the limited flow of bales will hinder near-term growth, especially for independent recyclers who lack the resources to develop their own networks.
Other drivers and restraints analyzed in the detailed report include:
- Cost Parity in High-Oil Scenarios Tilts Economics
- Depolymerization Unlocks Previously Unrecyclable Streams
- Virgin PET Oversupply Pressures Margins
For complete list of drivers and restraints, kindly check the Table Of Contents.
Segment Analysis
PET staple fiber held 41.58% of 2025 volume on the back of Asian apparel and home-textile demand, and it is set to grow at 7.44% annually through 2031. This momentum positions it as the dominant player in the recyclate PET market over the forecast period. In contrast, PET bottles, specifically food-grade ones, are emerging as the fastest-growing sub-segment. Their growth is bolstered by beverage-bottle mandates in Europe and various U.S. states, alongside advancements in chemical recycling that now accommodate opaque and multilayer feedstock. While PET sheets and films see gradual increases-thanks to a shift by European retailers from polystyrene to circular thermoforms-PET straps, though niche, are making inroads in e-commerce fulfillment as companies seek to reduce virgin plastic use in logistics.
Regulatory frameworks and food-contact guidelines bolster the demand for bottle-grade PET: The EFSA and FDA have set clear standards for mechanical and chemical process validation, alleviating uncertainties for developers. While non-food bottles, such as those for detergents and personal care, face less stringent compliance, they still benefit from brand commitments, exemplified by targets for recycled content in Europe. Other categories, ranging from engineering-grade pellets to films for electronics, currently occupy a small market share but stand to gain momentum as depolymerization plants produce virgin-equivalent resin that meets stringent mechanical standards.
Complete Report Scope:
- By Product Type
- PET Staple Fiber
- PET Straps
- PET Sheets or Films
- PET Bottles (Food Grade)
- PET Bottles (Non-food Grade)
- Other Product Types
- By Application
- Packaging
- Industrial Yarn
- Building Materials
- Other Applications
- By Geography
- Asia-Pacific
- China
- India
- Japan
- South Korea
- Malaysia
- Thailand
- Indonesia
- Vietnam
- Rest of Asia-Pacific
- North America
- United States
- Canada
- Mexico
- Europe
- Germany
- United Kingdom
- France
- Italy
- Spain
- NORDIC Countries
- Turkey
- Russia
- Rest of Europe
- South America
- Brazil
- Argentina
- Colombia
- Rest of South America
- Middle-East and Africa
- Saudi Arabia
- Qatar
- United Arab Emirates
- Nigeria
- Egypt
- South Africa
- Rest of Middle-East and Africa
- Asia-Pacific
Geography Analysis
Asia-Pacific accounted for 43.36% of the 2025 volume and is forecast to grow at 8.38% annually through 2031. China's ambitious target for bottle-recycled content by 2028 has prompted capacity expansions from players like Far Eastern New Century. Meanwhile, India, enforcing a threshold from 2025, has seen Reliance and Ganesha Ecosphere invest in substantial capacity. Despite Indonesia and Vietnam lagging with collection rates, brand-funded deposit-return schemes are set to double these rates by 2028. Japan and South Korea, boasting high collection rates, are shifting focus to chemical recycling, with Mitsubishi Chemical and SK Chemicals set to commission glycolysis plants in 2026-2027.
Europe, capturing a significant portion of the global 2025 volume, is projected to expand steadily. Thanks to mature deposit schemes achieving high collection rates and the presence of vertically integrated players like Veolia and Suez, Germany, the United Kingdom, France, and Italy collectively utilize a major share of the region's rPET. In the Nordics, pilots of digital deposits using QR codes have already surpassed impressive return rates. With backing from financing initiatives, Turkey and Russia are establishing new sortation and wash plants, targeting improved collection rates by 2028. The competition landscape is shifting, with mechanical recyclers driving up prices for bale access, while chemical recyclers are honing in on streams that conventional lines overlook.
North America, accounting for a notable share of the 2025 volume, is witnessing steady growth. States like California, New York, Washington, and Oregon are spearheading the demand, setting ambitious thresholds for single-use plastics by 2030. The U.S. is home to significant projects, including Eastman's flagship methanolysis plant and Loop's initiative, both complementing the efforts of mechanical giants Plastipak and PolyQuest. Canada's Federal Plastics Registry is evolving into mandatory thresholds by 2027, projecting incremental annual demand. In Mexico, collection rates are on the rise, thanks to sortation upgrades backed by Alpek. While South America and the Middle-East and Africa account for a smaller share of global demand, they're making strides with development-bank-funded reverse-vending and EPR programs, aiming to elevate regional collection rates by 2028.
- Alpek S.A.B. de C.V.
- Alpla Group
- Biffa
- Evergreen
- Far Eastern New Century Corporation
- Ganesha Ecosphere Ltd.
- Indorama Ventures Public Company Limited
- Jiangsu Zhongyuan Industrial Group Co. Ltd
- Loop Industries Inc.
- Phoenix Technologies
- Plastipak Holdings Inc.
- PolyQuest Inc.
- Reliance Industries Ltd
- SUEZ
- Veolia
- Verdeco Recycling Inc.
- Visy
Additional Benefits:
- The market estimate (ME) sheet in Excel format
- 3 months of analyst support
TABLE OF CONTENTS
1 Introduction
- 1.1 Study Assumptions and Market Definition
- 1.2 Scope of the Study
2 Research Methodology
3 Executive Summary
4 Market Landscape
- 4.1 Market Overview
- 4.2 Market Drivers
- 4.2.1 Stricter recycled-content mandates (EU SUPD, PPWR, US state EPR)
- 4.2.2 Brand-led 2030 net-zero and rPET procurement targets
- 4.2.3 Cost parity of rPET chips vs. virgin PET in high-oil scenarios
- 4.2.4 Scale-up of depolymerisation unlocking food-grade coloured rPET
- 4.2.5 Emerging digital-passport regulations raising traceability premiums
- 4.3 Market Restraints
- 4.3.1 PET bottle collection gaps in emerging economies
- 4.3.2 Virgin-PET oversupply cycles depressing rPET margins
- 4.3.3 High CAPEX for advanced recycling and food-grade compliance
- 4.4 Value Chain Analysis
- 4.5 Porter's Five Forces
- 4.5.1 Threat of New Entrants
- 4.5.2 Bargaining Power of Suppliers
- 4.5.3 Bargaining Power of Buyers
- 4.5.4 Threat of Substitutes
- 4.5.5 Competitive Rivalry
5 Market Size and Growth Forecasts (Volume)
- 5.1 By Product Type
- 5.1.1 PET Staple Fiber
- 5.1.2 PET Straps
- 5.1.3 PET Sheets or Films
- 5.1.4 PET Bottles (Food Grade)
- 5.1.5 PET Bottles (Non-food Grade)
- 5.1.6 Other Product Types
- 5.2 By Application
- 5.2.1 Packaging
- 5.2.2 Industrial Yarn
- 5.2.3 Building Materials
- 5.2.4 Other Applications
- 5.3 By Geography
- 5.3.1 Asia-Pacific
- 5.3.1.1 China
- 5.3.1.2 India
- 5.3.1.3 Japan
- 5.3.1.4 South Korea
- 5.3.1.5 Malaysia
- 5.3.1.6 Thailand
- 5.3.1.7 Indonesia
- 5.3.1.8 Vietnam
- 5.3.1.9 Rest of Asia-Pacific
- 5.3.2 North America
- 5.3.2.1 United States
- 5.3.2.2 Canada
- 5.3.2.3 Mexico
- 5.3.3 Europe
- 5.3.3.1 Germany
- 5.3.3.2 United Kingdom
- 5.3.3.3 France
- 5.3.3.4 Italy
- 5.3.3.5 Spain
- 5.3.3.6 NORDIC Countries
- 5.3.3.7 Turkey
- 5.3.3.8 Russia
- 5.3.3.9 Rest of Europe
- 5.3.4 South America
- 5.3.4.1 Brazil
- 5.3.4.2 Argentina
- 5.3.4.3 Colombia
- 5.3.4.4 Rest of South America
- 5.3.5 Middle-East and Africa
- 5.3.5.1 Saudi Arabia
- 5.3.5.2 Qatar
- 5.3.5.3 United Arab Emirates
- 5.3.5.4 Nigeria
- 5.3.5.5 Egypt
- 5.3.5.6 South Africa
- 5.3.5.7 Rest of Middle-East and Africa
- 5.3.1 Asia-Pacific
6 Competitive Landscape
- 6.1 Market Concentration
- 6.2 Strategic Moves
- 6.3 Market Share (%)/Ranking Analysis
- 6.4 Company Profiles (includes Global level Overview, Market level overview, Core Segments, Financials as available, Strategic Information, Products and Services, and Recent Developments)
- 6.4.1 Alpek S.A.B. de C.V.
- 6.4.2 Alpla Group
- 6.4.3 Biffa
- 6.4.4 Evergreen
- 6.4.5 Far Eastern New Century Corporation
- 6.4.6 Ganesha Ecosphere Ltd.
- 6.4.7 Indorama Ventures Public Company Limited
- 6.4.8 Jiangsu Zhongyuan Industrial Group Co. Ltd
- 6.4.9 Loop Industries Inc.
- 6.4.10 Phoenix Technologies
- 6.4.11 Plastipak Holdings Inc.
- 6.4.12 PolyQuest Inc.
- 6.4.13 Reliance Industries Ltd
- 6.4.14 SUEZ
- 6.4.15 Veolia
- 6.4.16 Verdeco Recycling Inc.
- 6.4.17 Visy
7 Market Opportunities and Future Outlook
- 7.1 White-space and Unmet-Need Assessment


