
|
시장보고서
상품코드
2121794
비료 첨가제 : 시장 점유율 분석, 업계 동향과 통계, 성장 예측(2026-2031년)Fertilizer Additives - Market Share Analysis, Industry Trends & Statistics, Growth Forecasts (2026 - 2031) |
||||||
 Mordor Intelligence
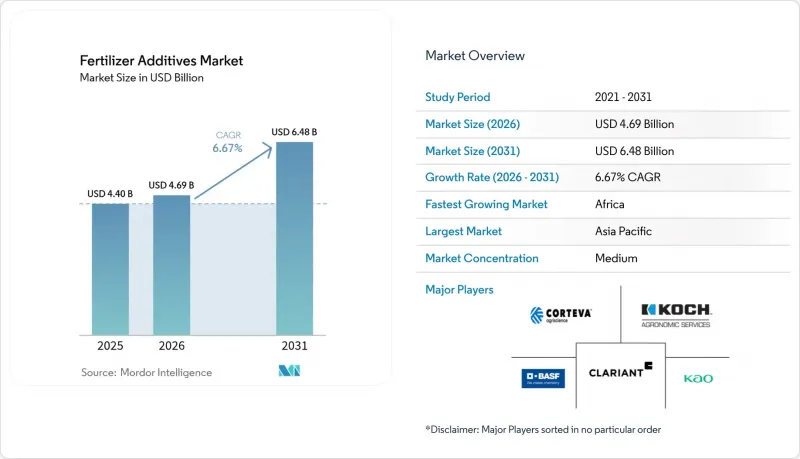
Mordor Intelligence에 의하면, 2026년 비료 첨가제 시장 규모는 46억 9,000만 달러로 추정되며, 2025년 44억 달러에서 2031년에는 64억 8,000만 달러에 달할 것으로 예측됩니다.
또한 2026-2031년 연평균 성장률(CAGR)은 6.67%를 기록할 전망입니다.
본 보고서는 기능별(억제제, 코팅제, 과립화 보조제 등), 형태별(고체, 액체, 마이크로캡슐화), 용도별(요소, 질산암모늄, 인산이암모늄(DAP) 등),작물(곡물, 유지종자 등), 지역(북미, 유럽, 아시아태평양 등)별로 분류되어 있습니다. 본 보고서는 시장 규모(달러)를 기반으로 한 시장 전망을 제공합니다.
세계 비료 첨가제 시장 동향 및 인사이트
고집약형 농업 지역에서의 비료 소비량 증가
곡물 수요의 급증으로 인해 이미 최대한의 집약적 농업이 이루어지고 있는 지역에서 첨가제 사용량이 증가하고 있습니다. 『OECD-FAO 아웃룩』에 따르면, 2032년까지 전 세계 곡물 생산량은 31억 톤에 달할 것으로 예상되며, 그 대부분은 아시아와 아프리카에서 생산될 것입니다. 첨가제는 습도가 높고 관개가 이루어지는 시스템에서 증가하는 영양소 손실을 억제하며, 현재 500만 에이커 이상의 농지에서 시비 관개 중 휘발을 줄이는 개선된 배합이 채택되고 있습니다(worldfertilizer.com). 점적 관개나 피벗 관개 시스템을 이용하는 생산자들은 90%에 가까운 영양소 이용 효율을 달성하고 있으며, 이는 고습도 환경에서도 혼합 비료의 유동성을 유지하는 응집 방지제 및 코팅제의 추가적인 보급을 촉진하고 있습니다. 식량 안보를 위한 자본 유입으로 인해 첨가제 공급업체에게는 예측 가능한 장기적인 수요 곡선이 형성되고 있습니다.
고효율 비료(EEF)에 대한 수요
198억 달러 규모의 부가가치형 비료는 생물촉진제, 억제제, 서방형 코팅을 시비 시기나 작물의 생육 단계에 맞추어 조정된 단일 입상 비료에 통합하고 있습니다. NBPT와 같은 우레아제 억제제는 Duromide 안정제와 결합하여 암모니아 손실을 54% 감소시켜, 생산자가 추가적인 경작을 하지 않고도 단백질 함량이 높은 곡물을 수확할 수 있도록 지원합니다. 미국의 생물촉진제 매출액은 2026년까지 3배인 12억 달러에 달할 것으로 예상되며, 기존의 영양 관리 프로그램에 생물 유래 성분이 통합될 전망입니다. 폴리머 코팅을 통한 서방형 제품은 유효 성분공급 기간을 더욱 좁혀, 비료 첨가제 시장을 공급과 뿌리 수요를 동기화하는 보다 스마트한 다층 필름으로 이끌고 있습니다.
농업 투입재 비용 상승
2025년 초, 비료 가격은 11% 상승했으나, 곡물 가격의 부진으로 인해 농가의 이익률은 압박받고 있습니다. UAN28의 납품 가격은 1톤당 354달러, DAP는 765달러,MAP은 810달러에 달하고 있어, 자금 사정에 어려움을 겪는 농가에게 고가의 첨가제 판매는 점점 더 어려워지고 있습니다. 라보뱅크의 ‘구매력 지수’는 특히 농가 지출의 대부분을 차지하는 질소 및 인산염 부문에서 수요 감소 위험을 시사하고 있습니다. 아프리카와 남아시아의 소규모 농가들은 가장 심각한 딜레마에 직면해 있으며, 투자 회수 효과가 입증되었음에도 불구하고 생산 효율을 높이는 자재의 구매를 미루는 경우가 많습니다.
부문 분석
2025년, 비료 첨가제 시장에서 고결 방지제가 매출의 36.45%를 차지하며 가장 큰 점유율을 기록했습니다. 이러한 우위는 습도가 높은 운송 시즌이나 장기간의 창고 보관 중에 입자의 유동성을 유지하는 데 이 소재가 수행하는 매우 중요한 역할에 기인합니다. 지방 아민 블렌드 및 계면활성제를 줄인 시스템은 철도 차량 내의 압축을 견딜 수 있는 더 얇고 유연한 필름을 형성함으로써 초기 바이오 왁스를 능가하는 성능을 발휘하고 있습니다. 한편, 코팅제는 45일에서 90일에 걸쳐 방출을 제어하는 폴리머 및 바이오폴리머 필름의 인기에 힘입어 연평균 성장률(CAGR) 9.32%로 성장 선두를 달리고 있습니다. 이 두 주요 카테고리는 신뢰성과 영양소 공급 시기가 결합되어 구매 결정을 좌우한다는 점을 보여줍니다.
2위 카테고리도 진화하고 있습니다. 억제제는 일산화이질소 배출 억제를 요구하는 규제에 대응하고 있으며, 과립화 보조제는 엄격한 입자 크기 공차가 요구되는 정밀 살포기에서 지지를 넓혀가고 있습니다. 신흥 하이브리드 제품은 응집 방지, 억제제, 코팅 기능을 단일 첨가제에 융합시켜 첨가율을 줄이고 공급망을 간소화하고 있습니다. 부식 방지 솔루션이 액체 비료 분야에 진출하는 한편, 작업자 노출 기준이 엄격해지는 분야에서는 먼지 제거제가 기세를 더하고 있습니다. 비료 첨가제 시장은 한 번의 투여로 여러 가지 과제를 해결할 수 있는 다목적 화학제품으로 계속해서 기울고 있습니다.
과립형 영양소 혼합물이 시장을 주도하며 매출의 67.10%를 차지하고, 탈크계 컨디셔너, 왁스, 지방아민 분말에 안정적인 현금 흐름을 가져다주고 있습니다. 벌크 터미널 및 바지선 운영업체는 적재물의 유동성을 유지하기 위해 고체 방결제제에 의존하고 있습니다. 액체 제품은 규모는 작지만 성장세가 두드러지며, 비료 관개 재배 면적의 확대와 드론 살포의 보급을 반영하여 7.98%의 연평균 성장률(CAGR)을 기록하고 있습니다. 액체 분산액은 저장 탱크 내에서 빠르게 용해되어, 수확량 지도에 맞추어 가변 비율로 인라인 주입이 가능합니다.
마이크로캡슐화된 형태는 이 두 극단 사이의 중간에 위치합니다. 이 형태는 유효 성분을 보호하고 방출을 지연시킬 뿐만 아니라, 폴리젖산이나 전분으로 만든 퇴비화 가능한 껍질을 통해 다가오는 미세 플라스틱 규제에도 대응하고 있습니다. 밀리켄(Milliken)사의 마이크로캡슐 분야 진출은 차세대 전달 경로를 향한 자본의 이동을 여실히 보여주고 있습니다. 비료 첨가제 시장에서는 제형이 통합되는 추세입니다. 일부 공급업체는 현재 액체 종자 처리제와 추비 작업용 건조 코팅제를 모두 포함하는 키트를 제공하여, 한 시즌 내내 일관된 영양 관리를 보장하고 있습니다.
지역별 분석
아시아태평양은 중국과 인도에 밀집된 소규모 농지가 총 약 30억 명에게 서비스를 제공하고 있기 때문에 2025년에도 38.40%의 점유율로 매출 1위 자리를 유지했습니다. 중국의 인산염 수출 일시적 제한은 공급을 국내 유통 경로로 재분배하고 수입 의존도를 낮추기 때문에 국내 첨가제 제품 라인에 혜택을 주고 있습니다. 인도의 화학 부문은 토양 검사실과 농장용 센서에 자금을 지원하는 ‘디지털 농업 미션(Digital Agriculture Mission)’의 뒷받침을 받아, 2025년까지 특수 화학제품 매출이 500억 달러에 달할 것으로 전망됩니다. 비료 첨가제 시장에서 국내 제조업체들은 통합된 공급망을 활용하여 운임 시장의 변동에도 불구하고 배송 비용을 낮게 유지하고 있습니다.
아프리카에서는 정부와 민간 자본이 새로운 생산 거점에 자금을 투입하고 있어 연평균 성장률(CAGR)이 10.02%로 가장 높은 성장세를 보이고 있습니다. 나이지리아의 150만 톤 규모 공장과 인드라마(Indrama)사의 280만 톤 규모 확장을 견인력으로 삼아, 향후 10년 말까지 영양소 소비량은 760만 톤에서 1,360만 톤으로 급증할 전망입니다. 서아프리카만 해도 2030년까지 460만 톤을 넘어설 가능성이 있습니다. 도입에는 포장 제품 비용이나 농촌 지역의 자금 조달 격차와 같은 ‘라스트 원 마일’ 과제가 여전히 존재하지만, 첨가제 공급업체들은 유동성 조절제 제공과 농가에 대한 교육을 결합함으로써 수용성을 높일 여지가 있다고 보고 있습니다.
북미와 유럽에서는 연평균 성장률(CAGR)이 각각 5.05%와 4.38%를 기록하며, 성숙기에 접어들었음에도 혁신적인 성장을 보이고 있습니다. 정밀 농업이 수요 증가의 대부분을 뒷받침하고 있으며, 영국 농장의 28%는 질소 고정 및 합성 비료 사용 억제를 목적으로 한 콩과 작물의 윤작을 활용하여 시비 계획을 조정하고 있습니다. 2026년에 도입될 EU의 탄소 국경 조정 메커니즘(CBAM)에서는 비료 수입업체에게 제품에 포함된 탄소량 공개를 의무화하여, 이에 따라 현지 저탄소 배합 비료가 유리해질 것입니다. 두 대륙 모두에서 생물 유래 대체재 시장 점유율이 확대되고 있지만, 추운 기후나 제한된 파종 기간에서도 성능 데이터가 견고한 덕분에 화학 코팅은 여전히 자리를 잡고 있습니다.
기타 혜택:
- 엑셀 형식 시장 예측(ME) 시트
- 3개월간의 애널리스트 지원
자주 묻는 질문
목차
제1장 서론
제2장 조사 방법
제3장 주요 요약
제4장 시장 구도
제5장 시장 규모와 성장 예측
제6장 경쟁 구도
제7장 시장 기회와 향후 전망
LSH 26.09.09According to Mordor Intelligence, the fertilizer additives market size in 2026 is estimated at USD 4.69 billion, growing from 2025 value of USD 4.40 billion with 2031 projections showing USD 6.48 billion, growing at 6.67% CAGR over 2026-2031.
This report is Segmented by Function (Inhibitors, Coating Agents, Granulation Aids, and More), Form (Solid, Liquid, and Micro-Encapsulated), Application (Urea, Ammonium Nitrate, Diammonium Phosphate (DAP), and More), Crop (Cereals and Grains, Oilseeds, and More) and Geography (North America, Europe, Asia-Pacific, and More). The Report Offers Market Forecasts in Terms of Value (USD).
Global Fertilizer Additives Market Trends and Insights
Rising Fertilizer Consumption in High-Intensity Farming Regions
Surging cereal demand lifts additive volumes in zones that already farm at maximum intensity. The OECD-FAO Outlook sees global cereals hitting 3.1 billion tons by 2032, most of it from Asia and Africa. Additives arrest nutrient losses that climb in humid, irrigated systems, and more than 5 million acres now run on enhanced formulations that cut volatilization during fertigation worldfertilizer.com. Growers using drip and pivot systems achieve nutrient-use efficiency near 90%, propelling further uptake of anti-caking and coating chemistries that keep blends free-flowing under high humidity. Capital inflows toward food security create predictable long-term demand curves for additive suppliers.
Demand for Enhanced-Efficiency Fertilizers (EEF)
Value-added fertilizers worth USD 19.8 billion merge biostimulants, inhibitors, and controlled-release coatings into single granules tailored for timing and crop phase. Urease inhibitors such as NBPT lower ammonia losses by 54% when matched with Duromide stabilizer, helping growers derive higher protein grain without extra passes. U.S. biostimulant sales will triple to USD 1.2 billion by 2026, embedding biologicals into conventional nutrient programs. Polymer-coated controlled-release variants further tighten delivery windows, nudging the fertilizer additives market toward smarter, multi-layer films that synchronize supply and root demand.
Rising Cost of Crop Inputs
Fertilizer prices rose 11% in early 2025, squeezing farm margins as grain prices lag. Delivered UAN28 reached USD 354 per ton, DAP USD 765, and MAP USD 810, making premium additives a harder sell for cash-strapped growers. Rabobank's affordability index signals demand destruction risk, especially in nitrogen and phosphate categories that already command the bulk of farm spend. Smallholders in Africa and South Asia face the harshest trade-offs, often deferring enhanced-efficiency purchases despite proven payback.
Other drivers and restraints analyzed in the detailed report include:
- Regulatory Push for Nutrient-Use Efficiency
- Cryogenic Low-Carbon Ammonia Logistics Creating New Anti-Caking Needs
- Tightening Environmental Regulations on Additives
For complete list of drivers and restraints, kindly check the Table Of Contents.
Segment Analysis
Anti-caking products generated the largest slice of the fertilizer additives market in 2025, at 36.45% of revenue. This dominance stems from the material's vital role in preserving particle flow during humid shipping seasons and long warehouse layovers. Fatty amine blends and reduced-surfactant systems now outperform early bio-waxes by creating thinner, more flexible films that withstand compression in rail cars. Coating agents, however, wear the growth crown with a 9.32% CAGR, propelled by polymer and biopolymer films that meter release over 45- to 90-day spans. These twin leaders show how reliability and nutrient timing together move purchasing decisions.
Second-tier categories also evolve. Inhibitors answer regulatory calls to curb nitrous oxide, and granulation aids win converts in precision applicators that demand tight particle tolerances. Emerging hybrid products fuse anti-caking, inhibitor, and coating functions into single additives that cut inclusion rates and simplify supply chains. Corrosion prevention solutions enter liquid fertilizer service while dedusting agents gain momentum where worker exposure standards tighten. The fertilizer additives market continues to gravitate toward multi-purpose chemistries able to solve several pain points with one dose.
Granular nutrient blends keep solids on top, translating to 67.10% of revenues and steady cash flows for talc-based conditioners, waxes, and fatty amine powders. Bulk terminals and barge operators rely on solid anti-caking to keep piles free-flowing. Liquids, though smaller, are the climbers, logging an 7.98% CAGR that mirrors rising fertigation acres and drone spray adoption. Liquid dispersions dissolve quickly in nurse tanks, enabling inline injection at variable rates that match yield maps.
Micro-encapsulated formats sit between the two poles. They protect active ingredients, delay the release, and satisfy looming microplastic rules with compostable shells made from polylactic acid or starch. Milliken's push into microcapsules illustrates capital migration toward next-generation delivery routes. In the fertilizer additives market, form factors are converging; some suppliers now offer kits that include both liquid seed dressing and companion dry coating for top-dress passes, ensuring consistent nutrient control across the season.
Complete Report Scope:
- By Function
- Inhibitors
- Coating Agents
- Granulation Aids
- Anti-Caking Agents
- Dedusting Agents
- Corrosion Inhibitors
- Anti-Foaming Agents
- Other Niche Functions
- By Form
- Solid
- Liquid
- Micro-encapsulated
- By Application
- Urea
- Ammonium Nitrate
- Diammonium Phosphate (DAP)
- Mono-Ammonium Phosphate (MAP)
- Ammonium Sulfate
- Triple Superphosphate (TSP)
- Potash Blends
- Other Specialty Fertilizers
- By Crop
- Cereals and Grains
- Oilseeds
- Fruits and Vegetables
- Turf and Ornamentals
- Others
- By Geography
- North America
- United States
- Canada
- Mexico
- Rest of North America
- Europe
- Germany
- France
- United Kingdom
- Spain
- Italy
- Russia
- Rest of Europe
- Asia-Pacific
- China
- India
- Japan
- Australia
- South Korea
- Rest of Asia-Pacific
- Middle East
- Saudi Arabia
- United Arab Emirates
- Rest of Middle East
- Africa
- South Africa
- Egypt
- Rest of Africa
- North America
Geography Analysis
Asia-Pacific retained the sales crown at 38.40% in 2025 thanks to dense small-plot farms in China and India that collectively serve nearly 3 billion people. Domestic additive lines benefit from China's temporary phosphate export limits, which reshuffle supply into local channels and dampen import reliance. India's chemicals sector is on track to touch USD 50 billion in specialty revenues by 2025, aided by the Digital Agriculture Mission that funds soil labs and on-farm sensors. Within the fertilizer additives market size, domestic producers leverage integrated supply chains to keep delivered costs low despite volatile freight markets.
Africa showcases the fastest 10.02% CAGR as governments and private capital pour funds into new production hubs. Consumption will jump from 7.6 million to 13.6 million tons of nutrients by decade's end, led by Nigeria's 1.5 million ton plant and Indorama's 2.8 million ton expansion. West Africa alone could exceed 4.6 million tons by 2030. Adoption still faces last-mile hurdles such as bagged product costs and rural financing gaps, but additive suppliers see room to package flow conditioners with farmer training to lift acceptance.
North America and Europe register mature yet innovative growth at 5.05% and 4.38% CAGR. Precision agriculture underpins most incremental demand; 28% of U.K. farms adjust fertilizer plans using legume rotations to fix nitrogen and curb synthetic application. The EU Carbon Border Adjustment Mechanism, coming in 2026, will require fertilizer importers to disclose embedded carbon, advantaging local low-emission formulations. Across both continents, biological alternatives gain a share, yet chemical coatings persist because their performance data remain robust under colder climates and tight planting windows.
- BASF SE
- Corteva Agriscience
- Clariant International Ltd
- KAO Corporation
- Koch Agronomic Services
- Arkema (ArrMaz)
- Dorf Ketal Company LLC
- Michelman Inc.
- Novochem Group
- Lanxess AG
- Croda International Public Limited Company (Cargill, Incorporated)
- Hubei Forbon Technology Co., Ltd.
- Jiangsu Kolod Food Ingredients Co., Ltd.
- TIMAC AGRO INDIA PRIVATE LIMITED
- Nutrien Ltd.
- CF Industries
- The Mosaic Company
- Yara International
- ADM
- ICL Group
Additional Benefits:
- The market estimate (ME) sheet in Excel format
- 3 months of analyst support
TABLE OF CONTENTS
1 Introduction
- 1.1 Study Assumptions and Market Definition
- 1.2 Scope of the Study
2 Research Methodology
3 Executive Summary
4 Market Landscape
- 4.1 Market Overview
- 4.2 Market Drivers
- 4.2.1 Rising fertilizer consumption in high-intensity farming regions
- 4.2.2 Demand for enhanced-efficiency fertilizers (EEF)
- 4.2.3 Regulatory push for nutrient-use efficiency
- 4.2.4 Precision-agriculture adoption enabling micro-dosing
- 4.2.5 Cryogenic low-carbon ammonia logistics creating new anti-caking needs
- 4.2.6 Soil-microbiome friendly biopolymer coatings
- 4.3 Market Restraints
- 4.3.1 Rising cost of crop inputs
- 4.3.2 Tightening environmental regulations on additives
- 4.3.3 Petrochemical feedstock volatility for specialty surfactants
- 4.3.4 Rapid emergence of biological substitutes
- 4.4 Regulatory Landscape
- 4.5 Technological Outlook
- 4.6 Porter's Five Forces Analysis
- 4.6.1 Bargaining Power of Suppliers
- 4.6.2 Bargaining Power of Buyers
- 4.6.3 Threat of New Entrants
- 4.6.4 Threat of Substitute Products
- 4.6.5 Intensity of Competitive Rivalry
5 Market Size and Growth Forecasts (Value, USD)
- 5.1 By Function
- 5.1.1 Inhibitors
- 5.1.2 Coating Agents
- 5.1.3 Granulation Aids
- 5.1.4 Anti-Caking Agents
- 5.1.5 Dedusting Agents
- 5.1.6 Corrosion Inhibitors
- 5.1.7 Anti-Foaming Agents
- 5.1.8 Other Niche Functions
- 5.2 By Form
- 5.2.1 Solid
- 5.2.2 Liquid
- 5.2.3 Micro-encapsulated
- 5.3 By Application
- 5.3.1 Urea
- 5.3.2 Ammonium Nitrate
- 5.3.3 Diammonium Phosphate (DAP)
- 5.3.4 Mono-Ammonium Phosphate (MAP)
- 5.3.5 Ammonium Sulfate
- 5.3.6 Triple Superphosphate (TSP)
- 5.3.7 Potash Blends
- 5.3.8 Other Specialty Fertilizers
- 5.4 By Crop
- 5.4.1 Cereals and Grains
- 5.4.2 Oilseeds
- 5.4.3 Fruits and Vegetables
- 5.4.4 Turf and Ornamentals
- 5.4.5 Others
- 5.5 By Geography
- 5.5.1 North America
- 5.5.1.1 United States
- 5.5.1.2 Canada
- 5.5.1.3 Mexico
- 5.5.1.4 Rest of North America
- 5.5.2 Europe
- 5.5.2.1 Germany
- 5.5.2.2 France
- 5.5.2.3 United Kingdom
- 5.5.2.4 Spain
- 5.5.2.5 Italy
- 5.5.2.6 Russia
- 5.5.2.7 Rest of Europe
- 5.5.3 Asia-Pacific
- 5.5.3.1 China
- 5.5.3.2 India
- 5.5.3.3 Japan
- 5.5.3.4 Australia
- 5.5.3.5 South Korea
- 5.5.3.6 Rest of Asia-Pacific
- 5.5.4 Middle East
- 5.5.4.1 Saudi Arabia
- 5.5.4.2 United Arab Emirates
- 5.5.4.3 Rest of Middle East
- 5.5.5 Africa
- 5.5.5.1 South Africa
- 5.5.5.2 Egypt
- 5.5.5.3 Rest of Africa
- 5.5.1 North America
6 Competitive Landscape
- 6.1 Market Concentration
- 6.2 Strategic Moves
- 6.3 Market Share Analysis
- 6.4 Company Profiles (includes Global level Overview, Market level overview, Core Segments, Financials as available, Strategic Information, Market Rank/Share for key companies, Products and Services, and Recent Developments)
- 6.4.1 BASF SE
- 6.4.2 Corteva Agriscience
- 6.4.3 Clariant International Ltd
- 6.4.4 KAO Corporation
- 6.4.5 Koch Agronomic Services
- 6.4.6 Arkema (ArrMaz)
- 6.4.7 Dorf Ketal Company LLC
- 6.4.8 Michelman Inc.
- 6.4.9 Novochem Group
- 6.4.10 Lanxess AG
- 6.4.11 Croda International Public Limited Company (Cargill, Incorporated)
- 6.4.12 Hubei Forbon Technology Co., Ltd.
- 6.4.13 Jiangsu Kolod Food Ingredients Co., Ltd.
- 6.4.14 TIMAC AGRO INDIA PRIVATE LIMITED
- 6.4.15 Nutrien Ltd.
- 6.4.16 CF Industries
- 6.4.17 The Mosaic Company
- 6.4.18 Yara International
- 6.4.19 ADM
- 6.4.20 ICL Group