

|
시장보고서
상품코드
2121796
데이터센터 자동화 : 시장 점유율 분석, 업계 동향과 통계, 성장 예측(2026-2031년)Data Center Automation - Market Share Analysis, Industry Trends & Statistics, Growth Forecasts (2026 - 2031) |
||||||
 Mordor Intelligence
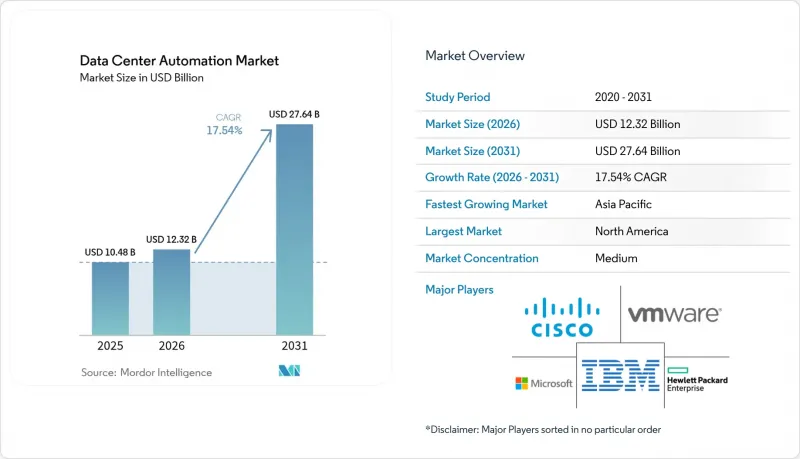
Mordor Intelligence에 의하면, 2026년 데이터센터 자동화 시장 규모는 123억 2,000만 달러로 추정되며, 2025년 104억 8,000만 달러에서 성장하여 2031년에는 276억 4,000만 달러에 달할 것으로 예측됩니다.
또한 2026-2031년 연평균 성장률(CAGR)은 17.54%를 기록할 전망입니다.
본 보고서는 솔루션별(서버 자동화, 네트워크 자동화 등), 데이터센터 티어별(Tier 1 및 2, Tier 3, Tier 4), 도입 형태별(On-Premise, 클라우드),데이터센터 유형별(하이퍼스케일러/클라우드 서비스 제공업체, 코로케이션 제공업체 등), 그리고 지역별로 분류되어 있습니다. 시장 예측은 금액(달러) 기준으로 제시되어 있습니다.
전 세계 데이터센터 자동화 시장 동향 및 인사이트
클라우드 및 하이퍼스케일 시설의 급증
2025년에 예정된 하이퍼스케일 캠퍼스에 대한 투자액은 2,500억 달러 이상에 달할 것으로 예상되며, 이는 용량 계획, 열 관리, 워크로드의 라이브 마이그레이션에 걸친 자동화의 필요성을 야기하고 있습니다. 사업자들은 서비스 수준 요구 사항을 충족하면서 운영자의 개입을 최소화하고, 몇 초 만에 컴퓨팅, 전력, 냉각 리소스를 할당할 수 있는 AI 기반 컨트롤러를 중심으로 시설을 설계하고 있습니다. 자본 집약적인 확장을 위해서는 배선 및 테스트를 마친 모듈식 블록이 채택되고 있으며, 오케스트레이션 소프트웨어는 각 블록을 즉시 감지하고, 기준값을 확립하며, 통합해야 합니다. 전 세계 벤더들은 수천 개의 자산에 걸쳐 정책을 적용하는 인텐트 기반 플랫폼으로 이에 대응하고 있으며, 확장 속도를 경쟁 우위로 전환하고 있습니다.
에너지 효율이 뛰어나고 지속 가능한 운영에 대한 수요
현재 데이터센터는 전 세계 전력 소비량의 1-3%를 차지하고 있지만, AI의 보급이 가속화되면 2030년까지 그 비율이 5%로 상승할 가능성이 있다는 예측이 있습니다. 유럽의 ‘기후 중립 데이터센터 협약(Climate Neutral Data Centre Pact)’과 같은 엄격한 이니셔티브에서는 신규 시설의 PUE 상한을 1.3으로 설정하고 있으며, 이에 따라 사업자들은 기류, 팬 속도, 워크로드 배치를 지속적으로 조정하는 자동화 기술 도입을 요구받고 있습니다. AI를 활용한 제어 시스템은 초기 도입 단계에서 이미 냉각 전력 소비를 최대 40%까지 줄이고 있으며, 검증 가능한 탄소 배출 감축 실적을 제시하는 사업자는 자사의 ESG 목표를 달성해야 하는 하이퍼스케일 테넌트를 유치하고 있습니다. 자동화된 지속가능성 보고는 규정 준수 부담을 더욱 줄이고, 규제 당국에 대한 투명성을 높이고 있습니다.
레거시 시스템의 상호 운용성 장벽
많은 사업자는 여전히 API가 제한적인 독자 사양의 하드웨어를 운영하고 있으며, 최신 오케스트레이션이 정착되기 전에 비용이 많이 드는 맞춤형 커넥터를 도입할 수밖에 없습니다. 네트워크 팀은 설정 오류가 있는 스크립트로 인한 서비스 중단을 우려하여, 미션 크리티컬 트래픽을 처리하는 코어 스위치의 자동화를 주저하는 경우가 많습니다. 레거시 환경 전반에 걸친 설계 표준화가 부족하다는 점도 배포를 더욱 복잡하게 만듭니다. 특정 사이트를 위해 작성된 템플릿을 다른 사이트에 그대로 적용할 수 있는 경우는 거의 없기 때문입니다. 각 벤더사는 풍부한 플러그인 마켓플레이스나 장치 설정을 리버스 엔지니어링하는 AI 기반 감지 도구를 제공하며 대응하고 있지만, 기술적 부채가 심각한 조직에서는 전환 일정이 여전히 장기화되고 있습니다.
부문 분석
네트워크 자동화는 2031년까지 연평균 성장률(CAGR)이 18.82%로 예측되는 가장 빠르게 성장하는 부문이지만, 2025년 시점에서는 서버 자동화가 데이터센터 자동화 시장의 51.40% 점유율을 유지하고 있습니다. 네트워크에 중점을 둔 플랫폼의 성장은 수동적인 명령줄 변경으로는 감당할 수 없을 정도로 증가하고 있는 마이크로서비스, 컨테이너 클러스터 및 이스트-웨스트 트래픽 패턴의 보급을 반영합니다. 기업들은 비즈니스 의도를 장치 설정으로 변환하고, 폐쇄 루프 텔레메트리를 통해 결과를 검증하는 컨트롤러로 전환하고 있습니다. 이러한 전환을 통해 프로그래밍 가능한 QoS, 마이크로 세분화, 그리고 다운타임 발생을 줄여주는 자동 롤백 기능이 실현됩니다.
중기적으로는 오케스트레이션 제품군을 통해, 그동안 별도로 존재하던 기능(구성 관리, 성능 분석, 규정 준수 점검)이 역할 기반 액세스 제어를 통해 관리되는 통합된 툴체인으로 통합되고 있습니다. AI를 활용한 진단 기능은 지연 원인을 파악하고 시정 조치를 제안함으로써 평균 해결 시간(MTTR)을 단축합니다. 그 결과, 경영진은 현재 네트워크 자동화를 단순한 비용 센터가 아닌 전략적 투자로 인식하고 있습니다. 2026년까지 기업의 30%가 네트워크 활동의 최소 절반을 자동화하겠다는 목표를 세우고 있으며, 의도 기반 네트워킹의 광범위한 도입을 위한 기반이 마련됨에 따라 이러한 추세는 앞으로도 지속될 것으로 예측됩니다.
2025년에는 Tier 3 시설이 데이터센터 자동화 시장 규모의 44.95%를 차지했으나, 99.995%라는 엄격한 가동률 요건으로 인해 Tier 4 도입은 연평균 성장률(CAGR) 18.02%를 기록할 전망입니다. Tier 4 캠퍼스 운영 사업자는 오케스트레이션된 장애 조치 프로세스, 실시간 건전성 평가 및 자가 복구형 메시 아키텍처에 의존하고 있습니다. 자동 진단 기능은 중복 경로와 환경 센서를 1분당 수천 번 점검하여 예방적 부품 교체 및 부하 전달을 촉발합니다.
반면, Tier 1 및 Tier 2 사이트에서는 예산 제약으로 인해 백업 일정 설정 및 패치 관리에 중점을 둔 선택적 자동화가 추구되고 있습니다. 그러나 소프트웨어 비용의 하락과 모듈식 컨트롤러 설계로 인해 진입 장벽은 점차 낮아지고 있습니다. 재해 복구 오케스트레이션은 보편적인 우선순위로 자리 잡고 있습니다. 자동화된 런북을 통해 현재는 사람의 개입 없이 매월 장애 전환 시퀀싱 테스트가 수행되어, 감사 요건을 충족하면서 수익을 보호하고 있습니다. 이러한 기능 덕분에 티어 수준 간의 운영 격차는 점차 줄어들고 있으며, 업계 전반의 기준이 되는 기대치가 높아지고 있습니다.
지역별 분석
북미는 클라우드의 광범위한 도입과 풍부한 자금원 확보를 바탕으로 2025년에도 데이터센터 자동화 시장 점유율의 46.05%를 유지했습니다. 버지니아주 북부 등 주요 회랑 지역의 전력 제약으로 인해, 이용 가능한 메가와트를 최대한 활용하는 그리드 연계형 자동화에 대한 관심이 높아지고 있습니다. 2028년까지 데이터센터의 전력 수요가 2배로 증가할 가능성이 있다는 연방 정부의 조사 결과에 따라, 유휴 시 전력 소비를 최소화하고 수요 반응 프로그램을 통해 유연성을 수익으로 전환하는 플랫폼에 대한 관심이 더욱 높아지고 있습니다. 기업의 지속가능성 관련 노력 또한 AI를 활용한 냉각 및 용량 계획 도구의 적극적인 도입을 더욱 촉진하고 있습니다.
아시아태평양은 가장 빠르게 성장하는 지역으로, 2026년부터 2031년까지 연평균 성장률(CAGR) 19.05%가 예상됩니다. 중국, 일본, 인도에서 진행 중인 국가 주도의 이니셔티브는 현지 클라우드 존 및 엣지 인프라 확충을 촉진하고 있으며, 인력 부족을 보완할 수 있는 자동화에 대한 수요를 높이고 있습니다. 태국과 인도네시아에서 진행 중인 수십억 달러 규모의 투자를 포함한 대규모 프로젝트에서는 액체 냉각과 재생에너지원이 결합되어 있어, 도입 초기부터 서로 다른 기술을 조화시킬 수 있는 오케스트레이션 계층이 요구되고 있습니다.
유럽에서는 성숙한 코로케이션 허브와 엄격한 환경 규제가 맞물려, 첨단 지속가능성 자동화의 시금석이 되고 있습니다. 2030년까지 기후 중립 시설을 실현하겠다는 공약에 따라, 사업자들은 PUE를 1.3 미만으로 유지하고 재생에너지 사용 현황을 검증하는 지속적인 최적화 엔진을 도입해야 하는 압박을 받고 있습니다. 수요 반응(Demand Response) 참여 및 열 재이용 제도에 대한 인센티브가 비즈니스 사례를 더욱 견고하게 만들고 있습니다. 중동 및 아프리카에서의 활동 활성화도 이러한 추세를 반영하고 있습니다. 사우디아라비아, 아랍에미리트, 남아프리카공화국의 플래그십 프로젝트에서는 넷 제로(Net Zero) 입증과 외딴 지역의 인력 배치 제약을 극복하기 위한 자율 운영이 요구되고 있으며, 자동화는 자금 조달 및 임차인 확보의 전제조건으로 자리 잡고 있습니다.
기타 혜택:
- 엑셀 형식 시장 예측(ME) 시트
- 3개월간의 애널리스트 지원
자주 묻는 질문
목차
제1장 서론
제2장 조사 방법
제3장 주요 요약
제4장 시장 구도
제5장 시장 규모와 성장 예측
제6장 경쟁 구도
제7장 시장 기회와 향후 전망
LSH 26.09.09According to Mordor Intelligence, the data center automation market size in 2026 is estimated at USD 12.32 billion, growing from 2025 value of USD 10.48 billion with 2031 projections showing USD 27.64 billion, growing at 17.54% CAGR over 2026-2031.
This report is Segmented by Solution (Server Automation, Network Automation, and More), by Data Center Tier Type (Tier 1 and 2, Tier 3, and Tier 4), by Deployment Mode (On-Premise, Cloud), by Data Center Type (Hyperscalers/Cloud Service Providers, Colocation Providers, and More), and by Geography. The Market Forecasts are Provided in Terms of Value (USD).
Global Data Center Automation Market Trends and Insights
Surge in cloud and hyperscale build-outs
Hyperscale campuses scheduled for 2025 investment exceed USD 250 billion, creating an automation imperative that spans capacity planning, thermal management, and live migration of workloads. Operators are designing facilities around AI-driven controllers able to allocate compute, power, and cooling resources in seconds, matching service-level demands while shaving operator intervention to a minimum. Capital-intensive expansions are now coupled with modular blocks that ship pre-wired and pre-tested, so orchestration software must instantly discover, baseline, and integrate each block. Global vendors are responding with intent-based platforms that enforce policies across thousands of assets, turning build-out velocity into a competitive weapon.
Demand for energy-efficient and sustainable operations
Datacenters currently use 1-3% of global electricity, and projections suggest the share could rise to 5% by 2030 if AI uptake accelerates. Strict initiatives such as the Climate Neutral Data Centre Pact in Europe set a PUE ceiling of 1.3 for new builds, prompting operators to adopt automation that continually tunes airflows, fan speeds, and workload placements. AI-enhanced controls have already trimmed cooling power by up to 40% in early deployments, and operators showcasing verifiable carbon reductions are attracting hyperscale tenants that must hit their own ESG targets. Automated sustainability reporting is further lowering compliance overheads and improving transparency with regulators.
Legacy system interoperability hurdles
Many operators still run proprietary hardware with limited APIs, forcing costly custom connectors before modern orchestration can take hold. Network teams often hesitate to automate core switches that handle mission-critical traffic, fearing outages from mis-configured scripts. Lack of design standardization across legacy estates further complicates rollouts because templates built for one site rarely port cleanly to another. Vendors are responding with extensive plugin marketplaces and AI-based discovery tools that reverse-engineer device configurations, yet migration timelines remain protracted for organizations with deep technical debt
Other drivers and restraints analyzed in the detailed report include:
- Rising AI/ML workload automation needs
- Complexity of hybrid and multi-cloud architectures
- Heightened cyber-security and compliance risks
For complete list of drivers and restraints, kindly check the Table Of Contents.
Segment Analysis
Network Automation is the fastest-growing segment with a 18.82% CAGR projected through 2031, although Server Automation retained 51.40% of the data center automation market share in 2025. Growth in network-focused platforms mirrors the proliferation of micro-services, container clusters, and east-west traffic patterns that overwhelm manual command-line changes. Enterprises are shifting to controllers that translate business intent into device configurations, then verify outcomes through closed-loop telemetry. This shift unlocks programmable QoS, micro-segmentation, and automatic rollback capabilities that reduce downtime incidents.
In the medium term, orchestration suites are converging previously separate functions- configuration management, performance analytics, and compliance checks- into unified toolchains governed by role-based access. AI-powered diagnostics pinpoint latency roots and suggest remediations, shortening mean time to resolution. As a result, senior leadership now views network automation as a strategic investment rather than a cost center. Momentum is expected to continue as 30% of enterprises aim to automate at least half of their network activities by 2026, setting the foundation for widespread intent-based networking adoption.
Tier 3 facilities commanded 44.95% of the data center automation market size in 2025, but Tier 4 deployments are on track for an 18.02% CAGR thanks to stringent 99.995% uptime expectations. Operators of Tier 4 campuses rely on orchestrated failover processes, real-time health scoring, and self-healing mesh architectures. Automated diagnostics inspect redundant paths and environmental sensors thousands of times per minute, triggering pre-emptive part swaps or load transfers.
Conversely, Tier 1 and Tier 2 sites pursue selective automation, often focusing on backup scheduling and patch management, due to budget limits. Yet falling software costs and modular controller designs are lowering entry barriers. Disaster-recovery orchestration is becoming a universal priority: Automated runbooks now test failover sequences monthly without human intervention, fulfilling audit requirements while safeguarding revenue. These capabilities gradually narrow the operational disparities between tier levels and raise baseline expectations across the industry.
Complete Report Scope:
- By Solution
- Server Automation
- Network Automation
- Storage/Database Automation
- Orchestration and Configuration Mgmt.
- Performance and Compliance Mgmt.
- By Data Center Tier Type
- Tier 1 and 2
- Tier 3
- Tier 4
- By Deployment Mode
- On-premise
- Cloud
- By Data Center Type
- Hyperscalers/Cloud Server Providers
- Colocation Providers
- Enterprise and Edge
- By Geography
- North America
- United States
- Canada
- Mexico
- Europe
- United Kingdom
- Germany
- France
- Italy
- Spain
- Rest of Europe
- Asia-Pacific
- China
- Japan
- India
- Singapore
- Australia
- Malaysia
- Rest of Asia-Pacific
- South America
- Brazil
- Chile
- Argentina
- Rest of South America
- Middle East
- United Arab Emirate
- Saudi Arabia
- Turkey
- Rest of Middle East
- Africa
- South Africa
- Nigeria
- Rest of Africa
- North America
Geography Analysis
North America retained 46.05% of the data center automation market share in 2025, benefiting from deep cloud adoption and access to large capital pools. Power constraints in core corridors such as Northern Virginia sharpen the focus on grid-interactive automation that maximizes every available megawatt. Federal research indicating that data-center electricity demand may double by 2028 magnifies interest in platforms that minimize idle consumption and monetize flexibility through demand-response programs. Corporate sustainability narratives further encourage aggressive deployment of AI-guided cooling and capacity-planning tools.
Asia-Pacific is the fastest-growing territory with a 19.05% CAGR expected between 2026-2031. National initiatives in China, Japan, and India incentivize local cloud zones and edge build-outs, magnifying the need for automation that can compensate for labor shortages. Large-scale projects, including multi-billion-dollar investments in Thailand and Indonesia, bundle liquid-cooling and renewable power sources, demanding orchestration layers able to harmonize disparate technologies from day one.
Europe combines mature colocation hubs with tight environmental regulation, creating a crucible for advanced sustainability automation. Commitments to achieve climate-neutral facilities by 2030 push operators to deploy continuous-optimization engines that maintain sub-1.3 PUE targets and verify renewable-energy usage. Incentives for demand-response participation and heat-re-use schemes reinforce the business case. Growing activity in the Middle East and Africa mirrors this momentum: flagship projects in Saudi Arabia, the United Arab Emirates, and South Africa require net-zero proof points and autonomous operation to overcome remote-site staffing limitations, positioning automation as a prerequisite for securing financing and tenants.
- Cisco Systems Inc.
- VMware Inc.
- Microsoft Corporation
- IBM Corporation
- Hewlett Packard Enterprise (HPE)
- Dell Technologies Inc.
- BMC Software Inc.
- ServiceNow Inc.
- Oracle Corporation
- Fujitsu Ltd.
- Juniper Networks Inc.
- ABB Ltd.
- Citrix Systems Inc.
- Chef Software Inc. (Progress Software)
- Brocade Communications Systems
- HashiCorp Inc.
- Puppet Labs LLC
- Micro Focus Intl. plc
- Huawei Technologies Co. Ltd.
- Schneider Electric SE
- NetApp Inc.
Additional Benefits:
- The market estimate (ME) sheet in Excel format
- 3 months of analyst support
TABLE OF CONTENTS
1 INTRODUCTION
- 1.1 Study Assumptions and Market Definition
- 1.2 Scope of the Study
2 RESEARCH METHODOLOGY
3 EXECUTIVE SUMMARY
4 MARKET LANDSCAPE
- 4.1 Market Overview
- 4.2 Market Drivers
- 4.2.1 Surge in cloud and hyperscale build-outs
- 4.2.2 Demand for energy-efficient and sustainable operations
- 4.2.3 Rising AI/ML workload automation needs
- 4.2.4 Complexity of hybrid and multi-cloud architectures
- 4.2.5 Grid-interactive incentive programs for data centers
- 4.2.6 Edge localization in emerging economies
- 4.3 Market Restraints
- 4.3.1 Legacy system interoperability hurdles
- 4.3.2 Heightened cyber-security and compliance risks
- 4.3.3 NetOps/automation talent shortage
- 4.3.4 Power and water scarcity in major hubs
- 4.4 Supply-Chain Analysis
- 4.5 Regulatory Landscape
- 4.6 Technological Outlook
- 4.7 Porter's Five Forces Analysis
- 4.7.1 Bargaining Power of Suppliers
- 4.7.2 Bargaining Power of Buyers
- 4.7.3 Threat of New Entrants
- 4.7.4 Threat of Substitutes
- 4.7.5 Intensity of Competitive Rivalry
- 4.8 Assessment of Macro-economic Trends on the Market
- 4.9 Sustainability and Carbon-Neutral Initiatives
- 4.10 Capacity and Power-Demand Analysis
5 MARKET SIZE AND GROWTH FORECASTS (VALUES)
- 5.1 By Solution
- 5.1.1 Server Automation
- 5.1.2 Network Automation
- 5.1.3 Storage/Database Automation
- 5.1.4 Orchestration and Configuration Mgmt.
- 5.1.5 Performance and Compliance Mgmt.
- 5.2 By Data Center Tier Type
- 5.2.1 Tier 1 and 2
- 5.2.2 Tier 3
- 5.2.3 Tier 4
- 5.3 By Deployment Mode
- 5.3.1 On-premise
- 5.3.2 Cloud
- 5.4 By Data Center Type
- 5.4.1 Hyperscalers/Cloud Server Providers
- 5.4.2 Colocation Providers
- 5.4.3 Enterprise and Edge
- 5.5 By Geography
- 5.5.1 North America
- 5.5.1.1 United States
- 5.5.1.2 Canada
- 5.5.1.3 Mexico
- 5.5.2 Europe
- 5.5.2.1 United Kingdom
- 5.5.2.2 Germany
- 5.5.2.3 France
- 5.5.2.4 Italy
- 5.5.2.5 Spain
- 5.5.2.6 Rest of Europe
- 5.5.3 Asia-Pacific
- 5.5.3.1 China
- 5.5.3.2 Japan
- 5.5.3.3 India
- 5.5.3.4 Singapore
- 5.5.3.5 Australia
- 5.5.3.6 Malaysia
- 5.5.3.7 Rest of Asia-Pacific
- 5.5.4 South America
- 5.5.4.1 Brazil
- 5.5.4.2 Chile
- 5.5.4.3 Argentina
- 5.5.4.4 Rest of South America
- 5.5.5 Middle East
- 5.5.5.1 United Arab Emirate
- 5.5.5.2 Saudi Arabia
- 5.5.5.3 Turkey
- 5.5.5.4 Rest of Middle East
- 5.5.6 Africa
- 5.5.6.1 South Africa
- 5.5.6.2 Nigeria
- 5.5.6.3 Rest of Africa
- 5.5.1 North America
6 COMPETITIVE LANDSCAPE
- 6.1 Market Concentration
- 6.2 Strategic Moves
- 6.3 Market Share Analysis
- 6.4 Company Profiles (includes Global level Overview, Market level overview, Core Segments, Financials as available, Strategic Information, Market Rank/Share for key companies, Products and Services, and Recent Developments)
- 6.4.1 Cisco Systems Inc.
- 6.4.2 VMware Inc.
- 6.4.3 Microsoft Corporation
- 6.4.4 IBM Corporation
- 6.4.5 Hewlett Packard Enterprise (HPE)
- 6.4.6 Dell Technologies Inc.
- 6.4.7 BMC Software Inc.
- 6.4.8 ServiceNow Inc.
- 6.4.9 Oracle Corporation
- 6.4.10 Fujitsu Ltd.
- 6.4.11 Juniper Networks Inc.
- 6.4.12 ABB Ltd.
- 6.4.13 Citrix Systems Inc.
- 6.4.14 Chef Software Inc. (Progress Software)
- 6.4.15 Brocade Communications Systems
- 6.4.16 HashiCorp Inc.
- 6.4.17 Puppet Labs LLC
- 6.4.18 Micro Focus Intl. plc
- 6.4.19 Huawei Technologies Co. Ltd.
- 6.4.20 Schneider Electric SE
- 6.4.21 NetApp Inc.
7 MARKET OPPORTUNITIES AND FUTURE OUTLOOK
- 7.1 White-space and Unmet-need Assessment


