

|
시장보고서
상품코드
2121838
케이블 관리 : 시장 점유율 분석, 업계 동향과 통계, 성장 예측(2026-2031년)Cable Management - Market Share Analysis, Industry Trends & Statistics, Growth Forecasts (2026 - 2031) |
||||||
 Mordor Intelligence
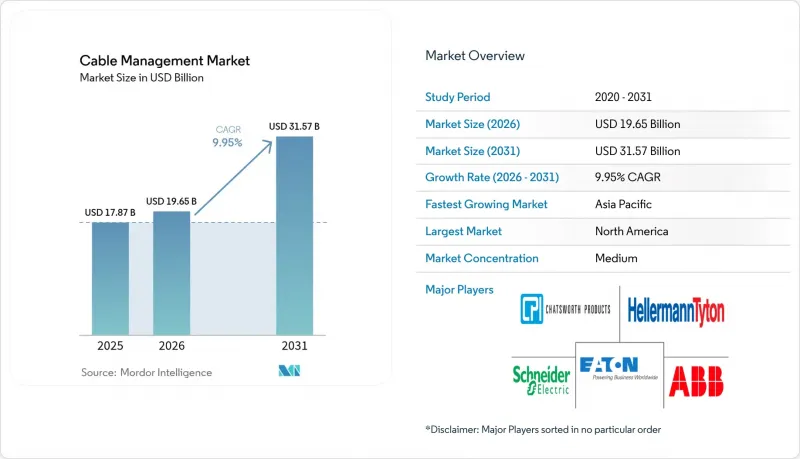
Mordor Intelligence에 의하면, 케이블 관리 시장 규모는 2025년 178억 7,000만 달러에서 2026년에는 196억 5,000만 달러에 이르고, 2026-2031년 CAGR 9.95%로 성장을 지속하여 2031년에는 315억 7,000만 달러에 달할 것으로 예측됩니다.
본 보고서는 제품 유형별(케이블 트레이, 케이블 레이스웨이 등), 최종 사용자 산업별(IT 및 통신, 건설, 에너지·유틸리티, 제조, 상업, 의료시설), 재질별(금속 및 비금속), 설치 경로별(머리 위·천장, 바닥 아래 등), 그리고 지역별로 분류되어 있습니다. 시장 예측은 금액(달러) 기준으로 제시되어 있습니다.
세계 케이블 관리 시장 동향 및 인사이트
하이퍼스케일 데이터센터의 급증
하이퍼스케일화의 확대는 케이블 관리 시장에 있어 가장 강력한 단일 촉진요인이 되고 있습니다. NVIDIA DGX SuperPOD 도입에서는 제한된 설치 공간 내에 400G 및 800G 광섬유 링크와 더불어 액체 냉각용 호스를 수용하는 케이블 경로가 지정되어 있어, 엔터프라이즈 시설에 비해 랙당 트레이 및 커넥터의 양이 2배로 늘어났습니다. AFL사의 수직형 케이블 매니저 설계 덕분에 사용 가능한 랙 공간이 40% 증가하고 기류 손실이 감소하여, 랙당 70kW를 초과하는 전력 밀도를 지원할 수 있게 되었습니다. GPU 클러스터의 경우 랙당 배선용 하드웨어가 3배 더 필요할 것으로 예상되어, 프로젝트 관리자는 공사 시작일 16주 전에 부품을 사전 주문해야 하는 상황에 몰려 있습니다. 전용 커넥터공급이 부족하여 프로젝트 리드타임이 길어짐에 따라, 현장에서의 종단 처리를 줄여주는 모듈형 키트의 가치가 높아지고 있습니다. 가동 중지 시간을 방지하기 위한 예측 유지보수를 요구하는 운영자가 늘어나면서, 트레이에 RFID 태그와 온도 센서를 탑재한 공급업체 시장 점유율이 확대되고 있습니다.
재생 에너지 건설 확대
유틸리티 규모의 태양광 발전소나 육상 풍력 발전소에서는 케이블 관리 시스템에 대해 독자적인 환경 요건 및 내구성 요건이 부과됩니다. 미국 에너지부는 25년의 내구 연한 기준을 정하고 있으며, 자외선에 내성이 있는 폴리머, 열팽창 조인트, 내식성 패스너를 권장하고 있습니다. 팬듀이트(Panduit)사는 -40°C에서 +90°C까지의 내열 온도 범위를 가진 케이블 타이를 제공하여, 사막 지대의 발전소에서 연간 유지보수를 위해 차량을 파견하는 횟수를 줄이고 있습니다. CAB Solar사의 모듈식 행거는 설치 작업을 60% 줄이고 모래 유입을 사실상 차단함으로써 메가와트당 운영 및 유지보수(O&M) 비용을 절감합니다. 풍력 터빈의 경우, 타워의 지속적인 흔들림과 회전을 견디며 20년 동안 절연 성능을 유지할 수 있는 유연한 캐리어가 선호됩니다. 태양광 발전과 에너지 저장을 결합한 하이브리드 사이트에서는 안전 기준을 충족하기 위해 직류(DC) 어레이, 교류(AC) 계통 연계 및 배터리 회로를 분리해 두어야 하므로 배선 경로의 복잡성이 증가합니다.
아연 도금 강판 및 PVC의 가격 변동
2025년 초, 지역별 공급 불균형과 에너지 비용의 급등이 조달 예산에 영향을 미치면서 아연 도금 강판과 PVC의 현물 가격이 15% 변동했습니다. ADS Sheet Metal사의 예측에 따르면, 알루미늄 가격은 톤당 2,763달러 전후로 움직이고 있어 비용 예측을 더욱 복잡하게 만들고 있습니다. 케이블 관리 용품 공급업체들은 견적 유효 기간을 14일로 단축하고, 계약을 상품 벤치마크에 연동함으로써 위험을 최종 사용자에게 전가하고 있습니다. 가격 변동으로 인해 대체품에 대한 수요가 증가하고 있으며, 섬유 강화 플라스틱(FRP) 트레이에 대한 관심이 급속히 높아지고 있지만, 이를 도입하려면 더 긴 인증 절차가 수반됩니다. 일부 EPC 계약업체는 원자재에 대한 대규모 헤지를 확정하고 있지만, 소규모 설치 업체들은 수익성에 직접적인 타격을 입고 있습니다.
부문 분석
케이블 트레이는 그 폭넓은 적용성을 반영하여 2025년 케이블 관리 시장에서 35.12%의 점유율을 유지한 반면, 케이블 커넥터 및 접지 장비는 2031년까지 연평균 성장률(CAGR) 10.52%를 나타낼 것으로 예측됩니다. 하이퍼스케일 데이터센터 및 재생에너지용 인버터의 랙 밀도 향상으로 인해, 고전류 용량의 러그, 스트레인 릴리프 그라운드, 그리고 전력 회로와 광섬유 회로를 분리하는 다층 트레이에 대한 수요가 증가하고 있습니다. 모듈화를 통해 설치 기간이 단축되고 현장 작업 위험이 감소함에 따라, 커넥터 분야의 케이블 관리 시장 규모는 확대될 전망입니다. 정션 박스와 캐리어는 꾸준한 성장세를 보이고 있으며, 특히 다이내믹 모션 캐리어는 로봇 용접 셀에서 틈새 시장을 확보하고 있습니다. 주요 공급업체들은 RFID 태그와 자산 추적 소프트웨어를 제품에 통합하여 차별화를 꾀하는 한편, 서비스 계약을 공고히 하여 CAPEX와 OPEX를 결합한 하이브리드 수익 모델을 뒷받침하고 있습니다.
타이, 커버 및 패스너는 태양광 발전소에서 자외선에 의한 열화가 나타나는 부품을 교체하는 유지보수 주기 덕분에 증분 수익을 창출하고 있습니다. 스냅인식 채널 커버의 혁신으로 조립 시간이 단축되었으며, 색상별로 구분된 클립이 문제 해결의 효율을 높이고 있습니다. 1,500V 태양광 스트링에 적합한 대전류용 러그는 평균 판매 가격(ASP)의 프리미엄을 이끌어내며, 케이블 관리 시장의 이익률을 뒷받침하고 있습니다. 구리와 알루미늄의 가격 차이가 변동하는 가운데, 알루미늄 재질의 본체와 구리 도금 접점을 결합한 듀얼 머티리얼 러그가 설계에 도입되어, 상당한 비용 증가를 초래하지 않으면서 갈바닉 부식을 억제하고 있습니다.
2025년 시점에서 IT 및 통신 분야는 케이블 관리 시장 점유율의 28.24%를 차지했으나, 데이터센터는 2031년까지 연평균 성장률(CAGR)이 10.21%로 가장 빠르게 성장하는 최종 사용자층이 되고 있습니다. 인공지능(AI) 클러스터, 수냉식 서버 및 배터리 백업이 포함된 UPS 아키텍처로 인해 1제곱피트당 배선 경로 요구 사항이 두 배로 증가했습니다. 따라서 데이터센터용 케이블 관리 시장 규모는 하이브리드 구리선·광섬유 토폴로지를 지원하기 위해 사업자들이 더 폭이 넓은 래더와 2단 적재가 가능한 바스켓 트레이를 표준화해 나감에 따라, 매출 점유율을 확대해 나갈 것으로 예측됩니다.
모듈식 조립식 공법을 채택하는 건설 회사는 벽 패널 내에 트레이를 매립함으로써 랙 홀의 시공 기간을 며칠에서 몇 시간으로 단축하고 있습니다. 에너지 및 유틸리티 부문에서는 해상 풍력 발전소나 수소 전기분해 플랜트에서 내식성 솔루션이 요구됨에 따라 금속 트레이에 대한 수요가 유지되고 있습니다. 제조업에서는 인더스트리 4.0에 따른 생산 라인 변경에 대응하기 위해 유연한 플러그 앤 플레이 방식의 하네스가 채택되고 있는 반면, 의료시설에서는 매끄럽고 닦기 쉬운 표면이나 항균 코팅이 우선시되고 있습니다. 모든 산업 분야에서 IT와 OT의 융합을 통해 네트워크 세분화을 유지하면서 상태 모니터링을 위한 데이터 교환을 촉진하는 통합형 레이스웨이가 확산되고 있습니다.
지역별 분석
북미는 2025년, 버지니아주, 오하이오주, 앨버타주의 데이터센터 메가 캠퍼스 건설을 견인력으로 삼아 케이블 관리 시장의 39.02%를 계속 차지했습니다. 재생에너지 발전 및 송전에 대한 연방 정부의 인센티브와 송전망의 내결함성 향상을 위한 자금이 맞물려 지하 시스템 도입이 촉진되고 있습니다. 멕시코의 니어쇼어링 붐은 케이블 트레이 제조 거점 확장을 촉진하고 있으며, 데이터센터와 태양광 발전소 양쪽 수요를 충족시키는 팬듀잇(Panduit)사의 5,000만 달러 규모 공장이 그 증거입니다.
아시아태평양은 2031년까지 연평균 성장률(CAGR) 10.71%로 성장을 주도할 것입니다. 중국의 스마트 공장 추진 계획과 인도의 고전압 송전망 업그레이드는 현지 인증 요건을 충족할 수 있는 국내 공급업체를 우대하는 대규모 입찰을 뒷받침하고 있습니다. 일본과 한국은 반도체 클린룸용 소형화 된 파이버 트레이 솔루션을 혁신하고 있는 반면, 동남아시아에서는 견고한 비금속 콘ジット을 지정하는 배터리 기가팩토리에 대한 외국인 직접 투자가 유치되고 있습니다. 지역 내 조달 규정은 합작 투자를 촉진하고 있으며, ABB와 Niedax가 북미에서 추진한 트레이 합작 투자 모델이 현재 아세안 시장에서도 재현되고 있습니다.
유럽에서는 스마트 빌딩 건축 기준과 재생 에너지 목표에 따라 지출 수준이 유지되며 꾸준한 진전이 나타나고 있지만, 복잡한 CPR(건설 제품 규정) 문서 작성으로 인해 입찰 전 단계가 장기화되고 있습니다. 독일의 자동차 생산 라인 전기화에는 유연성이 높은 드래그 체인 캐리어가 요구되고 있으며, 영국 런던 주변의 데이터센터 클러스터에서는 콤팩트한 바닥 하부 솔루션에 대한 투자가 진행되고 있습니다. 동유럽의 풍력 발전 회랑은 새로운 수익원이 되고 있지만, 가격에 민감한 사양으로 인해 복합재보다 아연 도금 사다리 트레이가 선호되고 있습니다.
기타 혜택:
- 엑셀 형식 시장 예측(ME) 시트
- 3개월간의 애널리스트 지원
자주 묻는 질문
목차
제1장 서론
제2장 조사 방법
제3장 주요 요약
제4장 시장 구도
제5장 시장 규모와 성장 예측
제6장 경쟁 구도
제7장 시장 기회와 향후 전망
LSH 26.09.09According to Mordor Intelligence, the cable management market size is expected to grow from USD 17.87 billion in 2025 to USD 19.65 billion in 2026 and is forecast to reach USD 31.57 billion by 2031 at 9.95% CAGR over 2026-2031.
This report is Segmented by Product (Cable Trays, Cable Raceways, and More), End-User Industry (IT and Telecommunications, Construction, Energy and Utilities, Manufacturing, Commercial, and Healthcare Facilities), Material Type (Metallic and Non-Metallic), Installation Channel (Overhead and Ceiling, Under-Floor, and More), and Geography. The Market Forecasts are Provided in Terms of Value (USD).
Global Cable Management Market Trends and Insights
Proliferation of Hyperscale Data Centers
Hyperscale expansion represents the strongest single catalyst for the cable management market. NVIDIA DGX SuperPOD installations now specify cable pathways that house 400 G and 800 G fiber links plus liquid-coolant hoses in confined footprints, doubling the volume of trays and connectors per rack when compared with enterprise facilities. AFL's vertical cable-manager designs raise usable rack space by 40% and cut airflow losses, supporting power densities beyond 70 kW per rack. It is expected that GPU clusters require three times the routing hardware per rack, pressuring project managers to pre-order components 16 weeks ahead of build start dates. Specialized connector supply is tight, lengthening project lead times and amplifying the value of modular kits that reduce field terminations. Vendors incorporating RFID tags and thermal sensors into trays gain share as operators seek predictive maintenance to avoid downtime.
Accelerated Renewable-Energy Build-Outs
Utility-scale solar and onshore wind sites impose unique environmental and longevity requirements on cable management systems. The U.S. Department of Energy outlines 25-year service-life standards that reward UV-stable polymers, thermal-expansion joints, and corrosion-proof fasteners. Panduit delivers cable ties rated from -40 °C to +90 °C, limiting annual maintenance truck rolls across desert plants. CAB Solar's modular hangers reduce install labor by 60% and virtually eliminate sand ingress, lowering O&M cost per megawatt. Wind-turbine applications favor flexible carriers that tolerate continual tower sway and rotation, maintaining insulation integrity for 20 years. Hybrid solar-plus-storage sites add routing complexity because DC arrays, AC grid interconnects, and battery circuits must remain segregated to satisfy safety codes.
Volatile Prices of Galvanized Steel and PVC
Spot prices for galvanized steel and PVC swung 15% in early 2025 as regional supply imbalances and energy-cost spikes hit procurement budgets. ADS Sheet Metal's forecasts show aluminum hovering near USD 2,763 per ton, further complicating cost assumptions. Cable management suppliers shorten quote validity to 14 days and index contracts to commodity benchmarks, shifting risk to end users. Volatility encourages substitution: fiber-reinforced plastic trays see accelerated interest, yet their adoption is tethered to longer qualification cycles. Some EPC contractors lock in bulk raw-material hedges, but smaller installers absorb direct hits to profitability.
Other drivers and restraints analyzed in the detailed report include:
- Smart-Building Mandates in OECD Economies
- Electrification of Industrial Processes
- Lengthy Certification Cycles for Flame-Retardant Plastics
For complete list of drivers and restraints, kindly check the Table Of Contents.
Segment Analysis
Cable trays retained a 35.12% share of the cable management market in 2025, reflecting their broad applicability, while cable connectors and glands are projected to grow at a 10.52% CAGR through 2031. Elevated rack densities in hyperscale data centers and renewable inverters amplify demand for high-ampacity lugs, strain-relief glands, and multi-tier trays that separate power and fiber circuits. The cable management market size for connectors is set to widen as modularity shortens installation windows and limits site labor exposure. Junction boxes and carriers post steady gains, with dynamic-motion carriers finding niche uptake in robotic welding cells. Premium vendors add RFID tagging and asset-tracking software to differentiate offerings and lock in service contracts, supporting hybrid CAPEX-plus-OPEX revenue models.
Ties, covers, and fasteners accumulate incremental revenue thanks to maintenance cycles that replace UV-aged components in solar farms. Innovations in snap-in channel covers reduce assembly time, and color-coded clips boost troubleshooting efficiency. High-current lugs suited for 1,500 V solar strings command ASP premiums, buttressing margins within the cable management market. As copper and aluminum price spreads fluctuate, dual-material lugs enter designs, combining aluminum bodies with copper-plated contacts to manage galvanic corrosion without heavy cost penalties.
IT and telecommunications held 28.24% of the cable management market share in 2025, yet data centers represent the fastest-growing end-user at 10.21% CAGR through 2031. Artificial-intelligence clusters, liquid-cooled servers, and battery-backed UPS architectures multiply pathway requirements per square foot. The cable management market size for data centers is therefore expected to capture a rising revenue slice as operators standardize on wider rung ladders and double-stacked basket trays to accommodate hybrid copper-fiber topologies.
Construction firms adopting modular prefabrication embed trays within wall panels, enabling hours-rather-than-days rack hall builds. Energy and utilities sectors push for corrosion-resistant solutions in offshore wind substations and hydrogen electrolyzer plants, sustaining metallic-tray demand. Manufacturing embraces flexible plug-and-play harnesses to support Industry 4.0 line changes, while healthcare facilities prioritize smooth, wipe-down surfaces and antimicrobial coatings. Across sectors, IT-OT convergence drives integrated raceways that preserve network segmentation yet promote data exchange for condition monitoring.
Complete Report Scope:
- By Product
- Cable Trays
- Cable Raceways
- Cable Conduits
- Cable Connectors and Glands
- Cable Carriers
- Cable Lugs
- Junction / Distribution Boxes
- Ties, Covers, Fasteners, Clips
- By End-user Industry
- IT and Telecommunications
- Construction
- Energy and Utilities
- Manufacturing
- Commercial
- Healthcare Facilities
- By Material Type
- Metallic (Steel, Aluminum)
- Non-metallic (PVC, HDPE, FRP)
- By Installation Channel
- Overhead and Ceiling
- Under-floor
- Wall-mounted
- Underground / Buried
- By Geography
- North America
- United States
- Canada
- South America
- Brazil
- Argentina
- Rest of South America
- Europe
- Germany
- United Kingdom
- France
- Russia
- Rest of Europe
- Asia Pacific
- China
- Japan
- India
- South Korea
- Rest of Asia Pacific
- Middle East and Africa
- Middle East
- Saudi Arabia
- United Arab Emirates
- Rest of Middle East
- Africa
- South Africa
- Nigeria
- Rest of Africa
- Middle East
- North America
Geography Analysis
North America retained 39.02% of the cable management market in 2025, anchored by data-center megacampus construction across Virginia, Ohio, and Alberta. Federal incentives for renewable generation and transmission, together with grid-resilience funds, lift underground-system uptake. Mexico's near-shoring boom stimulates cable-tray manufacturing footprints, evidenced by Panduit's USD 50 million plant that serves both data-center and solar-farm demand.
Asia Pacific leads growth at an 10.71% CAGR through 2031. China's smart-factory programs and India's high-voltage transmission upgrades fuel large tenders favoring domestic suppliers equipped to navigate local certification. Japan and South Korea innovate miniaturized fiber-tray solutions for semiconductor cleanrooms, while Southeast Asia attracts foreign direct investment into battery gigafactories that specify heavy-duty non-metallic conduits. Regional content rules encourage joint ventures, such as ABB-Niedax's North American tray JV blueprint now replicated in ASEAN markets.
Europe progresses steadily as smart-building codes and renewable-energy targets hold spending levels, though complex CPR documentation extends pre-bid phases. Germany's automotive-line electrification demands flexible drag-chain carriers, and the U.K.'s London-edge data-center cluster invests in compact under-floor solutions. Eastern European wind corridors present new revenue pools, albeit with price-sensitive specifications that favor galvanized ladder trays over composites.
- ABB Ltd.
- Schneider Electric SE
- Eaton Corporation plc
- Legrand SA
- Prysmian S.p.A.
- Panduit Corp.
- HellermannTyton Group PLC
- Atkore Inc.
- Hubbell Incorporated
- TE Connectivity Ltd.
- Chatsworth Products, Inc.
- Enduro Composites, Inc.
- Leviton Manufacturing Co., Inc.
- OBO Bettermann Holding GmbH and Co. KG
- Niedax Group
- Oglaend System Group AS
- Thomas and Betts Corporation
- CableOrganizer.com LLC
- Marco Cable Management Ltd.
- Unitrunk Ltd.
- Elastimold (ABB Installation Products Inc.)
- Cembre S.p.A.
Additional Benefits:
- The market estimate (ME) sheet in Excel format
- 3 months of analyst support
TABLE OF CONTENTS
1 INTRODUCTION
- 1.1 Study Assumptions and Market Definition
- 1.2 Scope of the Study
2 RESEARCH METHODOLOGY
3 EXECUTIVE SUMMARY
4 MARKET LANDSCAPE
- 4.1 Market Overview
- 4.2 Market Drivers
- 4.2.1 Accelerated renewable-energy build-outs
- 4.2.2 Proliferation of hyperscale data centers
- 4.2.3 Smart-building mandates in OECD economies
- 4.2.4 Electrification of industrial processes
- 4.2.5 Modular off-site construction methods
- 4.2.6 800 V EV-charging infrastructure rollout
- 4.3 Market Restraints
- 4.3.1 Volatile prices of galvanized steel and PVC
- 4.3.2 Lengthy certification cycles for flame-retardant plastics
- 4.3.3 Growing adoption of wireless/PoE solutions
- 4.3.4 Miniaturization reducing copper cable volumes
- 4.4 Industry Value Chain Analysis
- 4.5 Regulatory Landscape
- 4.6 Technological Outlook
- 4.7 Porter's Five Forces Analysis
- 4.7.1 Bargaining Power of Suppliers
- 4.7.2 Bargaining Power of Buyers
- 4.7.3 Threat of New Entrants
- 4.7.4 Threat of Substitutes
- 4.7.5 Competitive Rivalry
5 MARKET SIZE AND GROWTH FORECASTS (VALUE)
- 5.1 By Product
- 5.1.1 Cable Trays
- 5.1.2 Cable Raceways
- 5.1.3 Cable Conduits
- 5.1.4 Cable Connectors and Glands
- 5.1.5 Cable Carriers
- 5.1.6 Cable Lugs
- 5.1.7 Junction / Distribution Boxes
- 5.1.8 Ties, Covers, Fasteners, Clips
- 5.2 By End-user Industry
- 5.2.1 IT and Telecommunications
- 5.2.2 Construction
- 5.2.3 Energy and Utilities
- 5.2.4 Manufacturing
- 5.2.5 Commercial
- 5.2.6 Healthcare Facilities
- 5.3 By Material Type
- 5.3.1 Metallic (Steel, Aluminum)
- 5.3.2 Non-metallic (PVC, HDPE, FRP)
- 5.4 By Installation Channel
- 5.4.1 Overhead and Ceiling
- 5.4.2 Under-floor
- 5.4.3 Wall-mounted
- 5.4.4 Underground / Buried
- 5.5 By Geography
- 5.5.1 North America
- 5.5.1.1 United States
- 5.5.1.2 Canada
- 5.5.2 South America
- 5.5.2.1 Brazil
- 5.5.2.2 Argentina
- 5.5.2.3 Rest of South America
- 5.5.3 Europe
- 5.5.3.1 Germany
- 5.5.3.2 United Kingdom
- 5.5.3.3 France
- 5.5.3.4 Russia
- 5.5.3.5 Rest of Europe
- 5.5.4 Asia Pacific
- 5.5.4.1 China
- 5.5.4.2 Japan
- 5.5.4.3 India
- 5.5.4.4 South Korea
- 5.5.4.5 Rest of Asia Pacific
- 5.5.5 Middle East and Africa
- 5.5.5.1 Middle East
- 5.5.5.1.1 Saudi Arabia
- 5.5.5.1.2 United Arab Emirates
- 5.5.5.1.3 Rest of Middle East
- 5.5.5.2 Africa
- 5.5.5.2.1 South Africa
- 5.5.5.2.2 Nigeria
- 5.5.5.2.3 Rest of Africa
- 5.5.5.1 Middle East
- 5.5.1 North America
6 COMPETITIVE LANDSCAPE
- 6.1 Market Concentration
- 6.2 Strategic Moves
- 6.3 Market Share Analysis
- 6.4 Company Profiles (includes Global-level Overview, Market-level Overview, Core Segments, Financials, Strategic Information, Market Rank/Share, Products and Services, Recent Developments)
- 6.4.1 ABB Ltd.
- 6.4.2 Schneider Electric SE
- 6.4.3 Eaton Corporation plc
- 6.4.4 Legrand SA
- 6.4.5 Prysmian S.p.A.
- 6.4.6 Panduit Corp.
- 6.4.7 HellermannTyton Group PLC
- 6.4.8 Atkore Inc.
- 6.4.9 Hubbell Incorporated
- 6.4.10 TE Connectivity Ltd.
- 6.4.11 Chatsworth Products, Inc.
- 6.4.12 Enduro Composites, Inc.
- 6.4.13 Leviton Manufacturing Co., Inc.
- 6.4.14 OBO Bettermann Holding GmbH and Co. KG
- 6.4.15 Niedax Group
- 6.4.16 Oglaend System Group AS
- 6.4.17 Thomas and Betts Corporation
- 6.4.18 CableOrganizer.com LLC
- 6.4.19 Marco Cable Management Ltd.
- 6.4.20 Unitrunk Ltd.
- 6.4.21 Elastimold (ABB Installation Products Inc.)
- 6.4.22 Cembre S.p.A.
7 MARKET OPPORTUNITIES AND FUTURE OUTLOOK
- 7.1 White-space and Unmet-Need Assessment


