

|
시장보고서
상품코드
2121864
광학 이미징 : 시장 점유율 분석, 업계 동향과 통계, 성장 예측(2026-2031년)Optical Imaging - Market Share Analysis, Industry Trends & Statistics, Growth Forecasts (2026 - 2031) |
||||||
 Mordor Intelligence
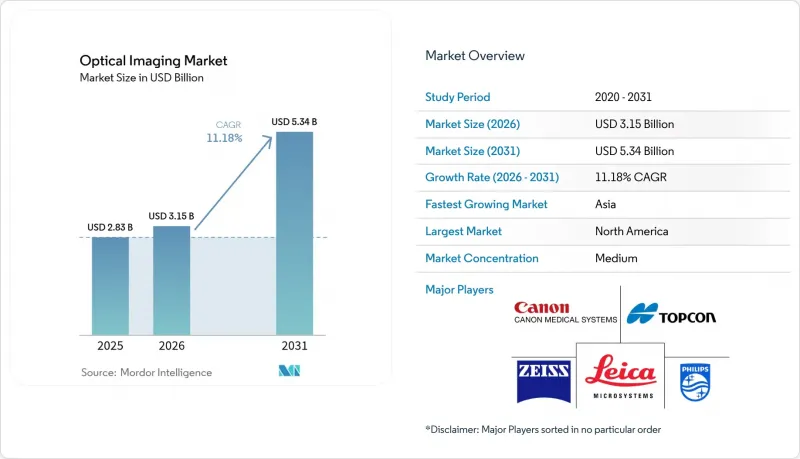
Mordor Intelligence에 의하면, 광학 이미징 시장 규모는 2025년 28억 3,000만 달러에서 2026년에는 31억 5,000만 달러에 이르고, 2026-2031년 CAGR 11.18%로 성장을 지속하여 2031년에는 53억 4,000만 달러에 달할 것으로 예측됩니다.
본 보고서는 제품별(이미징 시스템, 카메라, 조명 시스템, 렌즈, 소프트웨어), 용도별(안과, 치과, 피부과, 순환기과, 신경과, 종양과),기술(OCT, NIRS, 초분광 영상, 광음향 단층 촬영법), 최종 사용자(병원, 진단센터, 연구 기관), 지역별로 분류되어 있습니다. 시장 전망은 금액(달러) 기준으로 제시되어 있습니다.
세계 광학 이미징 시장 동향 및 인사이트
외래수술센터(ASC)에서의 수술 중 광학 이미징 시스템 도입 가속화
2024년, 미국의 외래수술센터(ASC)에서는 2,300만 건 이상의 수술이 이루어졌으며, 보험사들의 수술 외래 전환이 진행됨에 따라 전년 대비 15% 증가했습니다. UCLA Health의 ‘Dynamic Optical Contrast Imaging’ 장치를 대표로 하는 소형 수술 중 광학 플랫폼은 종양의 경계를 실시간으로 시각화하고 수술 시간을 20% 단축함으로써 ASC의 처리 능력을 향상시키기 때문에 주목을 받고 있습니다. 이러한 시스템에 대한 설비 투자는 병원 수술에 비해 35-50%의 비용 절감이 가능하다는 점과 보험사의 외래 치료 경로에 대한 지원이 확대되고 있다는 점에서 정당화되고 있습니다. 보험 지급 제도의 변화에 따라 2030년까지 전체 수술에서 ASC가 차지하는 비율은 68%를 나타낼 것으로 예측되며, 이에 따라 휴대 가능하고 네트워크 연결이 가능한 광학 장치에 대한 수요가 증가하여 광학 이미징 시장의 기반이 확대될 것입니다.
미국 및 일본에서의 OCT 유도 PCI 보험 적용 범위 확대
OCCUPI 연구에 따르면, OCT 유도 하 PCI의 1년 후 복합 사건 발생률은 4.9%였던 반면, 혈관조영술 단독의 경우 9.5%였던 것으로 보고되었습니다. 이를 계기로 미국에서는 환급률이 12% 인상되었고, 일본에서는 적용 범위가 확대되는 정책 변화가 촉진되었습니다. 의료 제공업체는 재시술률이 22% 감소하는 이점을 얻게 되어, 이를 통해 1회당 시술 비용 상승을 상쇄하고 고위험 관상동맥 병변에서의 도입을 촉진하고 있습니다. 관상동맥 중재술에서 OCT의 이용률은 2024년 15%에서 2028년까지 약 35%로 상승할 것으로 예측되며, 광학 영상 기술은 중재 심장학의 워크플로우에 더욱 깊이 정착할 전망입니다.
벤치탑형에서 통합형 수술실 영상 스위트로의 전환에는 막대한 설비 투자가 필요
OCT, 형광, 내비게이션을 통합한 완전 일체형 광학 시스템은 수술실 1실당 150만-250만 달러의 비용이 소요되며, 이는 벤치탑형 설비의 3-4배에 달하는 비용으로, 인프라에 대한 대대적인 배선 공사도 필요합니다. 또한 병원 측은 서비스 계약 및 전문의 연수 비용으로 5년간 15-20%의 추가 소유 비용을 부담하게 됩니다. 그 결과, 2024년 기준에서 완전한 통합을 완료한 대상 병원은 불과 23%에 그쳤으며, 많은 병원이 업그레이드를 연기하거나 여러 예산 주기에 걸쳐 모듈을 단계적으로 도입하고 있습니다. 신흥국에서는 제약이 더욱 심해, 명확한 임상적 이점이 있음에도 불구하고 보급 속도는 둔화되고 있습니다.
부문 분석
이미징 시스템은 안과, 순환기과 및 검사 현장에서 널리 사용되는 턴키형 콘솔의 강점을 활용하여 2025년에는 매출의 36.45%를 차지했습니다. 각 벤더들이 콘솔에 AI 소프트웨어와 다중 모드 애드온 기능을 추가해 나감에 따라, 이 부문의 광학 이미징 시장 규모는 꾸준히 확대될 것으로 예측됩니다. 최소 침습 수술에서 실시간 안내에 대한 수요가 증가함에 따라 병원의 투자가 계속 뒷받침되고 있지만, 한편 조달 부서는 검출기 비용을 상승시키는 반도체 부족으로 어려움을 겪고 있습니다. 한편, 고속 카메라는 성능의 한계를 재정의하고 있습니다. Phantom High-Speed사의 S710 카메라는 홀로그래픽 망막 혈류 이미징에서 4,000 fps를 달성하여, 혈관 진단을 향상시키는 정밀한 도플러 계산을 가능하게 하고 있습니다. 이러한 기술적 도약에 힘입어 2031년까지의 연평균 성장률(CAGR)은 12.1%로 예측되며, 이는 제품군 중 가장 높은 성장률입니다.
협대역 LED 및 슈퍼 컨티뉴엄 레이저를 채택한 차세대 조명 엔진은 외과의들이 조직 특이적인 콘트라스트를 추구하는 가운데, 조명 시스템 분야에 대한 관심을 유지하고 있습니다. 한때는 주변적인 존재에 불과했던 소프트웨어 솔루션도, AI 알고리즘을 통한 자동 분할, 혈관 정량화, 이상 징후 표시가 가능해짐에 따라 현재는 차별화의 핵심 요소가 되었습니다. 렌즈는 여전히 필수적이며, 비구면 및 구배 굴절률 광학 시스템의 발전으로 침투 깊이가 향상되고 색수차가 감소하며, 이미지의 선명도가 높아지고 있습니다. 칩 부족을 완화하기 위해 TDK의 ‘스핀 포토디텍터’는 자기 소자를 활용하여 초고속으로 빛을 감지함으로써, 기존 반도체의 병목 현상을 피하고 부품 공급망을 안정화할 수 있는 길을 열어주고 있습니다.
안과 분야는 망막 질환 관리에 OCT의 활용이 정착됨에 따라 2025년에도 34.10%라는 최대 점유율을 유지했습니다. 적응 광학 기술을 통해 현재는 광수용체의 모자이크 구조나 맥락막 모세혈관망의 혈류가 가시화되어, 황반 질환의 증상이 나타나기 전 단계에서 검출이 가능해졌습니다. 이와 동시에 종양학 분야도 연평균 성장률(CAGR) 14.58%로 성장세를 보이고 있습니다. 이는 광학 이미징이 종양 절제 시 절제 경계의 평가를 지원하고, 치료 중 혈관 반응을 추적할 수 있기 때문입니다. 저산소 영역을 표적으로 하는 광음향 조영제를 통해 종양 미세환경을 센티미터 단위의 깊이까지 실시간으로 가시화할 수 있게 되었습니다. 그 결과, 3차 의료기관에서 수술 중 광학 유도 기술이 표준화됨에 따라, 종양학 분야에서의 광학 이미징 시장 점유율은 상승할 전망입니다.
순환기 분야도 이에 뒤이어 성장하고 있습니다. OCT를 병용한 경피적 관상동맥 중재술은 복잡한 병변 관리에 있어 혈관조영술 단독보다 우수함이 입증되었습니다. 더 많은 보험사가 보험 적용을 승인함에 따라, 순환기 분야의 광학 영상 시장 규모는 가속화될 것으로 예측됩니다. 피부과 분야에서는 생검 횟수를 줄이고 의심스러운 병변의 선별 정확도를 높이는 AI 탑재 스펙트럼 스캐너가 활용되고 있습니다. 신경과 및 치과 분야는 규모는 작지만 혁신적인 발전이 나타나고 있습니다. 수술 중 뇌 OCT는 조직의 역학을 추적하며, 치과용 OCT는 이온화 방사선을 사용하지 않고 충치의 조기 발견을 돕습니다. 제약 연구 그룹에서는 라벨 프리 절편법을 활용하여 약물과 세포의 상호작용을 시각화함으로써, 항암제 개발 주기를 단축하고 있습니다.
지역별 분석
북미는 2025년에 39.40%의 점유율을 차지할 것으로 예상되며, 그 배경에는 탄탄한 보험 환급 제도와 대학, 스타트업, 대형 의료기기 제조업체를 연결하는 혁신 생태계가 있습니다. 2024년 FDA가 AI 지원형 피부암 광학 판독 장치를 승인함에 따라 전문 분야를 초월한 도입이 가속화되고 있으며, 한편 듀크 대학교의 휴대용 OCT 프로토타입은 진료 현장에서의 안과 검사를 한 단계 발전시키고 있습니다. 보험사들이 AI 통합형 진단의 적용 범위를 확대하고, 자본 예산이 하이브리드 수술실 업그레이드에 투입됨에 따라 해당 지역의 광학 이미징 시장 규모는 계속 성장할 것으로 전망됩니다.
아시아태평양은 가장 빠르게 성장하는 지역으로, 연평균 성장률(CAGR)은 12.02%로 예측됩니다. 중국, 인도, 일본 각국 정부는 국내 제조에 대한 자금 지원, 수입 의존도 감소, 그리고 지방 진료소의 장비 교체에 대한 보조금을 제공합니다. 당뇨성 망막병증 선별 검사에서 휴대용 OCT의 보급으로 의료 접근성 격차가 해소되고 있습니다. 그러나 초분광 영사 전문가가 부족하여, 특히 인도와 동남아시아에서는 임상시험의 진전이 더딘 실정입니다. 국경을 초월한 연수 파트너십은 장기적인 보급을 뒷받침할 인재 공급 체계를 구축하는 것을 목표로 하고 있습니다. 이러한 과제가 존재함에도 불구하고, 아시아태평양의 광학 이미징 시장은 의료 투자 증가와 망막 선별 검사 수요를 견인하는 높은 당뇨병 유병률의 혜택을 받고 있습니다.
유럽에서는 탄탄한 연구 보조금과 대학 병원 네트워크의 지원을 받아 여전히 대규모 기반을 유지하고 있습니다. 독일, 프랑스, 영국의 연구센터가 피부과 및 신경과 분야의 임상 검증을 주도하고 있지만, 치과 분야에서의 응용은 보험 환급 제도의 파편화로 인해 어려움을 겪고 있습니다. 환자 본인 부담 모델이 진료 이용을 제한하고 있어, 치과 진료소 중 광학 이미징을 활용하는 곳은 고작 8%에 그치고 있습니다. 한편, 동유럽의 의료 시스템에서는 충족되지 않은 종양학 이미징 수요에 대응하기 위해 저비용 플랫폼이 요구되고 있습니다. 중동 및 아프리카은 규모는 작지만, UAE와 사우디아라비아의 전문 병원에서 꾸준한 보급세가 나타나고 있습니다. 이는 정부 주도의 인프라 투자와 외상 영상 진단에 대한 군의 관심에 힘입은 결과입니다.
기타 혜택:
- 엑셀 형식 시장 예측(ME) 시트
- 3개월간의 애널리스트 지원
자주 묻는 질문
목차
제1장 서론
제2장 조사 방법
제3장 주요 요약
제4장 시장 구도
제5장 시장 규모와 성장 예측
제6장 경쟁 구도
제7장 시장 기회와 향후 전망
LSH 26.09.09According to Mordor Intelligence, the optical imaging market size is expected to grow from USD 2.83 billion in 2025 to USD 3.15 billion in 2026 and is forecast to reach USD 5.34 billion by 2031 at 11.18% CAGR over 2026-2031.
This report is Segmented by Product (Imaging Systems, Cameras, Illumination Systems, Lenses, and Software), Application (Ophthalmology, Dentistry, Dermatology, Cardiology, Neurology, and Oncology), Technique (OCT, NIRS, Hyperspectral Imaging, and Photoacoustic Tomography), End-User (Hospitals, Diagnostic Centers, and Research Labs), and Geography. The Market Forecasts are Provided in Terms of Value (USD).
Global Optical Imaging Market Trends and Insights
Accelerated deployment of intra-operative optical imaging systems in ambulatory surgery centers
Ambulatory surgery centers (ASCs) performed more than 23 million procedures in the United States in 2024, a 15% year-on-year rise as payers reposition surgeries to outpatient settings. Compact intra-operative optical platforms, exemplified by UCLA Health's Dynamic Optical Contrast Imaging device, are gaining traction because they delineate tumor margins in real time and trim procedure time by 20%, boosting ASC throughput. Capital spending on these systems is justified by 35-50% cost savings relative to hospital surgeries and by growing insurer support for outpatient pathways. Reimbursement shifts are expected to drive ASC share of all surgeries to 68% by 2030, feeding demand for portable, network-ready optical rigs and widening the optical imaging market base.
Expanding reimbursement coverage for OCT-guided PCI in the United States & Japan
The OCCUPI trial reported a 4.9% composite event rate for OCT-guided PCI at one year compared with 9.5% for angiography alone, sparking policy changes that lift reimbursement by 12% in the United States and broaden coverage in Japan. Providers gain a 22% drop in repeat procedures, offsetting higher per-procedure costs and spurring adoption across high-risk coronary lesions. Utilization of OCT in coronary interventions is forecast to climb from 15% in 2024 to about 35% by 2028, embedding optical imaging deeper into interventional cardiology workflows.
Capital-intensive shift from benchtop to integrated operating-room imaging suites
Fully integrated optical suites bundling OCT, fluorescence, and navigation cost USD 1.5-2.5 million per theater, triple to quadruple benchtop setups, and require extensive infrastructure rewiring. Hospitals also carry 15-20% extra ownership costs over five years for service contracts and specialist training. Consequently, only 23% of eligible hospitals had completed full integration in 2024, with many deferring upgrades or phasing modules over multiple budget cycles. Emerging economies face sharper constraints, slowing penetration despite clear clinical benefits.
Other drivers and restraints analyzed in the detailed report include:
- Rapid adoption of handheld OCT for diabetic retinopathy screening in primary care settings
- Integration of AI-based spectral algorithms in dermatology diagnostic workflows
- Limited reimbursement for dental optical imaging procedures in Europe
For complete list of drivers and restraints, kindly check the Table Of Contents.
Segment Analysis
Imaging Systems held 36.45% of revenue in 2025 on the strength of turnkey consoles used across ophthalmology, cardiology, and research settings. The optical imaging market size for this segment is forecast to expand steadily as vendors augment consoles with AI software and multi-modal add-ons. Rising demand for real-time guidance in minimally invasive surgery maintains hospital investment, even as procurement teams grapple with semiconductor shortages that inflate detector costs. Meanwhile, high-speed Cameras are redefining performance thresholds. Phantom High-Speed's S710 camera achieves 4,000 fps in holographic retinal blood-flow imaging, enabling precise Doppler calculations that enhance vascular diagnostics. This technical leap aligns with a projected 12.1% CAGR through 2031, the fastest within the product spectrum.
Next-generation illumination engines using narrow-band LEDs and super-continuum lasers sustain interest in the Illumination Systems segment as surgeons seek tissue-specific contrast. Software solutions, once peripheral, now anchor differentiation because AI algorithms deliver automated segmentation, vessel quantification, and anomaly flagging. Lenses remain indispensable: advances in aspheric and gradient-index optics boost depth penetration and reduce chromatic aberration, elevating image clarity. To mitigate chip shortages, TDK's Spin Photo Detector leverages magnetic elements to detect light at ultra-high speeds, opening a path to sidestep conventional semiconductor bottlenecks and stabilize component supply chains.
Ophthalmology retained the largest slice at 34.10% in 2025 due to entrenched OCT use for retinal disease management. Adaptive optics technologies are now revealing photoreceptor mosaics and choriocapillaris flow, allowing pre-symptomatic detection of macular disorders. In parallel, Oncology is gaining momentum with a 14.58% CAGR because optical imaging guides margin assessment during tumor resection and tracks vascular response during therapy. Photoacoustic contrast agents targeting hypoxic zones are enabling centimeter-deep visualization of tumor microenvironments in real time. Consequently, the optical imaging market share for oncology applications is set to rise as tertiary hospitals standardize intraoperative optical guidance.
Cardiology follows closely: OCT-guided percutaneous coronary intervention is proving superior to angiography alone in complex lesion management. The optical imaging market size for cardiology is projected to accelerate as more payers authorize coverage. Dermatology benefits from AI-enabled spectral scanners that cut biopsies and improve triage of suspicious lesions. Neurology and Dentistry niches are smaller yet innovative: intraoperative brain OCT tracks tissue mechanics, while dental OCT aids early caries detection without ionizing radiation. Pharmaceutical research groups employ label-free sectioning to visualize drug-cell interactions, shortening oncology drug discovery cycles.
Complete Report Scope:
- By Product
- Imaging Systems
- Optical Imaging Systems
- Spectral Imaging Systems
- Cameras
- Illumination Systems
- Lenses
- Software
- Imaging Systems
- By Application
- Ophthalmology
- Dentistry
- Dermatology
- Cardiology
- Neurology
- Oncology
- Biotechnology and Research
- Other Applications
- By Technique
- Optical Coherence Tomography
- Near-Infrared Spectroscopy
- Hyperspectral Imaging
- Photoacoustic Tomography
- By End-User
- Hospitals and Clinics
- Diagnostic Imaging Centres
- Research and Diagnostic Laboratories
- Other End-Users
- By Geography
- North America
- United States
- Canada
- Mexico
- South America
- Brazil
- Argentina
- Chile
- Peru
- Rest of South America
- Europe
- Germany
- United Kingdom
- France
- Italy
- Spain
- Rest of Europe
- Asia-Pacific
- China
- Japan
- South Korea
- India
- Australia
- New Zealand
- Rest of Asia-Pacific
- Middle East
- United Arab Emirates
- Saudi Arabia
- Turkey
- Rest of Middle East
- Africa
- South Africa
- Rest of Africa
- North America
Geography Analysis
North America held 39.40% share in 2025, anchored by strong reimbursement and an innovation ecosystem linking universities, startups, and large device makers. The FDA's green light for AI-assisted skin-cancer optical readers in 2024 accelerated cross-specialty adoption, while Duke University's handheld OCT prototypes advance point-of-care eye exams. The optical imaging market size in the region will keep growing as insurers widen coverage for AI-integrated diagnostics and as capital budgets target hybrid OR upgrades.
Asia-Pacific is the fastest-growing cluster, projected at a 12.02% CAGR. Governments in China, India, and Japan are funding domestic manufacturing, lowering import reliance, and subsidizing upgrades for rural clinics. Widespread use of handheld OCT in diabetic retinopathy screening is closing access gaps. Nevertheless, the lack of hyperspectral imaging specialists slows clinical trials, particularly in India and Southeast Asia. Cross-border training partnerships aim to build a talent pipeline that sustains longer-term adoption. Despite these hurdles, the optical imaging market in Asia-Pacific benefits from rising healthcare investment and high diabetes prevalence that drives retinal screening demand.
Europe maintains a sizeable base supported by robust research grants and academic hospital networks. German, French, and UK centers lead clinical validation in dermatology and neurology, yet dental applications suffer under fragmented reimbursement. Only 8% of dental practices use optical imaging because private pay models limit patient uptake. Eastern European health systems, meanwhile, seek lower-cost platforms to address unmet oncology imaging needs. The Middle East and Africa, while smaller, record steady uptake in specialist hospitals across the UAE and Saudi Arabia, buoyed by government-backed infrastructure spending and military interest in trauma imaging.
- Carl Zeiss AG
- Leica Microsystems (Danaher)
- Topcon Corporation
- Canon Medical Systems (Canon Inc.)
- Koninklijke Philips NV
- PerkinElmer Inc.
- Nikon Metrology NV (Nikon Corp.)
- Olympus Corporation
- Teledyne Princeton Instruments
- Prior Scientific
- Thorlabs Inc.
- Abbott Laboratories
- Headwall Photonics Inc.
- Optovue Inc.
- Cytoviva Inc.
- Michelson Diagnostics Ltd.
- Damae Medical
- Wasatch Photonics Inc.
- Santec Corporation
- BaySpec Inc.
- Optovue Inc.
Additional Benefits:
- The market estimate (ME) sheet in Excel format
- 3 months of analyst support
TABLE OF CONTENTS
1 Introduction
- 1.1 Study Assumptions and Market Definition
- 1.2 Scope of the Study
2 Research Methodology
3 Executive Summary
4 Market Landscape
- 4.1 Market Overview
- 4.2 Market Drivers
- 4.2.1 Accelerated deployment of intra-operative optical imaging systems in ambulatory surgery centres (North America and EU)
- 4.2.2 Expanding reimbursement coverage for OCT-guided PCI in the United States and Japan
- 4.2.3 Rapid adoption of handheld OCT for diabetic retinopathy screening in primary-care settings (Asia)
- 4.2.4 Integration of AI-based spectral algorithms in dermatology diagnostic workflows (EU major clinics)
- 4.2.5 Surge in pharma demand for label-free optical sectioning to accelerate oncology drug discovery
- 4.2.6 Military funding for photoacoustic tomography in trauma triage (Middle-East and Israel)
- 4.3 Market Restraints
- 4.3.1 Capital-intensive shift from benchtop to integrated operating-room imaging suites
- 4.3.2 Limited reimbursement for dental optical imaging procedures in Europe
- 4.3.3 Scarcity of hyperspectral imaging experts slows clinical validation in emerging Asia
- 4.3.4 Phototoxicity concerns restricting repeat imaging in paediatric neurology
- 4.4 Regulatory Outlook
- 4.5 Technological Outlook
- 4.6 Porter's Five Forces Analysis
- 4.6.1 Bargaining Power of Suppliers
- 4.6.2 Bargaining Power of Buyers
- 4.6.3 Threat of New Entrants
- 4.6.4 Threat of Substitutes
- 4.6.5 Intensity of Competitive Rivalry
5 Market Size and Growth Forecasts (Value)
- 5.1 By Product
- 5.1.1 Imaging Systems
- 5.1.1.1 Optical Imaging Systems
- 5.1.1.2 Spectral Imaging Systems
- 5.1.2 Cameras
- 5.1.3 Illumination Systems
- 5.1.4 Lenses
- 5.1.5 Software
- 5.1.1 Imaging Systems
- 5.2 By Application
- 5.2.1 Ophthalmology
- 5.2.2 Dentistry
- 5.2.3 Dermatology
- 5.2.4 Cardiology
- 5.2.5 Neurology
- 5.2.6 Oncology
- 5.2.7 Biotechnology and Research
- 5.2.8 Other Applications
- 5.3 By Technique
- 5.3.1 Optical Coherence Tomography
- 5.3.2 Near-Infrared Spectroscopy
- 5.3.3 Hyperspectral Imaging
- 5.3.4 Photoacoustic Tomography
- 5.4 By End-User
- 5.4.1 Hospitals and Clinics
- 5.4.2 Diagnostic Imaging Centres
- 5.4.3 Research and Diagnostic Laboratories
- 5.4.4 Other End-Users
- 5.5 By Geography
- 5.5.1 North America
- 5.5.1.1 United States
- 5.5.1.2 Canada
- 5.5.1.3 Mexico
- 5.5.2 South America
- 5.5.2.1 Brazil
- 5.5.2.2 Argentina
- 5.5.2.3 Chile
- 5.5.2.4 Peru
- 5.5.2.5 Rest of South America
- 5.5.3 Europe
- 5.5.3.1 Germany
- 5.5.3.2 United Kingdom
- 5.5.3.3 France
- 5.5.3.4 Italy
- 5.5.3.5 Spain
- 5.5.3.6 Rest of Europe
- 5.5.4 Asia-Pacific
- 5.5.4.1 China
- 5.5.4.2 Japan
- 5.5.4.3 South Korea
- 5.5.4.4 India
- 5.5.4.5 Australia
- 5.5.4.6 New Zealand
- 5.5.4.7 Rest of Asia-Pacific
- 5.5.5 Middle East
- 5.5.5.1 United Arab Emirates
- 5.5.5.2 Saudi Arabia
- 5.5.5.3 Turkey
- 5.5.5.4 Rest of Middle East
- 5.5.6 Africa
- 5.5.6.1 South Africa
- 5.5.6.2 Rest of Africa
- 5.5.1 North America
6 Competitive Landscape
- 6.1 Strategic Developments
- 6.2 Vendor Positioning Analysis
- 6.3 Company Profiles (includes Global level Overview, Market level overview, Core Segments, Financials as available, Strategic Information, Products and Services, and Recent Developments)
- 6.3.1 Carl Zeiss AG
- 6.3.2 Leica Microsystems (Danaher)
- 6.3.3 Topcon Corporation
- 6.3.4 Canon Medical Systems (Canon Inc.)
- 6.3.5 Koninklijke Philips NV
- 6.3.6 PerkinElmer Inc.
- 6.3.7 Nikon Metrology NV (Nikon Corp.)
- 6.3.8 Olympus Corporation
- 6.3.9 Teledyne Princeton Instruments
- 6.3.10 Prior Scientific
- 6.3.11 Thorlabs Inc.
- 6.3.12 Abbott Laboratories
- 6.3.13 Headwall Photonics Inc.
- 6.3.14 Optovue Inc.
- 6.3.15 Cytoviva Inc.
- 6.3.16 Michelson Diagnostics Ltd.
- 6.3.17 Damae Medical
- 6.3.18 Wasatch Photonics Inc.
- 6.3.19 Santec Corporation
- 6.3.20 BaySpec Inc.
- 6.3.21 Optovue Inc.
7 Market Opportunities and Future Outlook
- 7.1 White-space and Unmet-Need Assessment


