
|
시장보고서
상품코드
2121869
맥주 포장 : 시장 점유율 분석, 업계 동향과 통계, 성장 예측(2026-2031년)Beer Packaging - Market Share Analysis, Industry Trends & Statistics, Growth Forecasts (2026 - 2031) |
||||||
 Mordor Intelligence
Mordor Intelligence에 의하면, 2026년 맥주 포장 시장 규모는 257억 1,000만 달러로 추정되며, 2025년 248억 8,000만 달러에서 성장하여 2031년 예측은 302억 7,000만 달러되어, 2026-2031년 CAGR 3.32%를 기록할 전망입니다.
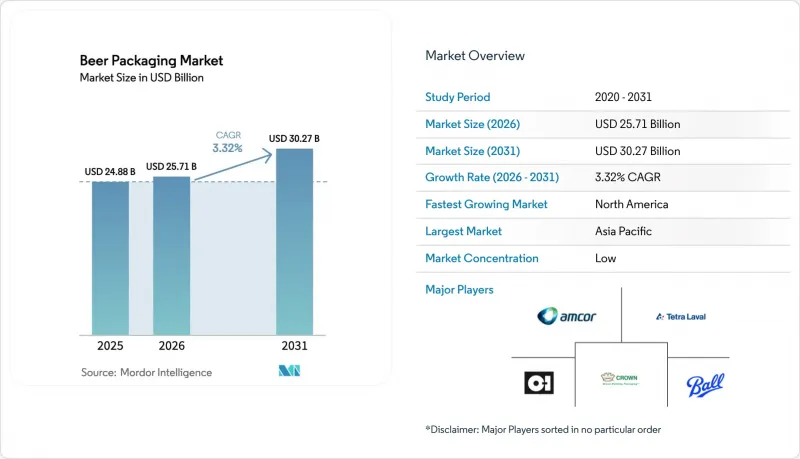
본 보고서는 포장 소재(유리, 금속, PET, 종이), 포장 형태(병, 캔, 통, 파우치), 용량(330밀리리터 이하, 331-650밀리리터, 650밀리리터 초과), 유통 채널(직접 판매, 간접 판매),및 지역(북미, 유럽, 아시아태평양, 중동 및 아프리카, 남미)별로 분류되어 있습니다. 시장 예측은 금액(달러)으로 표시되어 있습니다.
세계 맥주 포장 시장 동향 및 인사이트
북미에서는 수제 맥주 양조장의 급증으로 소량 생산용 캔 디자인 수요가 증가하고 있습니다.
크래프트 양조장의 성장으로 인해 포장 경제성이 재편되고 있습니다. 이는 Ball사의 ‘Dynamark Advanced Pro’와 같은 디지털 인쇄 기술을 통해 하나의 팔레트에 여러 가지 그래픽을 인쇄할 수 있게 되어, 기존의 최소 주문 수량이라는 장벽이 해소되었기 때문입니다. 유연한 캔 생산 라인을 통해 양조업체는 재고 관리 및 신규 SKU의 시험 도입이 가능해졌으며, 유리병을 과도하게 구매하지 않고도 시즌 한정 상품을 출시할 수 있게 되었습니다. 디지털 인쇄 비용은 오프셋 인쇄에 비해 300% 가까이 높지만, 이 지역 전체의 9,000개 이상의 양조장에서 판매 회전율 향상과 진열 효과 증대로 인해 그 비용이 상쇄되고 있습니다.
EU의 보증금 반환 제도에 힘입어 경량 재사용 유리병의 보급 확대
독일에서는 의무화된 보증금 제도를 통해 98%의 회수율을 달성하고 있으며, 이에 따라 Vetropack사의 ‘Echovai’와 같은 혁신적인 제품이 등장하고 있습니다. 이 강화 유리병은 기존 제품보다 30% 가벼우면서도 여러 번의 사용 주기를 견딜 수 있는 견고함을 갖추고 있습니다. 프랑스에서 제도가 도입됨에 따라 연간 6,000만 병을 처리할 수 있는 중앙 세척 시설이 구축되었으며, 비용 구조가 일회용 방식에서 순환형 자산 관리로 전환되고 있습니다.
유럽의 일회용 플라스틱 법적 금지 조치가 PET 사용을 억제
EU의 ‘포장 및 포장 폐기물 규정’에서는 2030년까지 재생 소재 함유율 30%를 의무화하고 있으며, 2025년부터는 대상 제품 형태가 단계적으로 폐지됩니다. 확대 생산자 책임(EPR)에 따른 수수료로 인해 무한히 재활용 가능한 알루미늄에 비해 PET의 비용이 상승하고 있으며, 금속이나 경량 반환식 유리로의 제품 구성 전환이 진행되고 있습니다.
부문 분석
유리는 맛이나 향에 영향을 미치지 않는 특성과 소비자들 사이에 뿌리내린 이미지로 인해 2025년에도 80.25%의 점유율을 유지했습니다. 그러나 알루미늄의 뛰어난 재활용성과 운송 비용 절감이 판매량을 끌어올리고 있으며, 2030년까지 포장재를 100% 재활용 가능하게 만들겠다는 정책 목표도 이를 뒷받침하고 있습니다. 연평균 성장률(CAGR) 5.52%로 확대되고 있는 PET는 현재 맥주의 탄산가스 유지 요구를 충족시키는 배리어 코팅 병에 의해 지탱되고 있지만, 종이는 여전히 2차 포장에 국한되어 있습니다.
에너지 비용 상승과 탄소세 도입으로 인해, 알루미늄은 용해 유리 대비 총비용 측면에서 우위를 더욱 확대되고 있습니다. 한편, 사용 후 식용유로 제조되는 바이오파라자일렌 PET와 같은 혁신 기술은 브랜드 신뢰도를 높이고, 폴리머의 더 광범위한 채택을 예고하고 있습니다. 맥주 제조업체들은 프리미엄 제품을 위해 틈새 시장용 유리 SKU를 유지하고 있지만, 맥주 포장 시장에서는 신규 생산 능력이 점점 더 경량 소재로 이동하고 있습니다.
2025년에는 전 세계 판매량의 74.64%를 병이 차지했습니다. 그럼에도 불구하고 수제 맥주의 호황, 편의점 쇼핑, 야외 소비와 같은 동향이 금속 용기에 유리하게 작용함에 따라 캔은 연평균 성장률(CAGR) 6.38%로 빠르게 성장하고 있습니다. 통의 성장은 신흥 지역의 세척 시스템에 대한 설비 투자로 인해 여전히 둔화되고 있으며, 파우치는 여전히 극히 미미한 점유율에 머물고 있습니다.
디지털 인쇄 기술 덕분에 소규모 양조업체도 다국적 기업과 동등한 수준의 포장 품질을 실현할 수 있게 되었으며, 불필요한 과잉 생산을 초래하지 않으면서 SKU 교체가 촉진되고 있습니다. 브라질에서 볼 수 있는 것처럼 지역별 캔 생산 라인에 대한 투자는 규모의 경제를 더욱 확대하고, 단위당 비용을 절감하며, 공급 안정성을 높이고 있습니다.
한편, 유리 용기 제조업체들은 엠보싱 가공이나 테이퍼 형상을 채택함으로써 매장에서의 상품 가치를 높여 이에 대응하고 있습니다.
지역별 분석
아시아태평양은 인구 규모, 소득 증가, 그리고 포장 제품을 선호하는 급속한 도시화에 힘입어 2025년에는 38.05%의 점유율로 1위를 차지했습니다. 베트남과 인도네시아의 콜드체인 확장이 PET의 보급을 뒷받침하는 한편, 중국의 수제 맥주 시장은 2024년에 331억 위안까지 성장하여 부티크 스타일의 캔 디자인과 선물용 유리병에 대한 수요를 모두 촉진하고 있습니다.
북미는 2031년까지 연평균 성장률(CAGR) 6.08%로 가장 높은 성장세를 보이고 있습니다. 9,000개가 넘는 수제 맥주 양조장이 소량 생산용 캔에 대한 안정적인 수요를 창출하고 있지만, 관세와 슬래브 부족으로 인해 비용이 상승하고 있습니다. 볼(Ball)사의 플로리다 인수와 같은 투자를 통해 공급망이 합리화되고 지속 가능한 생산 능력이 추가되면서, 이 지역에서 알루미늄의 성장 동력으로서의 역할이 강화되고 있습니다.
유럽은 여전히 프리미엄 시장의 거점이지만, 1인당 맥주 소비량은 정체되어 있습니다. EU의 재활용 의무화로 인해 강화 유리 재질의 반환용 병이나 재활용률이 높은 캔으로 자본이 이동하고 있습니다. 독일의 양조장에서는 순환 경제의 KPI를 충족하면서 산업 수준의 생산 속도를 실현하는 엠보싱 가공 라인을 도입하여 프리미엄 패키징을 선보이고 있습니다.
기타 혜택:
- 엑셀 형식 시장 예측(ME) 시트
- 3개월간의 애널리스트 지원
자주 묻는 질문
목차
제1장 서론
제2장 조사 방법
제3장 주요 요약
제4장 시장 구도
제5장 시장 규모와 성장 예측
제6장 경쟁 구도
제7장 시장 기회와 향후 전망
LSH 26.09.09According to Mordor Intelligence, beer packaging market size in 2026 is estimated at USD 25.71 billion, growing from 2025 value of USD 24.88 billion with 2031 projections showing USD 30.27 billion, growing at 3.32% CAGR over 2026-2031.

This report is Segmented by Packaging Material (Glass, Metal, PET, Paper), Packaging Type (Bottle, Can, Keg, Pouches), Pack Size (Less Than Equal To 330 Ml, 331-650 Ml, More Than 650 Ml), Distribution Channel (Direct Sales, Indirect Sales), and Geography (North America, Europe, Asia-Pacific, Middle East and Africa, South America). The Market Forecasts are Provided in Terms of Value (USD).
Global Beer Packaging Market Trends and Insights
Surge in Craft Breweries Driving Short-Run Can Designs in North America
Craft brewery growth reshapes packaging economics as digital printing such as Ball's Dynamark Advanced Pro lets multiple graphics run on one pallet, eliminating historic minimum-order barriers. Flexible can lines help brewers manage inventory, pilot new SKUs, and execute seasonal launches without excess glass bottle purchases. Though digital print premiums approach 300% over offset, the cost is offset by faster sell-through rates and stronger shelf appeal at more than 9,000 breweries across the region.
Rising Adoption of Lightweight Returnable Glass Bottles Backed by EU Deposit-Return Schemes
Mandated deposit systems achieve 98% return rates in Germany, prompting innovations like Vetropack's Echovai tempered bottle that is 30% lighter yet rugged across multiple cycles. France's rollout adds centralized washing hubs capable of 60 million bottles per year, shifting cost structures from one-way disposal toward circular asset management.
Legislative Bans on Single-Use Plastics Curtailing PET in Europe
The EU Packaging and Packaging Waste Regulation enforces 30% recycled content by 2030 and phases out targeted formats from 2025. Extended Producer Responsibility fees raise PET costs relative to infinitely recyclable aluminum, prompting portfolio shifts toward metal and lightweight returnable glass.
Other drivers and restraints analyzed in the detailed report include:
- Rapid Cold-Chain Expansion Enabling PET Penetration in Asian Beer
- Brand Premiumization Fueling Embossed Specialty Bottles Among German Breweries
- Tight U.S. Aluminum Slab Supply Elevating Can Costs for Craft Brewers
For complete list of drivers and restraints, kindly check the Table Of Contents.
Segment Analysis
Glass preserved an 80.25% share in 2025 due to sensory neutrality and entrenched consumer associations. Yet aluminum's recyclability edge and transportation savings peel away volume, aided by policy targets for 100% recyclable packaging by 2030. PET, advancing at 5.52% CAGR, draws on barrier-coated bottles that now satisfy beer's carbonation needs, while paper remains confined to secondary packs.
Rising energy costs and carbon levies widen aluminum's total-cost edge over furnace-fired glass. Meanwhile, innovations like bio-paraxylene PET from used cooking oil improve brand credentials and foreshadow broader polymer adoption. Brewers keep niche glass SKUs for premium variants, but the Beer packaging market increasingly redirects new capacity toward lighter substrates.
Bottles supplied 74.64% of global volume in 2025. Still, cans are accelerating at a 6.38% CAGR as dynamism in craft beer, convenience shopping, and outdoor consumption tips formats in favor of metal. Keg growth remains muted by cleaning-system cap-ex in emerging regions, and pouches stay marginal.
Digital printing lets small brewers match multinational packaging quality, increasing SKU churn without wasteful overruns. Investment in regional can lines, as seen in Brazil, further scales economies that shrink per-unit costs and enhance availability.
Glass manufacturers counter with embossing and tapered profiles that lift perceived value on-premise.
Complete Report Scope:
- By Packaging Material
- Glass
- Metal
- PET
- Paper
- By Packaging Type
- Bottle
- Can
- Keg
- Pouches
- By Pack Size
- Less than 330 ml
- 331-650 ml
- More than 650 ml
- By Distribution Channel
- Direct Sales
- Indirect Sales
- By Geography
- North America
- United States
- Canada
- Mexico
- Europe
- Germany
- United Kingdom
- France
- Italy
- Spain
- Russia
- Rest of Europe
- Asia-Pacific
- China
- India
- Japan
- South Korea
- Australia and New Zealand
- Rest of Asia-Pacific
- Middle East and Africa
- Middle East
- United Arab Emirates
- Saudi Arabia
- Turkey
- Rest of Middle East
- Africa
- South Africa
- Nigeria
- Egypt
- Rest of Africa
- Middle East
- South America
- Brazil
- Argentina
- Rest of South America
- North America
Geography Analysis
Asia-Pacific led with 38.05% share in 2025, underpinned by population scale, climbing incomes, and rapid urbanization that favor packaged formats. Cold-chain expansion in Vietnam and Indonesia supports PET penetration, while China's craft segment grew to CNY 33.1 billion in 2024, fostering boutique can designs and gift-oriented glass bottles alike.
North America posts the fastest 6.08% CAGR through 2031. More than 9,000 craft breweries generate steady demand for short-run cans, though tariff and slab shortages inflate costs. Investments such as Ball's Florida acquisition streamline supply networks and add sustainable capacity, reinforcing aluminum's role as the region's growth engine.
Europe remains a premium stronghold but confronts flat per-capita beer intake. The EU's recyclability mandate triggers capital shifts into tempered, returnable glass and high-recycled-content cans. German breweries showcase premium packaging by installing embossed lines that hit industrial speeds while meeting circular-economy KPIs.
- Amcor Ltd.
- Ardagh Group SA
- Crown Holdings Inc.
- Ball Corporation
- Tetra Laval International SA
- O-I Glass Inc.
- Canpack Group
- Silgan Holdings Inc.
- Vidrala SA
- Allied Glass Containers Ltd.
- Plastipak Holdings Inc.
- Nampak Ltd.
- Orora Limited
- Graphic Packaging International
- Toyo Seikan Group Holdings Ltd.
- Envases Universales
- Berlin Packaging LLC
- Sidel (Sidel Group)
- Krones AG
Additional Benefits:
- The market estimate (ME) sheet in Excel format
- 3 months of analyst support
TABLE OF CONTENTS
1 INTRODUCTION
- 1.1 Study Assumptions and Market Definition
- 1.2 Scope of the Study
2 RESEARCH METHODOLOGY
3 EXECUTIVE SUMMARY
4 MARKET LANDSCAPE
- 4.1 Market Overview
- 4.2 Market Drivers
- 4.2.1 Surge in Craft Breweries Driving Short-Run Can Designs in North America
- 4.2.2 Rising Adoption of Lightweight Returnable Glass Bottles Backed by EU Deposit-Return Schemes
- 4.2.3 Rapid Cold-Chain Expansion Enabling PET Penetration in Asian Beer
- 4.2.4 Brand Premiumization Fueling Embossed Specialty Bottles Among German Breweries
- 4.2.5 Aluminum Tariff Cuts Triggering Can Conversions in South America
- 4.2.6 E-commerce Multipacks Accelerating Corrugated Secondary Packaging Demand in the UK
- 4.3 Market Restraints
- 4.3.1 Legislative Bans on Single-Use Plastics Curtailing PET in Europe
- 4.3.2 Tight U.S. Aluminum Slab Supply Elevating Can Costs for Craft Brewers
- 4.3.3 Consumer Shift to Hard Seltzers Reducing Glass Volumes in Australia
- 4.3.4 High Cap-Ex for Keg Refurbishment Limiting Returnability in Emerging Markets
- 4.4 Supply-Chain Analysis
- 4.5 Regulatory Outlook
- 4.6 Porter's Five Forces Analysis
- 4.6.1 Threat of New Entrants
- 4.6.2 Bargaining Power of Buyers/Consumers
- 4.6.3 Bargaining Power of Suppliers
- 4.6.4 Threat of Substitute Products
- 4.6.5 Intensity of Competitive Rivalry
5 MARKET SIZE AND GROWTH FORECASTS (VALUE)
- 5.1 By Packaging Material
- 5.1.1 Glass
- 5.1.2 Metal
- 5.1.3 PET
- 5.1.4 Paper
- 5.2 By Packaging Type
- 5.2.1 Bottle
- 5.2.2 Can
- 5.2.3 Keg
- 5.2.4 Pouches
- 5.3 By Pack Size
- 5.3.1 Less than 330 ml
- 5.3.2 331-650 ml
- 5.3.3 More than 650 ml
- 5.4 By Distribution Channel
- 5.4.1 Direct Sales
- 5.4.2 Indirect Sales
- 5.5 By Geography
- 5.5.1 North America
- 5.5.1.1 United States
- 5.5.1.2 Canada
- 5.5.1.3 Mexico
- 5.5.2 Europe
- 5.5.2.1 Germany
- 5.5.2.2 United Kingdom
- 5.5.2.3 France
- 5.5.2.4 Italy
- 5.5.2.5 Spain
- 5.5.2.6 Russia
- 5.5.2.7 Rest of Europe
- 5.5.3 Asia-Pacific
- 5.5.3.1 China
- 5.5.3.2 India
- 5.5.3.3 Japan
- 5.5.3.4 South Korea
- 5.5.3.5 Australia and New Zealand
- 5.5.3.6 Rest of Asia-Pacific
- 5.5.4 Middle East and Africa
- 5.5.4.1 Middle East
- 5.5.4.1.1 United Arab Emirates
- 5.5.4.1.2 Saudi Arabia
- 5.5.4.1.3 Turkey
- 5.5.4.1.4 Rest of Middle East
- 5.5.4.2 Africa
- 5.5.4.2.1 South Africa
- 5.5.4.2.2 Nigeria
- 5.5.4.2.3 Egypt
- 5.5.4.2.4 Rest of Africa
- 5.5.4.1 Middle East
- 5.5.5 South America
- 5.5.5.1 Brazil
- 5.5.5.2 Argentina
- 5.5.5.3 Rest of South America
- 5.5.1 North America
6 COMPETITIVE LANDSCAPE
- 6.1 Market Concentration
- 6.2 Strategic Moves
- 6.3 Market Share Analysis
- 6.4 Company Profiles (includes Global level Overview, Market level overview, Core Segments, Financials as available, Strategic Information, Market Rank/Share for key companies, Products and Services, and Recent Developments)
- 6.4.1 Amcor Ltd.
- 6.4.2 Ardagh Group SA
- 6.4.3 Crown Holdings Inc.
- 6.4.4 Ball Corporation
- 6.4.5 Tetra Laval International SA
- 6.4.6 O-I Glass Inc.
- 6.4.7 Canpack Group
- 6.4.8 Silgan Holdings Inc.
- 6.4.9 Vidrala SA
- 6.4.10 Allied Glass Containers Ltd.
- 6.4.11 Plastipak Holdings Inc.
- 6.4.12 Nampak Ltd.
- 6.4.13 Orora Limited
- 6.4.14 Graphic Packaging International
- 6.4.15 Toyo Seikan Group Holdings Ltd.
- 6.4.16 Envases Universales
- 6.4.17 Berlin Packaging LLC
- 6.4.18 Sidel (Sidel Group)
- 6.4.19 Krones AG
7 MARKET OPPORTUNITIES AND FUTURE OUTLOOK
- 7.1 White-space and Unmet-Need Assessment