|
시장보고서
상품코드
2121933
에너지용 사물인터넷(IoT) : 시장 점유율 분석, 업계 동향과 통계, 성장 예측(2026-2031년)Internet Of Things In Energy - Market Share Analysis, Industry Trends & Statistics, Growth Forecasts (2026 - 2031) |
||||||
 Mordor Intelligence
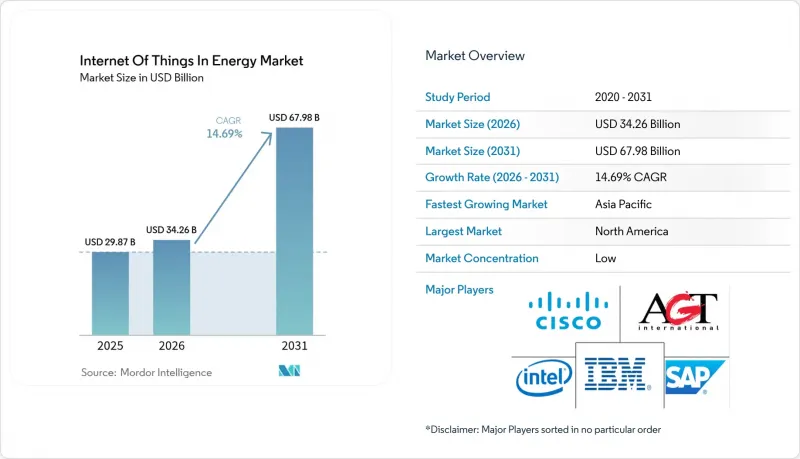
Mordor Intelligence에 따르면 2026년 에너지용 사물인터넷(IoT) 시장 규모는 342억 6,000만 달러로 추정되고 있으며, 2025년 298억 7,000만 달러에서 확대하며, 2031년에는 679억 8,000만 달러에 달할 것으로 예측됩니다.
2026-2031년까지 연평균 성장률(CAGR) 14.69%로 성장할 것으로 전망됩니다.
이 보고서는 구성 요소(하드웨어, 소프트웨어 및 분석, IoT 플랫폼 등), 용도(스마트 그리드 모니터링, 에너지 관리 시스템, 예측 유지보수 등), 연결 기술(셀룰러(2G-5G),위성 IoT 등), 도입 모델(클라우드, 엣지 등), 최종사용자(전력·가스 사업자, 주택 및 프로슈머 등), 그리고 지역별로 분류되어 있습니다.
전 세계 에너지용 IoT 시장의 동향 및 인사이트
유틸리티 분야의 스마트 계량기 도입 및 송전망 현대화 의무화
규제 당국이 저전압 네트워크의 가시화 및 수요 반응의 성과를 요구하는 가운데, 의무화된 첨단 계량 인프라는 시범 단계를 벗어났습니다. Honeywell과 Verizon은 현재 계량기에 네이티브 5G 무선 기능을 통합하여 원격 펌웨어 업데이트, 자가 복구형 메시 통신 및 자율적인 서비스 차단 기능을 가능하게 하고 있습니다. 노르웨이에서는 전국적인 도입이 완료되었지만, 실제 소비 데이터를 확인하고 있는 가구는 29.5%에 불과하여 실질적인 절전 실현 여부는 소비자의 참여와 직관적인 앱의 유무에 달려 있음이 부각되고 있습니다. 따라서 전력 회사는 기술적 도입에 더해 고객 교육, 게이미피케이션 요소를 도입한 대시보드, 요금 인센티브를 결합하고 있습니다. 고급 계량기는 상세한 간격 데이터를 배전 관리 시스템에 제공하므로, 지붕형 태양광발전의 계통 연계나 전기자동차(EV)의 클러스터링을 예측하여, 용량을 과도하게 증설하지 않고도 균형을 조정할 수 있게 됩니다.
5G/LPWAN 모듈의 비용 감소
반도체 공급이 정상화됨에 따라 2023-2025년에 협대역 IoT 모듈 가격이 28% 하락하여, 센서의 대량 도입에 있으며, 주요 비용 장벽이 제거되었습니다. 실험실 테스트에 따르면 LTE-M은 다른 많은 저전력 프로토콜보다 높은 처리량과 낮은 에너지 소비를 실현하고 있으며, 이는 배터리 교체에 비용이 드는 상황에서 중요합니다. 각 반도체 제조사는 엣지 측에서 이상 감지가 가능하도록 AI 가속 기능을 통합한 마이크로컨트롤러의 재설계를 진행하고 있습니다. 연구팀은 LoRa 게이트웨이를 경량 컴퓨팅 노드로 전환함으로써 기존의 페이로드 형식을 유지한 채 백홀 트래픽을 70% 줄일 수 있음을 입증했습니다. 현재 에너지 기업은 외딴 지역의 풍력발전소, 지방의 변전소, 밸브 어레이에 이러한 모듈을 도입하여, 트럭이 거의 들르지 않는 장소에도 자산 관리 기능을 배치하고 있습니다.
사이버 보안 및 OT/IT 융합의 위험
운영 장비가 공용 네트워크를 통해 연결될 수 있게 됨에 따라 공격 표면은 확대되고 있습니다. 2025년 8월에 시행될 EU의 사이버 복원력법에 따라 장치 제조사는 소프트웨어 구성 요소에 대한 문서화 및 적시 패치 제공이 의무화됩니다. 많은 변전소에서는 여전히 인증 기능이 없는 레거시 프로토콜이 사용되고 있으며, 침투 테스트에 따르면 세분화이 불충분할 경우 악성코드가 몇 분 만에 요금 청구 서버에서 차단기 제어 시스템으로 침투 경로를 확대할 수 있는 것으로 나타났습니다. 무선 업데이트(OTA) 파이프라인, 하드웨어 신뢰의 근원(Root of Trust), 그리고 제로 트러스트 기반의 세분화은 새로운 조달 프레임워크에서 필수 요소로 자리 잡고 있습니다. 효과적인 거버넌스는 정보 기술(IT) 팀과 운영 기술(OT) 팀 간의 보다 긴밀한 협력에 달려 있습니다.
부문 분석
2025년, 스마트 계량기, 지능형 센서, 게이트웨이, 엣지 컨트롤러는 에너지 시장내 IoT 점유율의 40.40%를 차지했습니다. 이러한 하드웨어의 확산은 전력 회사의 디지털 트윈을 지원하며, 상세한 현장 데이터를 분석용 클라우드로 전송하고 있습니다. 규제 당국이 벤더들에게 칩부터 클라우드에 이르는 기기의 무결성을 입증할 것을 요구함에 따라 보안 하드웨어 모듈과 신뢰 실행 환경(TEE)이 주목받고 있습니다. 단 한 번의 운영상 침해로 인한 비용이 수년에 걸친 효율화로 인한 절감분을 상쇄할 가능성이 있으므로 IoT 보안 플랫폼은 2031년까지 연평균 성장률(CAGR) 17.35%로 확대될 것으로 예측되며, 이는 전체 시스템 평균의 2배에 해당합니다. 강화된 ARM 또는 x86 보드 위에 구축된 엣지 서버에는 밀리초 단위로 장애 감지를 처리하는 AI 가속기가 탑재되어 출하되고 있습니다. Toshiba는 최근 펌웨어 블롭이 현장 장치에 도달하기 전에 서명을 수행하는 키 관리 칩셋을 발표하여, 규정 준수 심사 담당자의 감사 시간을 단축하고 있습니다.
소프트웨어와 서비스는 하드웨어의 선구자 역할을 따르고 있습니다. 공공 사업자들은 벤더가 디바이스, 연결 기능, 구독형 대시보드를 묶은 풀스택형 솔루션에 비용을 투자하고 있습니다. 데이터 과학 인력이 부족한 지역에서는 통합 리스크를 공급업체로 이전할 수 있으므로 매니지드 서비스 계약이 주목받고 있습니다. 그 결과, 시장에서 서비스 수익이 차지하는 비중이 증가하고 있습니다. 한편, 부품 공급업체들은 반도체 공급에 대한 지정학적 충격을 완화하기 위해 제조 거점을 수요 중심지 근처로 이전하고 있습니다.
변압기, 피더, 전압 조정기에 계측 장비를 설치하는 프로그램 덕분에 2025년 매출의 38.10%를 배전망 실시간 모니터링이 차지했습니다. AI 오버레이가 설정값을 즉시 조정함으로써, 낮 시간대에 옥상 태양광발전 출력이 급증하더라도 네트워크가 과전압 상태가 되는 것을 방지하고 있습니다. 커넥티드 전기자동차(EV) 인프라는 충전기가 부하와 전력 저장 두 가지 역할을 모두 수행하므로 15.05%라는 가장 높은 연평균 성장률(CAGR)을 보이고 있습니다. 전력 회사는 이를 무효 전력을 공급하고 주간 잉여 전력을 흡수할 수 있는 유연한 노드로 간주하고 있습니다. 정부는 양방향 충전기에 대한 보조금을 지급하는 한편, 개방형 프로토콜을 통한 원격 측정(텔레메트리)을 의무화하고 있으며, 이를 통해 에너지 시장내 IoT 기기 도입이 더욱 촉진되고 있습니다.
재생에너지 사업자들이 더 높은 설비 가동률을 추구하는 가운데, 예측 유지보수도 이에 뒤이어 주목을 받고 있습니다. 해상 풍력발전소에서는 현재, 가혹한 해양 환경에서도 나셀 센서와의 안정적인 연결을 유지하는 소프트웨어 정의 네트워크(SDN) 링이 통합되어 있습니다. 상업용 건물내 수요 반응 프로그램을 통해 중요한 시간대의 피크 전력 소비량이 최대 86%까지 감소했습니다. 산업 사용자들은 엣지 분석을 도입하여 생산 단위당 전력 소비량을 줄이고 있으며, 이 지표는 ESG 스코어카드 및 투자자의 평가 기준에 직접 반영됩니다.
지역별 분석
북미는 2025년 에너지 시장내 IoT 매출의 37.60%를 차지했습니다. 송전망 복원력에 대한 연방 정부의 투자, 주 차원의 청정 에너지 기준, 그리고 성숙한 이동통신 네트워크의 보급이 이러한 급속한 확산을 가능하게 하고 있습니다. 슈나이더 일렉트릭은 데이터센터의 부하가 변전소 증설 속도를 앞지르는 속도로 증가하고 있으며, 전력 회사가 기존 송전선에서 가능한 한 많은 전류를 끌어내기 위해 IoT 센서를 도입할 수밖에 없다고 경고하고 있습니다. 캐나다의 외딴 지역에 구축된 마이크로그리드는 영구 동토 지대에서 광섬유 설치 비용이 높기 때문에 위성 IoT의 조기 도입 사례로 꼽히고 있습니다. 멕시코의 에너지 개혁은 도입 첫날부터 예측 분석을 요구하는 분산형 태양광발전 투자자들을 끌어모으고 있습니다.
아시아태평양은 2031년까지 연평균 성장률(CAGR)이 16.58%로 가장 빠르게 성장하는 지역입니다. 일본의 슈퍼 솔라 프로젝트는 이론상 효율이 30%를 넘는 페로브스카이트 셀을 사용하여 2030년까지 20GW 달성을 목표로 하고 있습니다. 중국의 제14차 5개년 계획에 기반한 스마트 그리드 구축에는 다중 에너지 마이크로그리드와 송전 철탑에 통합된 5G 기지국이 포함됩니다. 인도의 재생에너지 추진 정책에서는 IoT 센서와 정부 보조금 대상인 클라우드 호스팅이 결합되어 있는 반면, 한국의 산업단지에서는 공장에 AI 엣지 박스를 도입하여 전력 피크를 줄이고 있습니다.
유럽에서는 엄격한 탄소 규제와 국경을 초월한 수급 조정 시장을 배경으로 꾸준한 확대가 나타나고 있습니다. EU의 사이버 복원력 법에 따르면 모든 IoT 예산에 보안 지출이 의무화되어 있습니다. 독일의 인더스트리 4.0 구상에서는 공장이 전력 품질 계측기를 생산 스케줄링에 통합하고 있으며, 단위당 와트시가 타크트 타임과 마찬가지로 중요한 KPI가 되고 있습니다. 영국 공공 부문의 에너지 효율화 프로그램에서는 시설 관리자가 분 단위의 상세한 정보를 파악할 수 있게된 결과, 이미 두 자릿수의 에너지 절감 효과를 달성하고 있습니다. 프랑스에서는 원자력발전소의 냉각 펌프에 진동 센서를 도입하여 운전 허가 기간을 연장하고 있으며, 북유럽의 송전망 운영 사업자는 실시간 유연성을 실현하기 위한 시장 플랫폼을 시범적으로 도입하고 있습니다. 중동 및 아프리카는 도입 초기 단계에 있지만, 그린 수소 플랜트와 연계된 대규모 태양광발전 및 에너지 저장 프로젝트가 미래의 수요를 확실하게 지원할 것입니다.
기타 혜택:
- 엑셀 형식의 시장 예측(ME) 시트
- 3개월간의 애널리스트 지원
자주 묻는 질문
목차
제1장 서론
제2장 조사 방법
제3장 개요
제4장 시장 구도
제5장 시장 규모와 성장 예측
제6장 경쟁 구도
제7장 시장 기회와 향후 전망
KSA 26.09.04According to Mordor Intelligence, internet of Things in the energy market size in 2026 is estimated at USD 34.26 billion, growing from 2025 value of USD 29.87 billion with 2031 projections showing USD 67.98 billion, growing at 14.69% CAGR over 2026-2031.
This report is Segmented by Component (Hardware, Software and Analytics, Iot Platforms, and More), Application (Smart Grid Monitoring, Energy Management Systems, Predictive Maintenance, and More), Connectivity Technology (Cellular (2G-5G), Satellite IoT, and More), Deployment Model (Cloud, Edge, and More), End-User (Electric and Gas Utilities, Residential and Prosumer, and More), and Geography
Global Internet Of Things In Energy Market Trends and Insights
Utility Smart-Meter Roll-Outs and Grid-Modernization Mandates
Mandated advanced metering infrastructure has moved beyond the pilot stage as regulators demand visibility of low-voltage networks and demand response outcomes. Honeywell and Verizon now embed native 5G radios into meters, enabling remote firmware updates, self-healing mesh communication, and autonomous service disconnects. Norway completed nationwide roll-outs yet only 29.5% of households checked live consumption data, underscoring that consumer engagement and intuitive apps decide whether hard savings materialize. Utilities therefore pair technical deployment with customer education, gamified dashboards, and tariff incentives. Advanced meters feed granular interval data to distribution management systems so that rooftop solar back-feed and electric vehicle (EV) clustering can be forecast and balanced without over-building capacity.
Falling 5G/LPWAN Module Cost
Chip supply normalization pushed narrow-band IoT module prices down by 28% between 2023 and 2025, removing a key cost barrier for high-volume sensor roll-outs. Laboratory tests show LTE-M offers higher throughput and lower energy consumption than many alternative low-power protocols, which is important where battery swaps are costly. Semiconductor makers are redesigning micro-controllers with integrated AI acceleration so that anomaly detection can occur at the edge. Research teams have proved that turning LoRa gateways into lightweight compute nodes trims backhaul traffic by 70% without breaking legacy payload formats. Energy firms now equip remote wind farms, rural substations, and valve arrays with these modules, placing asset intelligence where trucks rarely visit.
Cyber-Security and OT/IT Convergence Risk
As operational equipment becomes routable on public networks, attack surfaces multiply. The EU Cyber Resilience Act will come into force in August 2025, obliging device makers to document software components and issue timely patches. Many substations still run legacy protocols that lack authentication, and intrusion studies show malware can pivot from billing servers to breaker controls in minutes if segmentation is weak. Over-the-air update pipelines, hardware root-of-trust, and zero-trust segmentation are becoming mandatory across new procurement frameworks. Effective governance hinges on closer collaboration between information-technology and operational-technology teams.
Other drivers and restraints analyzed in the detailed report include:
- Distributed-Renewable Orchestration Needs
- AI-Driven Predictive-Maintenance ROI Cases
- Legacy-SCADA Interoperability Gap
For complete list of drivers and restraints, kindly check the Table Of Contents.
Segment Analysis
Smart meters, intelligent sensors, gateways, and edge controllers collectively secured 40.40% of the Internet of Things in the energy market share in 2025. The hardware wave anchors utility digital twins and pushes granular field data into analytics clouds. Security hardware modules and trusted execution environments gain notice because regulators now ask vendors to prove device integrity from chip to cloud. IoT security platforms are forecast to compound at 17.35% through 2031, twice the system average, as the cost of a single operational breach can erase multi-year efficiency savings. Edge servers built on ruggedised ARM or x86 boards are shipping with AI accelerators that handle fault detection in milliseconds. Toshiba recently unveiled a key-management chipset that signs firmware blobs before they touch the field device, trimming audit times for compliance reviewers.
Software and services follow hardware's beachhead. Utilities are paying for full-stack offerings where the vendor bundles devices, connectivity, and a subscription dashboard. Managed service contracts appeal in regions short of data-science talent because they shift integration risk to the supplier. As a result, services revenue is taking a larger slice of the expanding Internet of Things in the energy market. Meanwhile, component suppliers are moving manufacturing closer to demand centres to buffer any geopolitical shock to semiconductor flows.
Real-time distribution grid monitoring accounted for 38.10% of 2025 revenue thanks to programs that instrument transformers, feeders, and voltage regulators. AI overlays adapt set-points on the fly so that networks avoid over-voltage when rooftop solar spikes midday. Connected EV infrastructure shows the fastest 15.05% CAGR because chargers double as both load and storage assets. Utilities view them as flexible nodes that can supply reactive power and soak up midday excess. Governments are subsidising bidirectional chargers and demanding open-protocol telemetry, which funnels more devices into the Internet of Things in the energy market.
Predictive maintenance sits close behind as renewable owners chase higher capacity factors. Offshore wind farms now integrate software-defined networking rings that maintain deterministic links to nacelle sensors despite harsh marine environments. Demand-response programs inside commercial buildings have trimmed peak kW draw by up to 86% during critical intervals. Industrial users deploy edge analytics to lower electricity per unit of output, a metric that directly feeds ESG scorecards and investor screens.
Complete Report Scope:
- By Component
- Hardware
- Smart Thermostats
- Smart Meters
- EV Charging Stations
- Other Hardware
- Software and Analytics
- IoT Platforms
- IoT Security
- IoT Services
- Hardware
- By Application
- Smart Grid Monitoring
- Energy Management Systems
- Predictive Maintenance
- Connected EV Infrastructure
- Distributed-Renewable Integration
- Demand Response and Flexibility
- By Connectivity Technology
- Cellular (2G-5G)
- LPWAN (NB-IoT, LoRaWAN, Sigfox)
- Satellite IoT
- Wi-Fi/BLE
- PLC and Other
- By Deployment Model
- Cloud
- Edge
- On-premise
- By End-user
- Electric and Gas Utilities
- Oil and Gas Up/Mid/Down-stream
- Commercial and Industrial Facilities
- Residential and Prosumer
- Renewable Power Plants
- By Geography
- North America
- United States
- Canada
- Mexico
- South America
- Brazil
- Argentina
- Europe
- Germany
- United Kingdom
- France
- Russia
- Asia Pacific
- China
- India
- Japan
- South Korea
- ASEAN
- Rest of Asia Pacific
- Middle East and Africa
- Middle East
- Saudi Arabia
- Turkey
- Africa
- South Africa
- Middle East
- North America
Geography Analysis
North America commanded 37.60% of 2025 revenue for the Internet of Things in the energy market. Federal investment in grid resilience, state-level clean-energy standards, and a mature cellular footprint enable rapid adoption. Schneider Electric warns that data-centre load is climbing faster than substation build-outs, forcing utilities to deploy IoT sensors to squeeze every amp from existing lines. Canada's remote microgrids are early satellite IoT adopters because fibre drops are expensive in permafrost. Mexico's energy reform is attracting distributed solar investors who demand predictive analytics from day one.
Asia Pacific is the fastest-growing region at a 16.58% CAGR through 2031. Japan's super-solar project targets 20 GW by 2030 using perovskite cells with a theoretical efficiency beyond 30%. China's smart-grid rollout under the 14th Five-Year Plan includes multi-energy microgrids and 5G base stations embedded in transmission pylons. India's renewables push blends IoT sensors with government-subsidised cloud hosting, while South Korean industrial parks equip factories with AI edge boxes to shave power peaks.
Europe shows steady expansion on the back of stringent carbon laws and cross-border balancing markets. The EU Cyber Resilience Act hard-codes security spending into every IoT budget. Germany's Industry 4.0 initiatives mean factories integrate power-quality meters with production scheduling so that watt-hours per unit become a KPI as important as takt time. The United Kingdom's public-sector energy efficiency program has already logged double-digit savings after building managers gained minute-level insights. France upgrades nuclear station cooling pumps with vibration sensors to extend operating licenses, and Nordic grid operators test market platforms for real-time flexibility. The Middle East and Africa are earlier in the curve but mega solar-and-storage projects linked to green-hydrogen plants guarantee future demand.
- Cisco Systems
- IBM Corporation
- Siemens AG
- Schneider Electric
- Huawei Technologies
- Intel Corporation
- SAP SE
- Oracle Corporation
- AGT International
- Davra Networks
- Flutura Business Solutions
- Wind River Systems
- Silver Spring Networks
- Verizon Business
- Vodafone IoT
- GE Digital
- Emerson Electric
- Siemens Gamesa (renewable IoT)
- Landis+Gyr
- Kamstrup
Additional Benefits:
- The market estimate (ME) sheet in Excel format
- 3 months of analyst support
TABLE OF CONTENTS
1 INTRODUCTION
- 1.1 Study Assumptions and Market Definition
- 1.2 Scope of the Study
2 RESEARCH METHODOLOGY
3 EXECUTIVE SUMMARY
4 MARKET LANDSCAPE
- 4.1 Market Overview
- 4.2 Market Drivers
- 4.2.1 Utility smart-meter roll-outs and grid-modernization mandates
- 4.2.2 Falling 5G/LPWAN module costs
- 4.2.3 Distributed-renewable orchestration needs
- 4.2.4 AI-driven predictive-maintenance ROI cases
- 4.2.5 Flexibility monetisation (V2G, P2P energy)
- 4.2.6 Carbon-accounting data regulations
- 4.3 Market Restraints
- 4.3.1 Cyber-security and OT/IT convergence risk
- 4.3.2 Legacy-SCADA interoperability gaps
- 4.3.3 Edge-compute talent scarcity
- 4.3.4 Semiconductor-supply volatility
- 4.4 Value Chain Analysis
- 4.5 Regulatory Landscape
- 4.6 Technological Outlook
- 4.7 Porter's Five Forces Analysis
- 4.7.1 Threat of New Entrants
- 4.7.2 Bargaining Power of Buyers
- 4.7.3 Bargaining Power of Suppliers
- 4.7.4 Threat of Substitutes
- 4.7.5 Intensity of Rivalry
5 MARKET SIZE AND GROWTH FORECASTS (VALUE)
- 5.1 By Component
- 5.1.1 Hardware
- 5.1.1.1 Smart Thermostats
- 5.1.1.2 Smart Meters
- 5.1.1.3 EV Charging Stations
- 5.1.1.4 Other Hardware
- 5.1.2 Software and Analytics
- 5.1.3 IoT Platforms
- 5.1.4 IoT Security
- 5.1.5 IoT Services
- 5.1.1 Hardware
- 5.2 By Application
- 5.2.1 Smart Grid Monitoring
- 5.2.2 Energy Management Systems
- 5.2.3 Predictive Maintenance
- 5.2.4 Connected EV Infrastructure
- 5.2.5 Distributed-Renewable Integration
- 5.2.6 Demand Response and Flexibility
- 5.3 By Connectivity Technology
- 5.3.1 Cellular (2G-5G)
- 5.3.2 LPWAN (NB-IoT, LoRaWAN, Sigfox)
- 5.3.3 Satellite IoT
- 5.3.4 Wi-Fi/BLE
- 5.3.5 PLC and Other
- 5.4 By Deployment Model
- 5.4.1 Cloud
- 5.4.2 Edge
- 5.4.3 On-premise
- 5.5 By End-user
- 5.5.1 Electric and Gas Utilities
- 5.5.2 Oil and Gas Up/Mid/Down-stream
- 5.5.3 Commercial and Industrial Facilities
- 5.5.4 Residential and Prosumer
- 5.5.5 Renewable Power Plants
- 5.6 By Geography
- 5.6.1 North America
- 5.6.1.1 United States
- 5.6.1.2 Canada
- 5.6.1.3 Mexico
- 5.6.2 South America
- 5.6.2.1 Brazil
- 5.6.2.2 Argentina
- 5.6.3 Europe
- 5.6.3.1 Germany
- 5.6.3.2 United Kingdom
- 5.6.3.3 France
- 5.6.3.4 Russia
- 5.6.4 Asia Pacific
- 5.6.4.1 China
- 5.6.4.2 India
- 5.6.4.3 Japan
- 5.6.4.4 South Korea
- 5.6.4.5 ASEAN
- 5.6.4.6 Rest of Asia Pacific
- 5.6.5 Middle East and Africa
- 5.6.5.1 Middle East
- 5.6.5.1.1 Saudi Arabia
- 5.6.5.1.2 Turkey
- 5.6.5.2 Africa
- 5.6.5.2.1 South Africa
- 5.6.5.1 Middle East
- 5.6.1 North America
6 COMPETITIVE LANDSCAPE
- 6.1 Market Concentration
- 6.2 Strategic Moves
- 6.3 Market Share Analysis
- 6.4 Company Profiles (includes Global level Overview, Market level overview, Core Segments, Financials as available, Strategic Information, Market Rank/Share for key companies, Products and Services, and Recent Developments)
- 6.4.1 Cisco Systems
- 6.4.2 IBM Corporation
- 6.4.3 Siemens AG
- 6.4.4 Schneider Electric
- 6.4.5 Huawei Technologies
- 6.4.6 Intel Corporation
- 6.4.7 SAP SE
- 6.4.8 Oracle Corporation
- 6.4.9 AGT International
- 6.4.10 Davra Networks
- 6.4.11 Flutura Business Solutions
- 6.4.12 Wind River Systems
- 6.4.13 Silver Spring Networks
- 6.4.14 Verizon Business
- 6.4.15 Vodafone IoT
- 6.4.16 GE Digital
- 6.4.17 Emerson Electric
- 6.4.18 Siemens Gamesa (renewable IoT)
- 6.4.19 Landis+Gyr
- 6.4.20 Kamstrup
7 MARKET OPPORTUNITIES AND FUTURE OUTLOOK
- 7.1 White-space and Unmet-need Assessment