

|
시장보고서
상품코드
2122032
모바일 백홀 : 시장 점유율 분석, 업계 동향과 통계, 성장 예측(2026-2031년)Mobile Backhaul - Market Share Analysis, Industry Trends & Statistics, Growth Forecasts (2026 - 2031) |
||||||
 Mordor Intelligence
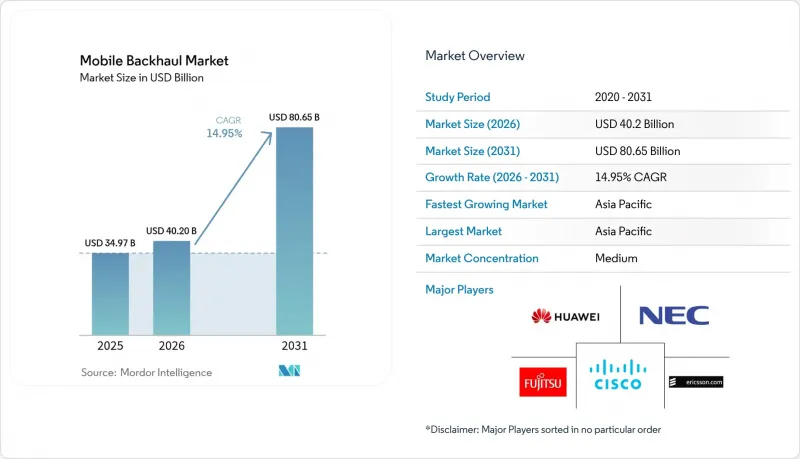
Mordor Intelligence에 따르면 모바일 백홀 시장 규모는 2025년 349억 7,000만 달러에서 2026년 402억 달러로 성장할 것으로 예상되며, 2031년에는 806억 5,000만 달러에 이를 것으로 전망됩니다. 2026년부터 2031년까지 연평균 14.95%의 성장률을 보일 것으로 예상됩니다.
이 보고서는 배포 방식(유선[광섬유 및 동선/DSL], 무선[마이크로파, 밀리파 등]),장비 유형(라우터 및 스위치, 마이크로파 무선기 등), 서비스 유형(전문 서비스, 매니지드 서비스 등), 네트워크 아키텍처(매크로셀 백홀 등), 최종사용자(모바일 네트워크 사업자, 중립 호스트 및 타워 기업 등), 그리고 지역별로 분류되어 있습니다.
글로벌 모바일 백홀 시장의 동향 및 인사이트
증가하는 모바일 데이터 트래픽과 스마트폰 보급
스마트폰 1대당 월평균 데이터 사용량은 2023년 21GB에서 2029년까지 56GB로 급증할 것으로 예측되며, 모바일 트래픽의 75%를 동영상이 차지할 것으로 전망됩니다. 지역 간 격차도 뚜렷해지고 있으며, 북미 사용자의 경우 월간 66GB에 달할 가능성이 있는 반면, 사하라 이남 아프리카에서는 23GB 전후에 그칠 것으로 예상되며, 이로 인해 통신 사업자들은 국가별로 최적의 백홀 구성을 설계할 수밖에 없게 되었습니다. 광섬유 간선과 고대역 마이크로파 홉을 결합한 하이브리드 토폴로지는 도로 굴착 허가를 받는 데 시간이 걸리지 않으면서도 용량 수요를 충족시킬 수 있으며, 현재 도시 지역의 고밀도화에서 주류를 이루고 있습니다. 스몰 셀의 보급으로 수천 개의 단거리 링크가 추가되는 가운데, 사이트별 용량을 실시간으로 조정할 수 있는 자동 네트워크 관리 플랫폼에 대한 새로운 투자가 진행되고 있습니다.
5G의 급속한 확산이 용량 수요를 견인
5G 클러스터의 기지국 밀도는 1km²당 4-5개 사이트에서 40-50개 사이트로 증가하고 있으며, 백홀 종단 수가 비약적으로 증가하고 있습니다. 중국에서만 60만개 이상의 5G 매크로셀 및 스몰셀이 구축되었으며, 그 수는 4G보다 1.3-1.5배 더 많을 것으로 예측됩니다. 현재 각 5G 셀에는 10Gbps의 업링크와 5밀리초 미만의 엄격한 지연 요건이 요구되고 있으며, 이에 따라 70/80 GHz E-밴드 무선 장비와 광섬유를 이용한 타임-센시티브 네트워킹의 도입이 가속화되고 있습니다. 자본 부담의 증가로 인해 많은 통신 사업자들은 공유 타워나 임대형 다크 파이버 도입으로 방향을 전환하고 있으며, 초기 비용을 절감하는 동시에 100Gbps 인터페이스로의 업그레이드 경로를 확보하고 있습니다.
광섬유 및 주파수 대역 비용에 따른 높은 설비 투자
인구 밀도가 높은 도시 지역의 광섬유 매설 공사는 1킬로미터당 10만 달러를 초과하는 경우도 있으며, 도로 굴착 허가를 받기 어려운 지역에서는 그 비용이 급격히 치솟습니다. 또한 전기 요금 급등으로 인해 4G와 5G 주파수 대역이 겹치는 경우, 매크로 사이트의 전력 소비량이 2배로 증가하여 운영 비용이 급증하고 있습니다. 개발도상국에서는 저금리 융자 이용이 제한되어 있으며, 광섬유 설치가 지연되고 있으며, 장기적인 경제성 측면에서 광섬유가 유리하더라도 통신 사업자들은 마이크로파에 의존할 수밖에 없는 상황에 처해 있습니다. 그 결과, 도시와 지방 간 사용자 경험의 질에 격차가 발생하여 디지털 포용 목표 달성을 저해하고 있습니다.
부문 분석
광섬유 기반 링크는 타의 추종을 불허하는 용량과 낮은 지연 시간 덕분에 2025년 모바일 백홀 시장의 54.30%를 차지했습니다. 이 점유율은 2025년 189억 9,000만 달러에 달하는 모바일 백홀 시장 규모에서 가장 큰 도입 점유율에 해당합니다. 그러나 도시 지역의 고밀도화와 돌발적인 사건으로 인해 신속한 서비스 개통이 요구되는 가운데, 무선을 통한 대체 수단은 2031년까지 연평균 성장률(CAGR) 16.18%를 기록하며 그 격차를 좁혀갈 전망입니다. 통신 사업자들은 70/80 GHz E-밴드 무선과 임대된 다크 파이버 트렁크를 결합하여 고비용의 토목 공사를 피하면서도 1 홉당 10Gbps의 통신 속도를 실현하고 있습니다.
하이브리드 아키텍처는 현재 표준이 되었습니다. 코어 집약에는 여전히 광섬유가 선호되는 매체이지만, 마이크로파 및 밀리파는 허가 취득이나 지역 조건으로 인해 노굴 공사가 어려운 에지 스몰 셀이나 기업 시설에 서비스를 제공하고 있습니다. 새롭게 부상하고 있는 W-밴드 및 D-밴드 링크는 1-2km 거리에서 멀티 기가비트 처리량을 실현하여 고밀도 클러스터에서 광섬유를 보완합니다. 인구 밀도가 낮은 지역에서는 통신 사업자가 LEO 위성 백홀을 마이크로파 링로 연결하여 예산 한도를 초과하지 않고 연속적인 커버리지를 구축하고 있습니다. 이러한 유연성이 모바일 백홀 시장의 장기적인 경쟁력 기반이 되고 있습니다.
마이크로파 무선 장비는 2025년 모바일 백홀 시장 규모의 40.55%를 차지하고 있으며, 이는 수십년에 걸친 현장 신뢰성을 바탕으로 합니다. 각 벤더는 스펙트럼 효율을 16 bps/Hz까지 향상시키는 한편, 비연속 채널을 통합하는 링크 본딩 방식을 추가하고 있습니다. 스몰셀용 백홀 장비는 현재 매출에서 차지하는 비중이 극히 일부에 불과하지만, 경기장, 쇼핑몰, 교통 거점 등에서 실내 5G가 도입됨에 따라 연평균 성장률(CAGR) 17.08%로 성장할 것으로 전망됩니다.
모바일 백홀 시장에서는 통합형 액세스·백홀(IAB)로의 전환이 진행되고 있으며, 28 GHz 대역의 무선통신이 사용자 단말기에 대한 서비스 제공과 상류로의 트래픽 중계를 동시에 수행합니다. 이를 통해 옥상 혼잡이 완화되고 구역 설정이 간소화됩니다. 밀리미터파 칩셋의 발전으로 2023년 이후 전력 소비가 30% 감소하여, 설치 공사를 최소화한 폴 마운트형 및 윈도우 마운트형 노드가 가능해졌습니다. 자기 조직화 네트워크(SON) 소프트웨어를 번들로 제공하는 벤더는 현장 방문 횟수를 줄이고 혼잡한 환경에서의 링크 배치를 최적화할 수 있으며, 입찰에서 유리한 입지를 점하고 있습니다.
지역별 분석
아시아태평양은 모바일 백홀 시장의 34.60%를 차지하고 있으며, 막대한 5G 투자, 정부 보조금 및 고밀도 도시 인구를 배경으로 연평균 성장률(CAGR) 16.92%로 확대되고 있습니다. 중국, 일본, 한국에서는 이미 주요 도시를 독립형 5G로 커버하고 있으며, 굴착으로 인한 병목 현상을 피할 수 있는 10Gbps 마이크로파 홉에 대한 수요가 급증하고 있습니다. 인도에서는 최근 주파수 경매를 계기로 고속도로변과 2선 도시로의 광섬유 설치가 잇따르고 있으며, 통신 사업자들은 히말라야 지역 및 도서 지역의 통신망 구축을 위해 위성과 마이크로파를 결합한 하이브리드 방식의 시범 운영도 진행하고 있습니다. 농촌 지역의 광섬유 구축을 지원하는 정부의 정책도 이러한 추세를 더욱 지원하고 있습니다.
북미는 규모는 작지만, 가상화 RAN 및 다크 파이버 집약 분야의 혁신을 주도하고 있습니다. 버라이즌과 T-Mobile은 2024년에 지역 광섬유 사업자를 인수하여 광 네트워크 기반을 강화하고, 고정 무선 접속(FWA) 확장을 지원할 확장 가능한 백홀을 확보했습니다. 연방통신위원회(FCC)의 90억 달러 규모의 ‘5G 기금’은 외딴 지역의 기지국 업그레이드를 촉진하고 있으며, 지형적 이유로 도랑 파기 공사가 어려운 지역에서는 마이크로파나 위성을 통한 백홀 투자를 유도하고 있습니다. 통신 사업자가 기가비트 광대역과 기지국의 업링크 모두에 광섬유를 재사용함으로써, 유선 및 모바일의 융합이 가속화되고 자본 수익률(ROI)이 향상되고 있습니다.
유럽의 성숙한 시장에서는 엄격한 규제 심사와 EU 전역에 걸친 5G 회랑 구축 추진 간의 균형이 이루어지고 있습니다. 인프라 공유 체계를 통해 중복되는 설비 투자가 줄어드는 한편, 민관 파트너십을 통해 커넥티드 프레이트(Connected Freight)와 같은 저지연 서비스에 필수적인 국경을 넘는 광섬유 경로의 자금 조달이 추진되고 있습니다. 한편, 중동에서는 고밀도 스몰 셀 네트워크에 의존하는 스마트 시티 구상이 급속히 추진되고 있으며, 아프리카의 통신 사업자들은 외딴 지역의 통신 커버리지를 백홀하기 위해 저궤도(LEO) 위성 군집을 활용하고 있습니다. 라틴아메리카에서는 17개국에서 5G 서비스가 개시되었으며, 통신 사업자들은 컨소시엄을 구성해 해저 케이블 용량을 임대하고, 마이크로파 회선망을 통해 내륙 지역으로 분배함으로써 국내 네트워크에 내결함성을 확보하고 있습니다.
기타 혜택:
- 엑셀 형식의 시장 예측(ME) 시트
- 3개월간의 애널리스트 지원
자주 묻는 질문
목차
제1장 서론
제2장 조사 방법
제3장 개요
제4장 시장 구도
제5장 시장 규모와 성장 예측
제6장 경쟁 구도
제7장 시장 기회와 향후 전망
KSA 26.09.03According to Mordor Intelligence, mobile backhaul market size in 2026 is estimated at USD 40.2 billion, growing from 2025 value of USD 34.97 billion with 2031 projections showing USD 80.65 billion, growing at 14.95% CAGR over 2026-2031.
This report is Segmented by Deployment (Wired [Fiber/Optical and Copper/DSL], Wireless [Microwave, Millimetre-Wave, and More]), Equipment Type (Routers and Switches, Microwave Radios, and More), Service Type (Professional Services, Managed Services, and More), Network Architecture (Macro-Cell Backhaul, and More), End-User (Mobile Network Operators, Neutral-Host and Tower Companies, and More), and Geography.
Global Mobile Backhaul Market Trends and Insights
Growing Mobile Data Traffic & Smartphone Adoption
Average monthly data per smartphone is forecast to soar from 21 GB in 2023 to 56 GB by 2029, with video expected to account for 75% of mobile traffic. Regional divergence is emerging: North American users may hit 66 GB per month while Sub-Saharan Africa lingers near 23 GB, forcing operators to engineer country-specific backhaul mixes. Hybrid topologies that splice fiber trunks with high-band microwave hops now dominate urban densification because they meet capacity needs without prolonged street-dig permitting. Small-cell proliferation adds thousands of short-haul links, prompting fresh investment in automated network-management platforms that can tune capacity per site in real time.
Rapid 5G Rollout Driving Capacity Needs
Base-station density is climbing from 4-5 to 40-50 sites per km2 in 5G clusters, multiplying backhaul terminations. China alone is building more than 600,000 5G macro and small cells, a count projected to outstrip 4G by 1.3-1.5 times . Each 5G cell now requires 10 Gbps uplinks and stringent latency of sub-5 ms, accelerating the adoption of 70/80 GHz E-band radios and time-sensitive networking over fiber. Capital stress is nudging many operators toward shared towers and leased dark fiber, lowering up-front costs while ensuring upgrade paths to 100 Gbps interfaces.
High Capex for Fiber & Spectrum Costs
Fiber trenching in dense cities can run beyond USD 100,000 per Kilometer, a figure that climbs sharply where road-opening permits are scarce. Rising electricity prices also double macro-site power draw when 4G and 5G bands overlap, inflating operational overhead. In developing economies, limited access to low-interest financing delays fiber build-outs, forcing carriers to rely on microwave even where long-term economics favor fiber. The result is uneven quality-of-experience across urban and rural divides, hindering digital-inclusion goals.
Other drivers and restraints analyzed in the detailed report include:
- Cloud-Native & Open RAN Architectures
- Satellite LEO Backhaul for Rural Reach
- SDN Backhaul Cybersecurity Risks
For complete list of drivers and restraints, kindly check the Table Of Contents.
Segment Analysis
Fiber-based links constituted 54.30% of the mobile backhaul market in 2025 due to their unrivalled capacity and low latency. This share translates to the largest deployment slice of the mobile backhaul market size at USD 18.99 billion in 2025. Wireless alternatives, however, are set to post a 16.18% CAGR through 2031, narrowing the gap as urban densification and pop-up events demand rapid turn-ups. Operators mesh 70/80 GHz E-band radios with leased dark fiber trunks, delivering 10 Gbps per hop while avoiding costly civil works.
Hybrid architectures are now standard: fiber remains the preferred medium for core aggregation, but microwave and millimeter-wave serve edge small cells and enterprise venues where permits or geography stall trenching. Emergent W-band and D-band links promise multi-gigabit throughput over 1-2 km, complementing fiber for dense clusters. In sparsely populated regions, operators splice LEO satellite backhaul into microwave rings, creating contiguous coverage without exceeding budget ceilings. This flexibility underpins the long-term competitiveness of the mobile backhaul market.
Microwave radios held 40.55% of the mobile backhaul market size in 2025, reflecting decades of field-proven reliability. Vendors have pushed spectral efficiency to 16 bps/Hz while adding link-bonding schemes that aggregate non-contiguous channels. Small cells backhaul gear, though only a fraction of revenue today, is set for a 17.08% CAGR as stadiums, malls, and transport hubs adopt indoor 5G.
The mobile backhaul market is witnessing a pivot toward integrated access and backhaul (IAB), where a 28 GHz radio simultaneously serves user devices and relays traffic upstream. This reduces rooftop congestion and simplifies zoning. Millimeter-wave chipset advances cut power draw by 30% since 2023, enabling pole-mount and window-mount nodes that require minimum site work. Vendors that bundle self-organizing-network software are winning tenders because they lower truck rolls and optimize link alignment in cluttered environments.
Complete Report Scope:
- By Deployment
- Wired
- Fiber/Optical
- Copper/DSL
- Wireless
- Microwave
- Millimetre-Wave (E- and V-band)
- Satellite
- Free-Space Optics
- Wired
- By Equipment Type
- Routers and Switches
- Microwave Radios
- Optical Transport Equipment
- Small-Cell Backhaul Equipment
- Others
- By Service Type
- Professional Services
- Managed Services
- Installation and Integration
- Maintenance and Support
- By Network Architecture
- Macro-Cell Backhaul
- Small-Cell Backhaul
- Cloud RAN/Fronthaul
- By End-user
- Mobile Network Operators
- Neutral-Host and Tower Companies
- Internet Service Providers
- Private Enterprises and Utilities
- By Geography
- North America
- United States
- Canada
- Mexico
- South America
- Brazil
- Argentina
- Rest of South America
- Europe
- United Kingdom
- Germany
- France
- Spain
- Italy
- Russia
- Rest of Europe
- Asia-Pacific
- China
- India
- Japan
- South Korea
- Australia
- Rest of Asia-Pacific
- Middle East
- GCC
- Turkey
- Rest of Middle East
- Africa
- South Africa
- Nigeria
- Egypt
- Rest of Africa
- North America
Geography Analysis
Asia Pacific commands 34.60% of the mobile backhaul market, expanding at 16.92% CAGR thanks to outsized 5G investments, state subsidies, and dense urban populations. China, Japan, and South Korea already blanket major cities with standalone 5G, driving steep demand for 10 Gbps microwave hops that skirt excavation bottlenecks. India's recent spectrum auctions have unleashed a fiber-laying spree along highways and into tier-2 cities, while operators also pilot satellite-plus-microwave hybrids for Himalayan and island coverage. Government schemes that underwrite rural fiber further sustain momentum.
North America, while smaller by volume, leads innovation in virtualized RAN and dark-fiber aggregation. Verizon and T-Mobile bolstered their optical footprints by acquiring regional fiber players in 2024, locking in scalable backhaul to support fixed-wireless access rollouts. The Federal Communications Commission's USD 9 billion 5G Fund incentivizes cell-site upgrades in remote counties, channeling investments toward microwave and satellite backhaul where terrain hampers trenching. Fixed-mobile convergence accelerates as operators reuse fiber for both gigabit broadband and cell-site uplinks, amplifying return on capital.
Europe's mature markets balance stringent regulatory reviews with a push for pan-EU 5G corridors. Infrastructure-sharing frameworks lower duplicate capex, while public-private partnerships finance cross-border fiber routes vital for low-latency services such as connected freight. Meanwhile, the Middle East fast-tracks smart-city visions that rely on dense small-cell grids, and African carriers tap LEO constellations to backhaul remote coverage islands. Latin America sees 5G launches in 17 countries, with carriers forming consortia to lease submarine-cable capacity and distribute it inland via microwave chains, weaving resilience into national networks.
- Market level overview
- Huawei Technologies Co.
- Ericsson AB
- Nokia Corporation
- ZTE Corporation
- NEC Corporation
- Cisco Systems
- Fujitsu Limited
- Aviat Networks
- Ceragon Networks Ltd.
- BridgeWave Communications
- ATandT Inc.
- Verizon Communications Inc.
- Ciena Corporation
- Juniper Networks
- Siklu Communication Ltd.
- Infinera Corporation
- CommScope Holding Company
- Telefonica S.A.
- Intelsat S.A.
- Parallel Wireless
Additional Benefits:
- The market estimate (ME) sheet in Excel format
- 3 months of analyst support
TABLE OF CONTENTS
1 INTRODUCTION
- 1.1 Study Assumptions and Market Definition
- 1.2 Scope of the Study
2 RESEARCH METHODOLOGY
3 EXECUTIVE SUMMARY
4 MARKET LANDSCAPE
- 4.1 Market Overview
- 4.2 Market Drivers
- 4.2.1 Growing mobile data traffic and smartphone adoption
- 4.2.2 Rapid 5G rollout driving capacity needs
- 4.2.3 Cloud-native and Open RAN architectures
- 4.2.4 Satellite LEO backhaul for rural reach
- 4.2.5 Fiber leasing by utilities and private LTE networks
- 4.3 Market Restraints
- 4.3.1 High capex for fiber and spectrum costs
- 4.3.2 Microwave spectrum licensing complexity
- 4.3.3 Ultra-low-latency synchronisation challenges
- 4.3.4 SDN backhaul cybersecurity risks
- 4.4 Value/Supply-Chain Analysis
- 4.5 Regulatory Landscape
- 4.6 Technological Outlook
- 4.7 Porter's Five Forces Analysis
- 4.7.1 Threat of New Entrants
- 4.7.2 Bargaining Power of Buyers
- 4.7.3 Bargaining Power of Suppliers
- 4.7.4 Threat of Substitutes
- 4.7.5 Intensity of Competitive Rivalry
- 4.8 Investment Analysis
- 4.9 Impact of COVID-19 on the Market
5 MARKET SIZE AND GROWTH FORECASTS (VALUE)
- 5.1 By Deployment
- 5.1.1 Wired
- 5.1.1.1 Fiber/Optical
- 5.1.1.2 Copper/DSL
- 5.1.2 Wireless
- 5.1.2.1 Microwave
- 5.1.2.2 Millimetre-Wave (E- and V-band)
- 5.1.2.3 Satellite
- 5.1.2.4 Free-Space Optics
- 5.1.1 Wired
- 5.2 By Equipment Type
- 5.2.1 Routers and Switches
- 5.2.2 Microwave Radios
- 5.2.3 Optical Transport Equipment
- 5.2.4 Small-Cell Backhaul Equipment
- 5.2.5 Others
- 5.3 By Service Type
- 5.3.1 Professional Services
- 5.3.2 Managed Services
- 5.3.3 Installation and Integration
- 5.3.4 Maintenance and Support
- 5.4 By Network Architecture
- 5.4.1 Macro-Cell Backhaul
- 5.4.2 Small-Cell Backhaul
- 5.4.3 Cloud RAN/Fronthaul
- 5.5 By End-user
- 5.5.1 Mobile Network Operators
- 5.5.2 Neutral-Host and Tower Companies
- 5.5.3 Internet Service Providers
- 5.5.4 Private Enterprises and Utilities
- 5.6 By Geography
- 5.6.1 North America
- 5.6.1.1 United States
- 5.6.1.2 Canada
- 5.6.1.3 Mexico
- 5.6.2 South America
- 5.6.2.1 Brazil
- 5.6.2.2 Argentina
- 5.6.2.3 Rest of South America
- 5.6.3 Europe
- 5.6.3.1 United Kingdom
- 5.6.3.2 Germany
- 5.6.3.3 France
- 5.6.3.4 Spain
- 5.6.3.5 Italy
- 5.6.3.6 Russia
- 5.6.3.7 Rest of Europe
- 5.6.4 Asia-Pacific
- 5.6.4.1 China
- 5.6.4.2 India
- 5.6.4.3 Japan
- 5.6.4.4 South Korea
- 5.6.4.5 Australia
- 5.6.4.6 Rest of Asia-Pacific
- 5.6.5 Middle East
- 5.6.5.1 GCC
- 5.6.5.2 Turkey
- 5.6.5.3 Rest of Middle East
- 5.6.6 Africa
- 5.6.6.1 South Africa
- 5.6.6.2 Nigeria
- 5.6.6.3 Egypt
- 5.6.6.4 Rest of Africa
- 5.6.1 North America
6 COMPETITIVE LANDSCAPE
- 6.1 Market Concentration
- 6.2 Strategic Moves
- 6.3 Market Share Analysis
- 6.4 Company Profiles (includes Global level Overview)
- 6.4.1 Market level overview
- 6.4.2 Huawei Technologies Co.
- 6.4.3 Ericsson AB
- 6.4.4 Nokia Corporation
- 6.4.5 ZTE Corporation
- 6.4.6 NEC Corporation
- 6.4.7 Cisco Systems
- 6.4.8 Fujitsu Limited
- 6.4.9 Aviat Networks
- 6.4.10 Ceragon Networks Ltd.
- 6.4.11 BridgeWave Communications
- 6.4.12 ATandT Inc.
- 6.4.13 Verizon Communications Inc.
- 6.4.14 Ciena Corporation
- 6.4.15 Juniper Networks
- 6.4.16 Siklu Communication Ltd.
- 6.4.17 Infinera Corporation
- 6.4.18 CommScope Holding Company
- 6.4.19 Telefonica S.A.
- 6.4.20 Intelsat S.A.
- 6.4.21 Parallel Wireless
7 MARKET OPPORTUNITIES AND FUTURE OUTLOOK
- 7.1 White-space and Unmet-need Assessment


