
|
시장보고서
상품코드
2122044
디지털 마케팅 소프트웨어 : 시장 점유율 분석, 업계 동향과 통계, 성장 예측(2026-2031년)Digital Marketing Software - Market Share Analysis, Industry Trends & Statistics, Growth Forecasts (2026 - 2031) |
||||||
 Mordor Intelligence
Mordor Intelligence에 의하면, 디지털 마케팅 소프트웨어 시장 규모는 2025년 1,055억 2,000만 달러에서 2026년에는 1,217억 1,000만 달러, 2031년까지 2,482억 9,000만 달러에 이를 것으로 예상되고 있어 2026-2031년 CAGR 15.33%를 기록할 전망입니다.
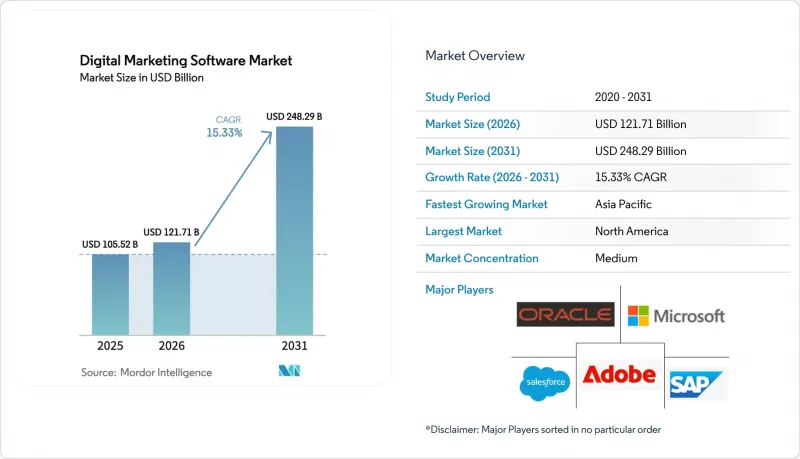
본 보고서는 도입 형태(클라우드 및 On-Premise), 구성 요소(소프트웨어 및 서비스), 최종 사용자의 기업 규모(대기업 및 중소기업), 최종 사용자의 산업 분야(IT 및 통신, 미디어 및 엔터테인먼트 등), 그리고 지역(북미, 유럽, 아시아태평양, 남미, 중동 및 아프리카)별로 분류되어 있습니다. 시장 전망은 금액(달러) 기준으로 제시되어 있습니다.
세계 디지털 마케팅 소프트웨어 시장 동향 및 인사이트
AI를 활용한 컨텐츠 및 캠페인 최적화
생성 모델을 통해 크리에이티브 제작 리드타임이 몇 주에서 몇 시간으로 단축되어, 마케터는 인력을 비례적으로 늘리지 않고도 현지화된 광고, 이메일 시퀀싱, 랜딩 페이지를 대규모로 제작할 수 있게 되었습니다. Adobe는 2025년에 Firefly 엔진을 Experience Cloud에 통합하여, 이를 조기에 도입한 기업들의 크리에이티브 비용이 20-30% 절감되었다고 보고했습니다. 세일즈포스는 Marketing Cloud 전체에 Einstein GPT를 제공하여, 소매 및 금융 서비스 고객사와의 파일럿 프로그램에서 오픈율을 15-25% 향상시켰습니다. 의류, 식료품, 가전제품 등 제품 카탈로그가 방대한 업계에서는 SKU 수가 일정 수를 초과하면 수작업으로 자산을 제작하기 어려워지기 때문에 가장 큰 혜택을 보고 있습니다. 그러나 데이터 사이언스 기술 인력은 여전히 부족하기 때문에 각 벤더사는 플랫폼 접근 권한과 AI 전략 워크숍을 패키지로 묶은 매니지드 서비스를 통해 수익화를 도모하고 있습니다. 이러한 서비스의 부가가치야말로 서비스 수익이 순수한 소프트웨어 구독보다 더 빠르게 성장하고 있는 이유를 설명해 줍니다.
제로파티 데이터와 쿠키 없는 개인화
2026년 하반기로 예정된 크롬의 쿠키 완전 폐지에 따라, 마케터들은 선호도 센터, 퀴즈, 로열티 프로그램을 통해 수집되는 자발적 데이터로 중심을 옮길 수밖에 없게 되었습니다. 세포라(Sephora)나 나이키(Nike)와 같은 소매업체들은 2025년에 선호도 센터 기능을 강화하여, 쿠키 기반 코호트에 비해 이메일 클릭률을 18-22% 향상시켰습니다. 유럽의 ‘디지털 시장법(Digital Markets Act)’ 시행에 따라 동의 문구가 표준화되었습니다. 이로 인해 규정 준수 비용은 증가했지만, 통일된 데이터 수집 흐름에 대한 법적 근거도 마련되었습니다. 동의 관리 기능을 CDP 기능과 통합한 플랫폼(OneTrust, TrustArc, Adobe, Salesforce)에서는 계약 갱신율이 향상된 반면, 네이티브 동의 관리 파이프라인이 없는 포인트 솔루션에서는 실시간 개인화를 저해하는 지연이 발생할 위험이 있습니다.
레거시 마케팅 기술(Martech) 스택과의 통합 복잡성
기업은 일반적으로 15-30종의 독립적인 마케팅 도구를 운영하고 있으며, API나 스키마의 불일치가 하나씩 늘어날 때마다 유지 관리 부담이 커집니다. 10년 전에 구축된 모놀리식 제품군에는 모듈식 및 API 우선 설계가 부족한 경우가 많아, IT 팀은 벤더의 업데이트로 인해 작동하지 않게 되는 취약한 커넥터를 만들 수밖에 없습니다. 금융 서비스 및 의료 관련 조직은 감사 추적 및 데이터 계보 추적이 모든 시스템에 걸쳐 이루어져야 하기 때문에 더 큰 난관에 직면해 있습니다. Segment나 mParticle과 같은 제공업체가 제공하는 조합 가능한 CDP 아키텍처는 표준 데이터 파이프라인으로 가는 길을 제시하고 있지만, 이미 정착된 ERP나 CRM 도입 환경이 구조적인 변화에 저항하는 경우, 그 도입은 지연되고 있습니다. 따라서 높은 통합 비용이 전환의 장벽이 되어, 기능 완성도 면에서 신규 진출기업에 뒤처지고 있음에도 불구하고 기존 벤더의 계약 갱신률을 지탱하는 요인이 되고 있습니다.
부문 분석
2025년 시점에서 클라우드 기반 서비스는 디지털 마케팅 소프트웨어 시장 점유율의 69.47%를 차지하고 있으며, 2031년까지 연평균 성장률(CAGR) 15.41%를 기록할 전망입니다. 이는 신규 구매자들이 자산을 최소화하는 것을 선호하는 경향을 뒷받침합니다. 마이크로소프트는 2025년에 ‘Dynamics 365 Marketing’의 신규 계정을 순증으로 5,000건 이상 확보했으나, 그 대부분은 On-Premise 시스템에서 이전한 것이었습니다. 데이터 상주가 의무화된 규제가 엄격한 업계에서는 On-Premise형 스택이 여전히 남아 있지만, 현재는 하이브리드 아키텍처를 통해 기밀성이 높은 식별자는 On-Premise에 보관하면서 분석이나 캠페인 실행은 클라우드로 위임하게 되어, 기존의 경계가 모호해지고 있습니다.
엣지 배포는 특히 키오스크에서의 추천이나 네트워크 왕복 지연을 허용할 수 없는 인앱 오퍼 등, 지연 시간에 민감한 개인화 시나리오에서 새로운 제3의 축을 형성하고 있습니다. 세일즈포스와 어도비는 모두 경량 고객 프로파일을 로컬에 저장하는 엣지 캐시의 시범 운영을 진행 중이며, 상호작용 현장에서 밀리초 단위의 의사 결정을 가능하게 할 것이라고 약속하고 있습니다. 도입이 확대되면, 엣지 노드에 기인하는 디지털 마케팅 소프트웨어 시장 규모는 5년 이내에 독자적인 수익원을 개척할 가능성이 있습니다.
2025년에도 소프트웨어 라이선스가 여전히 매출의 60.13%를 차지하고 있지만, 도입, 통합, 교육, 관리형 캠페인 등의 서비스 분야는 연평균 성장률(CAGR) 16.13%로 급성장하고 있습니다. 액센추어는 어도비, 세일즈포스, Oracle의 도입 수요에 부응하기 위해 2025년 한 해 동안 마케팅 기술 분야의 전문 인력을 2,000명 증원했습니다. AI를 많이 활용하는 프로젝트에서는 모델 튜닝, 특징량 엔지니어링, MLOps 감독이 기존의 설정 범위를 초과하기 때문에 높은 요금이 책정됩니다.
각 벤더사는 구독 플랜에 온보딩 및 성공 관리자를 포함시키는 사례가 늘어나고 있으며, 이를 통해 일시적인 수수료를 정기적인 서비스 수익으로 전환하고 있습니다. 이러한 방식을 통해 매월 경상 수익이 안정화되며, 단일 청구서를 희망하는 고객의 경우 조달 프로세스가 간소화됩니다. 장기적으로는 서비스가 부가된 계약이 매출 총이익률의 변동을 억제할 가능성이 있지만, 한편으로는 전 세계적인 서비스 제공 체제가 갖춰지지 않은 벤더의 경우 용량 관리 리스크를 높이는 결과로 이어질 수도 있습니다.
지역별 분석
2025년, 북미는 전 세계 매출의 35.54%를 차지했습니다. 시장이 성숙기에 접어들면서, 포춘 500대 기업 중 다수는 이미 분산되어 있던 시스템 스택을 2-3개의 핵심 플랫폼으로 합리화하고 있습니다. 현재의 성장은 AI를 활용한 자산 생성, 실시간 CDP, 여정 분석과 같은 최적화 모듈, 그리고 캐나다와 멕시코의 중견 기업 대상 확장에 중점을 두고 있습니다. 캘리포니아주의 CPRA(캘리포니아주 개인정보 보호법)에 따라 개인정보 보호 공학에 대한 고려가 최우선 과제가 되었으며, 심의 중인 ‘미국 데이터 개인정보 보호법’으로 인해 연방 정부의 감독이 강화될 가능성이 있습니다. 미국·멕시코·캐나다 간 회랑 내에서는 국경을 넘는 데이터 유통이 비교적 원활하게 유지되고 있어, 이에 따라 지역 벤더의 진출이 가속화되고 있습니다.
아시아태평양은 인도, 인도네시아, 베트남, 필리핀의 ‘모바일 퍼스트’ 상거래에 힘입어 2031년까지 연평균 성장률(CAGR) 16.27%로 확대되고 있으며, 이는 다른 어떤 지역보다 빠른 속도입니다. 스마트폰 보급률이 70%를 넘고 가처분 소득이 증가함에 따라, 광고 예산은 소셜 네트워크 경매에서 의존 리스크를 최소화하는 자사 소유의 마케팅 클라우드로 이동하고 있습니다. 중국 내에서는 PIPL(개인정보보호법)의 현지화 요건으로 인해 중국 내 벤더들이 시장을 독점하고 있지만, 일본 및 한국 기업에서는 규정 준수 대응 확장 기능을 갖춘 세계 제품군의 도입률이 높아지고 있습니다. 아세안(ASEAN)의 스타트업 기업들은 ‘성장에 따른 과금(pay-as-you-grow)’ 가격 체계를 선호하고 있으며, 이 지역은 향후 성숙한 시장에도 확산될 가능성이 있는 단계적 이용 모델의 실험장이 되고 있습니다.
2025년 지출 중 유럽이 약 28%를 차지했습니다. GDPR(EU 개인정보보호규정)(일반 데이터 보호 규정)에 따라 엄격한 동의 체계가 의무화됨에 따라, 감사 추적 및 지리적 데이터 펜스가 내장된 플랫폼에 대한 수요가 견조한 추세를 보이고 있습니다. 독일, 프랑스, 영국이 여전히 가장 큰 기여국인 반면, 북유럽 국가들은 인구 대비 AI 모듈 도입률이 두드러지게 높습니다. 남유럽 국가들은 구식 인프라와 부족한 IT 예산으로 인해 도입이 늦어지고 있지만, 관광업 및 소매업의 디지털화 프로그램 덕분에 그 격차는 점차 좁혀지고 있습니다. 중동 및 튀르키예는 각국의 다각화 계획에 따라 투자를 진행하고 있으며, 브라질은 통화 변동에도 불구하고 남미 수요를 주도하고 있습니다. 아프리카의 신흥 시장은 디지털 커머스에 참여하기 위해 모바일 머니 인프라에 의존하고 있어, 경량화되고 클라우드 네이티브인 제품군에 그린필드 시장으로서의 성장 여지를 제공합니다.
기타 혜택:
- 엑셀 형식 시장 예측(ME) 시트
- 3개월간의 애널리스트 지원
자주 묻는 질문
목차
제1장 서론
제2장 조사 방법
제3장 주요 요약
제4장 시장 구도
제5장 시장 규모와 성장 예측
제6장 경쟁 구도
제7장 시장 기회와 향후 전망
LSH 26.09.10According to Mordor Intelligence, the digital marketing software market size is expected to increase from USD 105.52 billion in 2025 to USD 121.71 billion in 2026 and reach USD 248.29 billion by 2031, growing at a CAGR of 15.33% over 2026-2031.
This report is Segmented by Deployment (Cloud, and On-Premise), Component (Software, and Services), End-User Enterprise Size (Large Enterprises, and Small and Mid-Sized Enterprises), End-User Industry (IT and Telecom, Media and Entertainment, and More), and Geography (North America, Europe, Asia Pacific, South America, Middle East, Africa). The Market Forecasts are Provided in Terms of Value (USD).
Global Digital Marketing Software Market Trends and Insights
AI-Powered Content and Campaign Optimization
Generative models are collapsing creative-production timelines from weeks to hours, letting marketers spin up localized ads, email sequences, and landing pages at scale without proportional headcount increases. Adobe embedded its Firefly engine into Experience Cloud in 2025 and reported 20-30% lower creative costs among early enterprise adopters. Salesforce exposed Einstein GPT across Marketing Cloud, boosting open rates 15-25% during pilots with retail and financial-services clients. Sectors with extensive product catalogs, including apparel, grocery, and consumer electronics, gain the most because manual asset creation breaks down past certain SKU counts. Yet data-science skills remain scarce, so vendors are monetizing managed services that package platform access with AI-strategy workshops. This services overlay explains why services revenue is rising faster than pure software subscriptions.
Zero-Party Data and Cookieless Personalization
Full Chrome cookie deprecation slated for late 2026 is forcing marketers to pivot toward volunteered data captured through preference centers, quizzes, and loyalty programs. Retailers such as Sephora and Nike deepened preference-center functionality in 2025, lifting email click-through rates 18-22% versus cookie-based cohorts. European enforcement of the Digital Markets Act standardized consent language, increasing compliance costs but also giving legal cover for uniform data-collection flows. Platforms that bundle consent orchestration with CDP capabilities (OneTrust, TrustArc, Adobe, Salesforce) see stronger renewals, while point solutions without native consent pipes risk latency that undercuts real-time personalization.
Integration Complexity with Legacy Martech Stacks
Enterprises commonly run 15-30 discrete marketing tools, and every additional API or schema mismatch compounds maintenance overhead. Monolithic suites built a decade ago often lack modular, API-first design, forcing IT teams to craft brittle connectors that break on vendor updates. Financial-services and healthcare organizations face added hurdles because audit trails and lineage tracking must span every system. Composable CDP architectures from providers such as Segment and mParticle offer a path to standard data pipes, yet uptake is slow where entrenched ERP or CRM deployments resist structural change. High integration cost therefore acts as a switching deterrent, bolstering incumbent renewal rates even when feature depth lags newer entrants.
Other drivers and restraints analyzed in the detailed report include:
- Surge in Digital-First Customer Journeys
- Embedded One-Click Marketing in Vertical SaaS Platforms
- Data-Privacy and Consent-Management Compliance Costs
For complete list of drivers and restraints, kindly check the Table Of Contents.
Segment Analysis
Cloud-based offerings accounted for 69.47% of digital marketing software market share in 2025 and are on track for a 15.41% CAGR through 2031, reinforcing the asset-light preference of new buyers. Microsoft added more than 5,000 net-new Dynamics 365 Marketing accounts during 2025, many of which were migrating from on-premise systems. On-premise stacks linger in regulated verticals that mandate data residency, but hybrid architectures now route analytics and campaign execution to the cloud while retaining sensitive identifiers on-site, blurring historical boundaries.
Edge deployments form a nascent third pillar, particularly for latency-sensitive personalization scenarios such as kiosk recommendations or in-app offers that cannot tolerate round-trip network delays. Salesforce and Adobe both pilot edge caches that store lightweight customer profiles locally, promising millisecond-level decisioning at point of interaction. If adoption broadens, the digital marketing software market size attributable to edge nodes could carve out a distinct revenue stream within five years.
Software licenses still generated 60.13% of revenue in 2025, yet services lines such as implementation, integration, training, and managed campaigns are accelerating at a 16.13% CAGR. Accenture scaled its marketing-technology workforce by 2,000 specialists during 2025 to meet demand for Adobe, Salesforce, and Oracle rollouts. AI-heavy engagements command premiums because model tuning, feature engineering, and MLOps oversight exceed traditional configuration scope.
Vendors increasingly embed onboarding and success managers inside subscription tiers, converting one-time fees into recurring services annuities. This format stabilizes monthly recurring revenue and simplifies procurement for customers that prefer a single invoice. Over time, service-attached contracts could lift gross margin volatility, though they also raise capacity-management risk for vendors that lack global delivery footprints.
Complete Report Scope:
- By Deployment
- Cloud
- On-Premise
- By Component
- Software
- Services
- By End-User Enterprise Size
- Large Enterprises
- Small and Mid-Sized Enterprises
- By End-User Industry
- IT and Telecom
- Media and Entertainment
- BFSI
- Retail and E-Commerce
- Manufacturing
- Healthcare and Life Sciences
- Other End-User Industries
- By Geography
- North America
- United States
- Canada
- Mexico
- Europe
- Germany
- United Kingdom
- France
- Italy
- Spain
- Russia
- Rest of Europe
- Asia Pacific
- China
- Japan
- India
- South Korea
- ASEAN
- Australia and New Zealand
- Rest of Asia Pacific
- South America
- Brazil
- Argentina
- Rest of South America
- Middle East
- Saudi Arabia
- UAE
- Turkey
- Rest of Middle East
- Africa
- South Africa
- Nigeria
- Rest of Africa
- North America
Geography Analysis
North America contributed 35.54% of global revenue in 2025. Market maturity means most Fortune 500 companies have already rationalized sprawling stacks into two or three core platforms. Growth now pivots on optimization modules AI asset generation, real-time CDPs, and journey analytics and on mid-market rollouts in Canada and Mexico. California's CPRA keeps privacy engineering top of mind, while the pending American Data Privacy and Protection Act may add federal oversight. Cross-border data flows remain relatively smooth inside the United States-Mexico-Canada corridor, accelerating regional vendor deployments.
Asia Pacific is expanding at a 16.27% CAGR through 2031, faster than any other region, propelled by mobile-first commerce across India, Indonesia, Vietnam, and the Philippines. Smartphone penetration above 70% and rising disposable income are steering ad budgets from social-network auctions toward owned marketing clouds that minimize dependency risk. Domestic Chinese vendors dominate inside mainland borders due to PIPL localization mandates, yet Japanese and South Korean enterprises exhibit high adoption of global suites with localized compliance extensions. ASEAN startups gravitate to pay-as-you-grow pricing, making the region a laboratory for tiered usage models that could eventually filter into mature markets.
Europe accounted for roughly 28% of 2025 spend. GDPR enforces strict consent regimes, prompting steady demand for platforms with built-in audit trails and geographic data fences. Germany, France, and the United Kingdom remain the largest contributors, while the Nordics display outsized AI module uptake relative to population. Southern European adoption trails because of legacy infrastructure and smaller IT budgets, although tourism and retail digitization programs are narrowing the gap. The Middle East and Turkey are investing under national diversification plans, and Brazil anchors South American demand despite currency volatility. Africa's nascent markets rely on mobile-money rails to join digital commerce, offering greenfield upside for light-weight, cloud-native suites.
- Adobe Inc.
- Salesforce Inc.
- Oracle Corporation
- SAP SE
- Microsoft Corporation
- Google LLC
- IBM Corporation
- HubSpot Inc.
- SAS Institute Inc.
- Teradata Corp.
- Criteo SA
- Infor Inc.
- ActiveCampaign LLC
- Klaviyo Inc.
- Intuit Inc.
- Brevo SAS
- Zoho Corporation
- Constant Contact
- Sitecore
- Acoustic, L.P.
- Insider Inc.
- Sprinklr
- Braze Inc.
- Shopify Inc.
- Hootsuite Inc.
- Block, Inc.
- GoDaddy Inc.
Additional Benefits:
- The market estimate (ME) sheet in Excel format
- 3 months of analyst support
TABLE OF CONTENTS
1 INTRODUCTION
- 1.1 Study Assumptions and Market Definition
- 1.2 Scope of the Study
2 RESEARCH METHODOLOGY
3 EXECUTIVE SUMMARY
4 MARKET LANDSCAPE
- 4.1 Market Overview
- 4.2 Market Drivers
- 4.2.1 Surge in Digital-First Customer Journeys
- 4.2.2 Cloud-Native SaaS Cost Advantages
- 4.2.3 AI-Powered Content and Campaign Optimization
- 4.2.4 Omnichannel Engagement Demand from B2C and B2B
- 4.2.5 Zero-Party Data and Cookieless Personalization
- 4.2.6 Embedded "One-Click" Marketing in Vertical SaaS and Payments Platforms
- 4.3 Market Restraints
- 4.3.1 Integration Complexity with Legacy Martech Stacks
- 4.3.2 Data-Privacy and Consent-Management Compliance Costs
- 4.3.3 Rising Unit Prices for First-Party Data Enrichment
- 4.3.4 CX Talent Shortage for AI-Led Campaign Design
- 4.4 Industry Value Chain Analysis
- 4.5 Regulatory Landscape
- 4.6 Technological Outlook
- 4.7 Impact of Macroeconomic Factors on the Market
- 4.8 Porter's Five Forces Analysis
- 4.8.1 Threat of New Entrants
- 4.8.2 Bargaining Power of Buyers
- 4.8.3 Bargaining Power of Suppliers
- 4.8.4 Threat of Substitute Products
- 4.8.5 Intensity of Competitive Rivalry
5 MARKET SIZE AND GROWTH FORECASTS (VALUE)
- 5.1 By Deployment
- 5.1.1 Cloud
- 5.1.2 On-Premise
- 5.2 By Component
- 5.2.1 Software
- 5.2.2 Services
- 5.3 By End-User Enterprise Size
- 5.3.1 Large Enterprises
- 5.3.2 Small and Mid-Sized Enterprises
- 5.4 By End-User Industry
- 5.4.1 IT and Telecom
- 5.4.2 Media and Entertainment
- 5.4.3 BFSI
- 5.4.4 Retail and E-Commerce
- 5.4.5 Manufacturing
- 5.4.6 Healthcare and Life Sciences
- 5.4.7 Other End-User Industries
- 5.5 By Geography
- 5.5.1 North America
- 5.5.1.1 United States
- 5.5.1.2 Canada
- 5.5.1.3 Mexico
- 5.5.2 Europe
- 5.5.2.1 Germany
- 5.5.2.2 United Kingdom
- 5.5.2.3 France
- 5.5.2.4 Italy
- 5.5.2.5 Spain
- 5.5.2.6 Russia
- 5.5.2.7 Rest of Europe
- 5.5.3 Asia Pacific
- 5.5.3.1 China
- 5.5.3.2 Japan
- 5.5.3.3 India
- 5.5.3.4 South Korea
- 5.5.3.5 ASEAN
- 5.5.3.6 Australia and New Zealand
- 5.5.3.7 Rest of Asia Pacific
- 5.5.4 South America
- 5.5.4.1 Brazil
- 5.5.4.2 Argentina
- 5.5.4.3 Rest of South America
- 5.5.5 Middle East
- 5.5.5.1 Saudi Arabia
- 5.5.5.2 UAE
- 5.5.5.3 Turkey
- 5.5.5.4 Rest of Middle East
- 5.5.6 Africa
- 5.5.6.1 South Africa
- 5.5.6.2 Nigeria
- 5.5.6.3 Rest of Africa
- 5.5.1 North America
6 COMPETITIVE LANDSCAPE
- 6.1 Market Concentration
- 6.2 Strategic Moves
- 6.3 Market Share Analysis
- 6.4 Company Profiles (includes Global Level Overview, Market Level Overview, Core Segments, Financials as available, Strategic Information, Market Rank/Share for Key Companies, Products and Services, and Recent Developments)
- 6.4.1 Adobe Inc.
- 6.4.2 Salesforce Inc.
- 6.4.3 Oracle Corporation
- 6.4.4 SAP SE
- 6.4.5 Microsoft Corporation
- 6.4.6 Google LLC
- 6.4.7 IBM Corporation
- 6.4.8 HubSpot Inc.
- 6.4.9 SAS Institute Inc.
- 6.4.10 Teradata Corp.
- 6.4.11 Criteo SA
- 6.4.12 Infor Inc.
- 6.4.13 ActiveCampaign LLC
- 6.4.14 Klaviyo Inc.
- 6.4.15 Intuit Inc.
- 6.4.16 Brevo SAS
- 6.4.17 Zoho Corporation
- 6.4.18 Constant Contact
- 6.4.19 Sitecore
- 6.4.20 Acoustic, L.P.
- 6.4.21 Insider Inc.
- 6.4.22 Sprinklr
- 6.4.23 Braze Inc.
- 6.4.24 Shopify Inc.
- 6.4.25 Hootsuite Inc.
- 6.4.26 Block, Inc.
- 6.4.27 GoDaddy Inc.
7 MARKET OPPORTUNITIES AND FUTURE OUTLOOK
- 7.1 White-Space and Unmet-Need Assessment