

|
시장보고서
상품코드
2122180
스마트 가스 미터 : 시장 점유율 분석, 업계 동향과 통계, 성장 예측(2026-2031년)Smart Gas Meter - Market Share Analysis, Industry Trends & Statistics, Growth Forecasts (2026 - 2031) |
||||||
 Mordor Intelligence
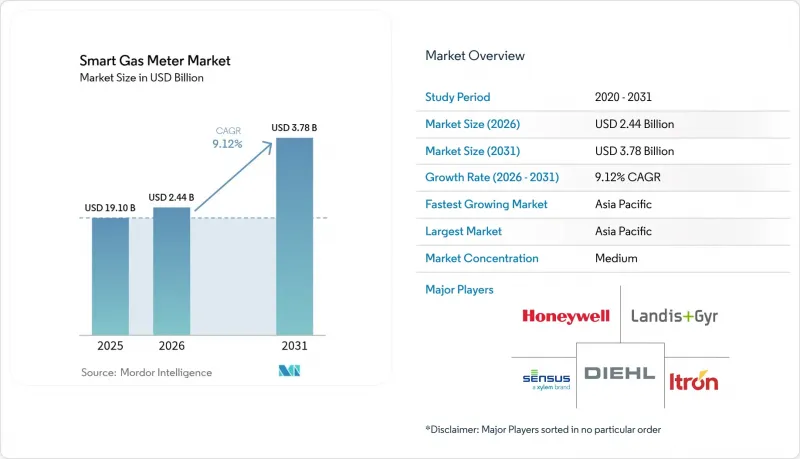
Mordor Intelligence에 따르면 스마트 가스 미터 시장 규모는 2025년에 22억 4,000만 달러로 평가되며, 2026년 24억 4,000만 달러에서 2031년까지 37억 8,000만 달러에 달할 것으로 예측되고 있으며, 예측 기간(2026-2031년)에 CAGR은 9.12%에 달할 전망입니다.
이 보고서는 계량기 유형(다이어프램식, 초음파식, 터빈식, 로터리 피스톤식, MEMS/솔리드 스테이트식), 통신 기술(RF, PLC,GSM/GPRS, NB-IoT/LTE-M, LoRaWAN), 배포 모델(AMR, AMI), 최종사용자(주거용, 상업용, 산업용) 및 지역별로 분류되어 있습니다. 시장 예측은 금액(달러) 및 수량(출하 대수)으로 제시되어 있습니다.
글로벌 스마트 가스 계량기 시장 동향 및 인사이트
규제에 따른 의무화 및 대규모 도입
각국 정부는 자발적 도입 단계를 넘어, 내부 ROI(투자 수익률)상 과제와 관계없이 유틸리티에게 조치를 취하도록 하는 엄격한 기한을 설정하고 있습니다. 호주 에너지 시장 위원회는 2030년까지 주거용 스마트 가스 계량기의 전면 도입을 의무화하고 있는 반면, 독일에서는 2025년 이후 모든 신규 히트펌프 설치시 계량기 설치를 의무화하고 있습니다. 유럽연합(EU)이 배전망내 수소 혼합 비율을 최대 2%까지 허용함에 따라 기존의 다이어프램식 계량기만으로는 정확도 기준을 충족할 수 없어 규정 준수와 관련된 새로운 요건이 추가되었습니다. 2025-2028년에 시행될 FortisBC의 110만 대 계량기 교체 사업은 규제가 어떻게 자발적인 투자를 의무적인 조달로 전환시키는지를 보여줍니다. 정책 입안자들이 도입 승인을 데이터 보호 기준과 연계하고 있으므로 사이버 보안 및 상호 운용성 인증을 취득한 공급업체가 우선적으로 선정됩니다.
유틸리티의 운영 비용 절감 및 청구 정확도 향상
인건비 상승과 수동 검침으로 인한 지연에 시달리는 유틸리티는 현장 방문 횟수를 80-90% 줄이면서도 청구 정확도를 95%에서 99.5%로 높일 수 있습니다. 내셔널 그리드(National Grid)사의 전력·가스 통합 도입 사례는 지속적인 데이터 스트림을 통해 시간대별 요금제가 가능해져 수요를 분산시키고, 고비용의 피크 용량 확충을 미룰 수 있음을 보여줍니다. 누출 감지 분석을 통해 원인을 알 수 없는 가스 손실을 줄이고 안전 사고를 경감할 수 있으므로, 15년 동안의 계량기 수명에 걸친 운영 비용(OPEX) 절감 효과가 더욱 커집니다. 이러한 경제적 이점이 있으므로 직접적인 의무 규정이 없는 관할 구역이라 하더라도 도입을 가속화할 정당한 이유가 됩니다.
높은 설비 투자(CAPEX)와 느린 투자 회수(ROI)
스마트 계량기의 단가는 대당 150-300달러인 반면, 기계식 계량기는 30-50달러입니다. 통신 백홀, 헤드엔드 소프트웨어, 사이버 보안 업그레이드를 포함하면 전면 도입 비용은 2배로 늘어날 가능성이 있습니다. 투자 회수 기간은 7-12년에 달하며, 이는 보다 신속한 투자 주기를 선호하는 유틸리티의 의향과 상충됩니다. 신흥 시장의 경우, 환율 변동이나 우대 대출 제한으로 인해 특히 고객 수가 10만 명 미만인 소규모 지방 자치단체 유틸리티에게는 도입 비용 부담이 더욱 커집니다.
부문 분석
2025년 스마트 가스 계량기 시장 규모 중 다이어프램식 장치가 41.75%를 차지했습니다. 이는 비용 측면과 기존 도입 실적을 바탕으로 한 기존 우위성 때문입니다. 초음파식 계량기는 가격이 비싸고, 수소 혼합이나 멀티가스 이용 시나리오에서 더 높은 정확도가 요구되므로 연평균 성장률(CAGR) 12.1%로 성장할 것으로 예측됩니다.
이러한 전환 추세는 규제 당국이 수소 대응 규격에서 초음파식 계량기의 성능을 기준으로 삼고 있는 유럽과 일본에서 가장 두드러집니다. 가스 사업자들은 수소 비율이 상승할 경우 발생하는 ‘좌초 비용’을 피하기 위해 장래성이 있는 자산을 선호하고 있습니다. 이트론(Eatron)사는 100만 대 이상의 초음파식 계량기를 출하하여 규모의 경제성과 신뢰성 향상을 입증했습니다. 터빈식 및 로터리 피스톤식 계량기는 대유량의 산업용 틈새 시장에서 여전히 중요한 역할을 하고 있지만, MEMS 기반 솔리드 스테이트 센서는 온도 드리프트에 대한 우려로 인해 제약을 받고 있으며, 여전히 초기 단계에 머물러 있습니다. 생산 확대에 따라 초음파식 계량기의 정가는 2023년 이후 18% 하락했으며, 가격 차이가 줄어들면서 스마트 가스 계량기 시장의 교체 주기가 가속화되고 있습니다.
유럽에서 169 MHz, 902-928 MHz 대역에서 작동하는 RF 솔루션은 2025년 스마트 가스 계량기 시장의 38.10% 점유율을 차지했습니다. 그러나 NB-IoT/LTE-M은 연평균 성장률(CAGR) 10.72%로 성장하고 있으며, 공공 서비스 사업자들이 전국 규모의 이동통신 네트워크 구축에 편승함으로써 시장 점유율을 확대하고 있습니다.
셀룰러 모듈은 무선 펌웨어 업데이트(FOTA), 캐리어급 보안, 그리고 실내 깊숙한 곳까지의 침투력을 제공합니다. 중국과 이탈리아에서는 국내 통신 사업자가 공공사업자에게 할인된 NB-IoT 요금제를 제공하여, 연결 관련 운영 비용(OPEX)을 대폭 절감하고 있습니다. RF는 앨버타주의 유전이나 인도네시아의 농촌 지역 등, 공공사업자가 네트워크 소유권을 원하는 지역이나 셀룰러 통신 범위가 불충분한 지역에서 여전히 경쟁력을 유지하고 있습니다. PLC는 주로 유럽의 공동 주택 등 전력선 인프라가 이미 구축된 틈새 시장에서 여전히 입지를 유지하고 있습니다. LoRaWAN은 장거리 및 저비트레이트 연결이 필요한 인구 밀도가 낮은 지역에서 활용되고 있습니다. 예측 기간 중, 스마트 가스 계량기 시장의 신뢰성을 극대화하기 위해 RF 메쉬 백홀과 NB-IoT 엣지 중복성을 결합한 하이브리드 아키텍처가 등장하고 있습니다.
지역별 분석
아시아태평양은 2025년에 41.65%의 점유율로 스마트 가스 계량기 시장을 독점하고 있으며, 2031년까지 연평균 성장률(CAGR) 15.2%로 확대되고 있습니다. 중국의 성(省) 차원 스마트 시티 예산에서는 가스 계량기 도입이 우선 과제로 자리 잡고 있는 반면, 일본의 넷 제로 로드맵에 따라 공공 사업자들은 수소 대응 기기로의 업그레이드를 서둘러야 하는 상황에 놓여 있습니다. 현지 제조 생태계 덕분에 수입품에 비해 하드웨어 비용이 12-18% 절감되어 프로젝트의 내부수익률(IRR) 산정이 개선되고 있습니다. 오사카 가스 네트워크가 모바일 IoT 관리에 MEEQ SIM을 채택한 것은 네트워크 혁신 분야에서 이 지역의 리더십을 상징합니다.
북미는 여전히 세계 2위의 스마트 가스 계량기 시장이며, 체계적인 교체 프로그램과 사이버 보안 규제에 의해 시장이 형성되고 있습니다. FortisBC가 2025-2028년에 시행할 110만 대 도입 계획은 이 지역의 꾸준한 전환 속도를 여실히 보여줍니다. 2025년에 발효되는 FERC의 사이버 보안 기준으로 인해 인증 장벽이 높아져, 검증된 암호화 스택을 보유한 확고한 입지를 가진 공급업체가 유리해질 것입니다. 또한 미국의 ‘인플레이션 억제법’에 따른 메탄 누출 감축 인센티브도 AMI 도입의 경제적 근거를 더욱 공고히 하고 있습니다.
유럽에서는 지정학적 혼란으로 인한 수소 혼합 및 에너지 안보의 필요성으로 인해 견고한 성장이 예상됩니다. 독일의 2025년 히트펌프 규제와 영국의 100% 수소 대응 네트워크 추진이 조달량을 지원하고 있습니다. EU의 ‘복원력·회복 지원 기금(Resilience and Recovery Facility)’에 기반한 보조금 제도는 소규모 배전 사업자(DSO)가 AMI 업그레이드 자금을 조달할 수 있도록 지원하는 한편, 개인정보 보호 및 상호운용성 기준이 공급업체의 책임을 보장하고 있습니다.
중동 및 아프리카는 규모는 작지만, 각국 정부가 5.5G 연결을 기반으로 한 스마트 시티 프로젝트를 전개하고 있으며, 평균을 상회하는 성장률을 보이고 있습니다. 사우디아라비아의 ‘NEOM’과 아랍에미리트의 ‘마스다르 시티’에서는 마스터 플랜에 NB-IoT 방식의 스마트 계량 시스템이 명시되어 있습니다. 환율 변동이나 기술 인력 부족과 같은 과제가 있지만, 세계은행의 ‘EDGE 구상’와 같은 다자간 기관들이 양허성 대출을 통해 지원에 나서며 도입 곡선을 완만하게 만들고 있습니다.
기타 혜택:
- 엑셀 형식의 시장 예측(ME) 시트
- 3개월간의 애널리스트 지원
자주 묻는 질문
목차
제1장 서론
제2장 조사 방법
제3장 개요
제4장 시장 구도
제5장 시장 규모와 성장 예측
제6장 경쟁 구도
제7장 시장 기회와 향후 전망
KSA 26.09.04According to Mordor Intelligence, the smart gas meter market size was valued at USD 2.24 billion in 2025 and estimated to grow from USD 2.44 billion in 2026 to reach USD 3.78 billion by 2031, at a CAGR of 9.12% during the forecast period (2026-2031).
This report is Segmented by Meter Type (Diaphragm, Ultrasonic, Turbine, Rotary Piston, MEMS/Solid-state), Communication Technology (RF, PLC, GSM/GPRS, NB-IoT/LTE-M, Lorawan), Deployment Model (AMR, AMI), End-User (Residential, Commercial, Industrial), and Geography. The Market Forecasts are Provided in Terms of Value (USD) and Volume (Shipments).
Global Smart Gas Meter Market Trends and Insights
Regulatory Mandates and Mass Roll-outs
Governments have moved beyond voluntary adoption by setting hard deadlines that force utilities to act regardless of internal ROI hurdles. Australia's Energy Market Commission requires full residential smart gas coverage by 2030, while Germany mandates meters on all new heat-pump installations from 2025. The European Union's allowance of up to 2% hydrogen in distribution networks adds a compliance layer because legacy diaphragm devices cannot meet accuracy thresholds. FortisBC's 1.1 million-unit exchange running 2025-2028 illustrates how regulations convert discretionary investment into obligatory procurement. Vendors with certified cybersecurity and interoperability credentials are preferred as policymakers tie rollout approvals to data-protection standards.
Utility OPEX Reduction and Billing Accuracy
Utilities battling labor inflation and manual-reading delays can cut 80-90% of truck rolls while bumping billing accuracy from 95% to 99.5% . National Grid's combined electric-gas deployment shows that continuous data streams unlock time-of-use tariffs that shift demand and defer expensive peak-capacity upgrades. Leak-detection analytics reduce unaccounted-for gas losses and mitigate safety incidents, magnifying lifetime OPEX savings over 15-year meter lifecycles. These economic paybacks justify accelerated rollouts even in jurisdictions lacking direct mandates.
High CAPEX and Slow ROI
Smart meters cost USD 150-300 each versus USD 30-50 for mechanical units. When communications backhaul, head-end software, and cybersecurity upgrades are included, full-deployment costs can double. Payback periods stretch to 7-12 years, clashing with utilities' preference for quicker investment cycles. In emerging markets, foreign-exchange volatility and limited concessional funding widen the affordability gap, especially for small municipal utilities with sub-100,000 customer bases.
Other drivers and restraints analyzed in the detailed report include:
- Rising Downstream Natural-Gas Demand
- NB-IoT and LPWAN Boosting Battery Life and Coverage
- Cybersecurity and Data Privacy Risks
For complete list of drivers and restraints, kindly check the Table Of Contents.
Segment Analysis
Diaphragm devices accounted for 41.75% of the smart gas meters market size in 2025, a legacy advantage built on cost and incumbent installed base. Ultrasonic meters, though pricier, are projected to grow at a 12.1% CAGR as hydrogen blending and multi-gas scenarios demand higher accuracy bands.
The migration is most visible in Europe and Japan, where regulators reference ultrasonic performance in hydrogen-ready standards. Utilities prefer future-proof assets to avoid stranded costs should hydrogen ratios rise. Itron has shipped more than 1 million ultrasonic units, confirming scale economics and reliability gains. Turbine and rotary piston meters stay relevant in high-flow industrial niches, while MEMS-based solid-state sensors remain early-stage, constrained by temperature-drift concerns. With expanded production, ultrasonic list prices have fallen 18% since 2023, narrowing the gap and accelerating replacement cycles within the smart gas meters market.
RF solutions operating at 169 MHz in Europe and 902-928 MHz held 38.10% of the smart gas meters market share in 2025. However, NB-IoT/LTE-M is advancing at a 10.72% CAGR, taking share as utilities piggyback on nationwide cellular rollouts.
Cellular modules provide firmware-over-the-air, carrier-grade security, and deep indoor penetration. In China and Italy, national operators offer discounted NB-IoT tariffs to utilities, slashing connectivity OPEX. RF remains competitive in territories where utilities desire network ownership or cellular coverage is patchy, such as Alberta oil fields or rural Indonesia. PLC retains a niche where power-line infrastructure already exists, chiefly in European apartment blocks. LoRaWAN serves sparsely populated districts needing long-range, low-bit-rate connectivity. Over the forecast period, hybrid architectures combining RF mesh backhaul with NB-IoT edge redundancy are emerging to maximize reliability within the smart gas meters market.
Complete Report Scope:
- By Meter Type
- Diaphragm
- Ultrasonic
- Turbine
- Rotary Piston
- MEMS/Solid-state
- By Communication Technology
- RF (169/868 MHz)
- PLC
- GSM/GPRS
- NB-IoT/LTE-M
- LoRaWAN
- By Deployment Model
- Automatic Meter Reading (AMR)
- Advanced Metering Infrastructure (AMI)
- By End-user
- Residential
- Commercial
- Industrial
- By Geography
- North America
- United States
- Canada
- Mexico
- South America
- Brazil
- Argentina
- Rest of South America
- Europe
- Germany
- United Kingdom
- France
- Italy
- Spain
- Russia
- Rest of Europe
- Asia Pacific
- China
- Japan
- South Korea
- India
- Australia and New Zealand
- Rest of Asia Pacific
- Middle East
- Saudi Arabia
- United Arab Emirates
- Turkey
- Rest of the Middle East
- Africa
- South Africa
- Nigeria
- Rest of Africa
- North America
Geography Analysis
Asia Pacific dominated the smart gas meters market with a 41.65% share in 2025 and is advancing at a 15.2% CAGR through 2031. China's province-level smart-city budgets earmark gas metering as a priority, while Japan's net-zero roadmap forces utilities to upgrade to hydrogen-compatible devices. Local manufacturing ecosystems lower hardware costs by 12-18% versus imports, improving project IRR calculations. Osaka Gas Network's adoption of MEEQ SIM for mobile IoT management exemplifies the region's leadership in network innovation.
North America remains the second-largest smart gas meters market, shaped by structured replacement programs and cybersecurity regulation. FortisBC's 1.1 million-meter rollout running 2025-2028 illustrates the region's steady conversion pace. FERC cybersecurity standards, effective in 2025, elevate certification barriers, favoring established vendors with validated encryption stacks. The US Inflation Reduction Act's incentives for methane-leak reduction also sharpen the economic case for AMI adoption.
Europe shows robust growth driven by hydrogen blending and energy-security imperatives following geopolitical disruptions. Germany's 2025 heat-pump rule and the UK's push for 100% hydrogen-ready networks sustain procurement volume. Subsidy schemes under the EU Resilience and Recovery Facility help smaller DSOs finance AMI upgrades, while privacy and interoperability standards maintain vendor accountability.
The Middle East and Africa, though smaller, post above-average growth as governments deploy smart-city projects tied to 5.5G connectivity. Saudi Arabia's NEOM and the United Arab Emirates' Masdar City specify NB-IoT smart metering within master plans. Currency volatility and technical-skill shortages present challenges; however, multilaterals such as the World Bank's EDGE initiative are stepping in with concessional loans, smoothing adoption curves.
- Landis+Gyr Group AG
- Itron Inc.
- Honeywell International Inc.
- Sensus (Xylem Inc.)
- Diehl Stiftung and Co. KG
- Wasion Group Holdings Limited
- Azbil Kimmon Co. Ltd.
- Apator S.A.
- Zenner International GmbH
- Pietro Fiorentini S.p.A
- AEM Limited
- Holley Technology Ltd.
- Secure Meters Ltd.
- Chongqing Shancheng Gas Equipment Co., Ltd.
- Flonidan A/S
- SICK AG
Additional Benefits:
- The market estimate (ME) sheet in Excel format
- 3 months of analyst support
TABLE OF CONTENTS
1 INTRODUCTION
- 1.1 Study Assumptions and Market Definition
- 1.2 Scope of the Study
2 RESEARCH METHODOLOGY
3 EXECUTIVE SUMMARY
4 MARKET LANDSCAPE
- 4.1 Market Overview
- 4.2 Market Drivers
- 4.2.1 Regulatory mandates and mass roll-outs
- 4.2.2 Utility OPEX reduction and billing accuracy
- 4.2.3 Rising downstream natural-gas demand
- 4.2.4 NB-IoT and LPWAN boosting battery life and coverage
- 4.2.5 Mandatory replacement of ageing diaphragm meters
- 4.2.6 Safety-centric shift to ultrasonic meters w/ shut-off
- 4.3 Market Restraints
- 4.3.1 High CAPEX and slow ROI
- 4.3.2 Cybersecurity and data privacy risks
- 4.3.3 Semiconductor and battery supply constraints
- 4.3.4 Interoperability gaps in mixed-fleet retrofits
- 4.4 Value Chain Analysis
- 4.5 Regulatory Landscape
- 4.6 Natural-Gas Consumption Statistics
- 4.7 Porter's Five Forces Analysis
- 4.7.1 Bargaining Power of Suppliers
- 4.7.2 Bargaining Power of Buyers
- 4.7.3 Threat of New Entrants
- 4.7.4 Threat of Substitutes
- 4.7.5 Intensity of Rivalry
- 4.8 An Assessment of Macroeconomic Impact on the Market
5 MARKET SIZE AND GROWTH FORECASTS (VALUE AND VOLUME)
- 5.1 By Meter Type
- 5.1.1 Diaphragm
- 5.1.2 Ultrasonic
- 5.1.3 Turbine
- 5.1.4 Rotary Piston
- 5.1.5 MEMS/Solid-state
- 5.2 By Communication Technology
- 5.2.1 RF (169/868 MHz)
- 5.2.2 PLC
- 5.2.3 GSM/GPRS
- 5.2.4 NB-IoT/LTE-M
- 5.2.5 LoRaWAN
- 5.3 By Deployment Model
- 5.3.1 Automatic Meter Reading (AMR)
- 5.3.2 Advanced Metering Infrastructure (AMI)
- 5.4 By End-user
- 5.4.1 Residential
- 5.4.2 Commercial
- 5.4.3 Industrial
- 5.5 By Geography
- 5.5.1 North America
- 5.5.1.1 United States
- 5.5.1.2 Canada
- 5.5.1.3 Mexico
- 5.5.2 South America
- 5.5.2.1 Brazil
- 5.5.2.2 Argentina
- 5.5.2.3 Rest of South America
- 5.5.3 Europe
- 5.5.3.1 Germany
- 5.5.3.2 United Kingdom
- 5.5.3.3 France
- 5.5.3.4 Italy
- 5.5.3.5 Spain
- 5.5.3.6 Russia
- 5.5.3.7 Rest of Europe
- 5.5.4 Asia Pacific
- 5.5.4.1 China
- 5.5.4.2 Japan
- 5.5.4.3 South Korea
- 5.5.4.4 India
- 5.5.4.5 Australia and New Zealand
- 5.5.4.6 Rest of Asia Pacific
- 5.5.5 Middle East
- 5.5.5.1 Saudi Arabia
- 5.5.5.2 United Arab Emirates
- 5.5.5.3 Turkey
- 5.5.5.4 Rest of the Middle East
- 5.5.6 Africa
- 5.5.6.1 South Africa
- 5.5.6.2 Nigeria
- 5.5.6.3 Rest of Africa
- 5.5.1 North America
6 COMPETITIVE LANDSCAPE
- 6.1 Market Concentration
- 6.2 Strategic Moves
- 6.3 Market Share Analysis
- 6.4 Company Profiles (includes Global level Overview, Market level overview, Core Segments, Financials as available, Strategic Information, Market Rank/Share, Products and Services, Recent Developments)
- 6.4.1 Landis+Gyr Group AG
- 6.4.2 Itron Inc.
- 6.4.3 Honeywell International Inc.
- 6.4.4 Sensus (Xylem Inc.)
- 6.4.5 Diehl Stiftung and Co. KG
- 6.4.6 Wasion Group Holdings Limited
- 6.4.7 Azbil Kimmon Co. Ltd.
- 6.4.8 Apator S.A.
- 6.4.9 Zenner International GmbH
- 6.4.10 Pietro Fiorentini S.p.A
- 6.4.11 AEM Limited
- 6.4.12 Holley Technology Ltd.
- 6.4.13 Secure Meters Ltd.
- 6.4.14 Chongqing Shancheng Gas Equipment Co., Ltd.
- 6.4.15 Flonidan A/S
- 6.4.16 SICK AG
7 MARKET OPPORTUNITIES AND FUTURE OUTLOOK
- 7.1 White-space and Unmet-need Assessment


