
|
시장보고서
상품코드
2122196
광전송 네트워크 : 시장 점유율 분석, 업계 동향과 통계, 성장 예측(2026-2031년)Optical Transport Network - Market Share Analysis, Industry Trends & Statistics, Growth Forecasts (2026 - 2031) |
||||||
 Mordor Intelligence
Mordor Intelligence에 따르면 광전송 네트워크 시장 규모는 2026년에 293억 9,000만 달러에 달하며, 2031년까지 440억 3,000만 달러에 달할 것으로 예측되고 있으며, CAGR은 8.42%로 추이할 전망입니다.
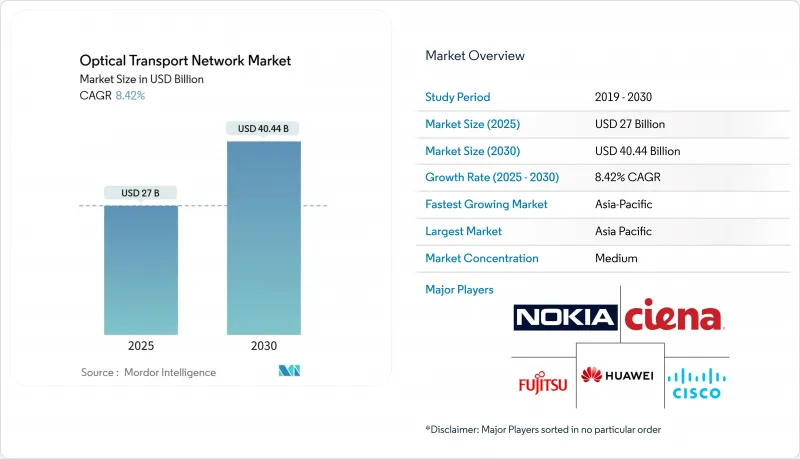
이 보고서는 기술별(WDM, DWDM 등), 제공 형태별(서비스, 구성 요소), 최종사용자 산업별(IT·통신 사업자, 의료 등), 용도별(데이터센터 간 연결, 메트로 네트워크, 기업내 네트워크 등),데이터 전송 속도/파장(100-400 Gbit/s, 400-800 Gbit/s, 800 Gbit/s 초과) 및 지역별로 분류되어 있습니다. 시장 예측은 금액(달러) 기준으로 제시되어 있습니다.
전 세계 광전송 네트워크 시장의 동향 및 인사이트
데이터센터 간 연결 분야에서 400 ZR/ZR+의 급속한 보급
마이크로소프트의 Azure 네트워크에서는 2025년에 도입된 400ZR 모듈이 5만 개를 돌파했습니다. 이는 코히어런트 플러그어블이 기존의 DWDM 셸프에 비해 설치 면적을 40%, 전력 소비를 30% 절감할 수 있음을 입증하는 것입니다. 현재 범용 반도체 공급업체들은 기존 광통신 벤더를 거치지 않고 하이퍼스케일러에 직접 모듈을 판매하고 있으며, 조달 모델의 변혁이 진행되고 있습니다. Ciena사는 2025 회계연도에 WaveLogic 매출에서 플러그어블 제품이 차지하는 비중이 전년도 11%에서 22%로 증가했다고 밝혔습니다. 각 하이퍼스케일러 기업이 80-120km 메트로 DCI 링크를 위해 400ZR/400ZR+를 표준화해 나감에 따라 광전송 네트워크 시장은 통신 사업자의 지출 주기성을 상쇄하는 지속적인 수요의 견인 역할을 하게 될 것입니다.
하이퍼스케일러의 AI 클러스터 트래픽 급증
생성형 AI 훈련에는 2만 5,000대의 GPU 클러스터를 400 Gbit/s로 상호 연결하는 데 충분한 대역폭이 필요하며, 이것이 전례 없는 DCI 투자 물결을 이끌고 있습니다. Amazon Web Services, Microsoft Azure, Google Cloud, Meta는 2026년 설비 투자로 총 4,000억 달러를 계상하고 있으며, 그 중 약 35%가 네트워크 인프라에 할당되어 있습니다. 800 Gbit/s 디바이스의 트랜시버 리드타임은 52주에 달하며, 자체 포토닉스 제조 공장을 보유한 벤더가 유리한 입지에 있습니다. IP-over-DWDM 아키텍처로의 전환으로 인해 코히어런트 광학 부품을 내장한 라우터가 OTN 스위칭을 우회할 수 있게 되어 비용 절감으로 이어지는 한편, 통신 사업자의 서비스 계층에서의 수익은 감소하게 됩니다.
2급 통신 사업자의 설비 투자 동결(2024-2025년)
도이치 통신은 독일내 고정 통신망에 대한 투자를 전년 대비 8% 삭감했습니다. 한편, 아메리카 모빌은 금리 부담 증가에 따라 브라질 및 콜롬비아에서의 2025년 설비 투자 전망치를 12% 하향 조정했습니다. 투자 연기는 ADVA와 같은 지역 벤더들에게 타격을 주고 있지만, 주요 공급업체들은 하이퍼스케일러 대상 판매를 통해 그 부족분을 부분적으로 메우고 있습니다. 애널리스트들은 2027년 이후 5G 백홀 수요와 보조금 프로그램을 통해 업그레이드가 다시 활성화되면 회복될 것으로 전망하고 있습니다.
부문 분석
2025년, DWDM 시스템은 광전송 네트워크 시장에서 49.72%의 점유율을 차지하며, 스펙트럼 효율이 경제성을 좌우하는 장거리 및 해저 회선 분야에서 그 우위를 부각시켰습니다. 노키아의 PSE-6s 플랫폼은 코히어런트 플러그형 장치가 메트로 액세스 회선에도 활용될 수 있게 되어, DWDM의 성능과 WDM의 간편성을 융합하고 있음을 보여줍니다. 메트로 사업자들이 저비용 5G 백홀 아키텍처를 채택함에 따라 WDM 솔루션은 연평균 성장률(CAGR) 9.11%를 기록할 전망입니다. 그 결과, 상용 실리콘 벤더들은 이러한 융합을 통해 가치를 창출하며 경쟁 구도를 재편하고 있습니다.
기존 O-밴드 기술은 캠퍼스 간 연결에서는 여전히 틈새 시장으로 남아 있지만, 용도에 따른 세분화를 부각시키고 있습니다. Ciena는 2025 회계연도에 WaveLogic의 매출이 18% 증가한 반면, 기존 OTN 스위칭 매출은 3% 감소했다고 보고했으며, 이는 사내 가치의 이동을 시사합니다. 코히어런트 플러그어블 기술이 성숙해짐에 따라 DWDM의 경제성은 에지 노드로 확대되어, 연구개발(R&D) 역량이 부족한 중소 공급업체에 압박을 가하고 있습니다. 따라서 광전송 네트워크 시장은 기술 선택의 폭이 넓어지는 한편, 업계 재편에 직면해 있습니다.
2025년 매출 중 부품이 58.44%를 차지하고 있으며, 이는 광전송 장비의 도입 대수가 방대함을 반영합니다. 그러나 연평균 성장률(CAGR) 8.89%의 성장이 예상되는 서비스 분야에서는 오픈 라인 시스템의 복잡성을 활용한 수익화가 점점 더 진전되고 있습니다. 시스코는 광 서비스의 매출총이익률이 68%로 밝혔는데, 이는 하드웨어의 이익률을 훨씬 상회하는 수치로, 지속적인 수익 창출을 위한 전략적 전환을 강조하는 것입니다.
통신 사업자들이 멀티 벤더 통합 및 용량 계획을 외부에 위탁함에 따라 광 전송 네트워크 서비스 시장은 확대될 전망입니다. 인피넬라(Infinera)의 GX G42와 같은 소형 모듈형 플랫폼은 스위칭과 전송을 융합하여 설치 면적을 줄이는 동시에, 단순한 하드웨어 업데이트보다 수명주기 지원에 대한 수요를 촉진하고 있습니다. AI를 활용한 진단 기능으로 인해 일부 유지보수 수익이 감소할 가능성은 있지만, 각 벤더들은 지원 계약에 트래픽 최적화 분석 기능을 추가함으로써 이를 상쇄하고 있습니다.
지역별 분석
아시아태평양은 2025년 매출의 35.67%를 차지했습니다. 이는 중국의 백본 회선 업그레이드와 인도의 ‘BharatNet 3단계’(농촌 지역에 광섬유망을 구축하기 위해 1조 3,900억 인도 루피(168억 달러)를 배정한 프로젝트)에 힘입은 결과입니다. 중국의 3대 국영 통신 사업자는 2024-2025년에 18만 개의 100 Gbit/s 파장을 새로 도입했습니다. 그러나 미국의 수출 규제로 인해 중국내 800 Gbit/s 장비로의 전환이 둔화될 가능성이 있으며, 유럽 및 미국의 통신 사업자와의 기술 격차가 확대될 우려가 있습니다. 일본과 한국은 계속해서 해저 케이블 기술 혁신을 주도하고 있으며, NEC는 400 Tbit/s를 지원하는 24개 광섬유 쌍으로 구성된 도쿄-로스앤젤레스 간 케이블 수주를 확보했습니다.
중동 지역은 2031년까지 9.47%라는 가장 높은 연평균 성장률(CAGR)을 기록할 것으로 전망됩니다. 사우디아라비아 공공투자기금(PIF)은 2025년에 12곳의 하이퍼스케일 데이터센터에 64억 달러를 투자하기로 결정했으며, 각 데이터센터에는 400 Gbit/s의 이중화 링크가 필요합니다. UAE에 본사를 둔 Khazna Data Centers는 두바이-아부다비 간 회선에 1.6 Tbit/s의 WaveLogic 6 광 모듈을 도입하여, AI 훈련 워크로드의 현지화를 위한 각국의 노력을 지원하고 있습니다.
북미와 유럽은 교체를 기다리고 있는 레거시 DWDM 설비 덕분에 여전히 절대 규모 면에서 가장 큰 시장을 형성하고 있습니다. BEAD 프로그램을 통한 424억 5,000만 달러 규모의 경기 부양책은 메트로 DWDM 및 코히어런트 플러그어블 제품에 대한 수요를 견인하는 한편, EllaLink 및 2Africa와 같은 유럽의 해저 케이블 프로젝트는 장거리 회선 수주를 지속적으로 지원하고 있습니다. 유럽 일부 2급 통신 사업자의 설비 투자 동결이 단기적인 성장을 억제하고 있지만, 20억 7,000만 유로(22억 달러) 규모의 국경 간 CEF-2 펀드를 통해 폴란드, 루마니아, 그리스의 연결성 격차는 해소될 전망입니다. FCC 및 ETSI의 규제 감독은 상호 운용성을 확보하고 벤더 종속성을 완화하지만, 승인 주기가 장기화될 가능성도 있습니다.
기타 혜택:
- 엑셀 형식의 시장 예측(ME) 시트
- 3개월간의 애널리스트 지원
자주 묻는 질문
목차
제1장 서론
제2장 조사 방법
제3장 개요
제4장 시장 구도
제5장 시장 규모와 성장 예측
제6장 경쟁 구도
제7장 시장 기회와 향후 전망
KSAAccording to Mordor Intelligence, the optical transport network market size is USD 29.39 billion in 2026 and is forecast to reach USD 44.03 billion by 2031, advancing at an 8.42% CAGR.
This report is Segmented by Technology (WDM, DWDM, and More), Offering (Services, and Components), End-User Vertical (IT and Telecom Operators, Healthcare, and More), Application (Data Center Interconnect, Metro Networks, Enterprise Networks, and More), Data Rate/Wavelength (100-400 Gbit/S, 400-800 Gbit/S, Beyond 800 Gbit/S), and Geography. The Market Forecasts are Provided in Terms of Value (USD).
Global Optical Transport Network Market Trends and Insights
Rapid 400 ZR/ZR+ Adoption for Data Center Interconnect
Microsoft's Azure network surpassed 50,000 deployed 400ZR modules in 2025, proving that coherent pluggables slash footprint by 40% and power by 30% compared with legacy DWDM shelves. Merchant-silicon suppliers now sell modules directly to hyperscalers, bypassing traditional optical vendors and reshaping procurement models. Ciena confirmed that pluggables accounted for 22% of WaveLogic revenue in fiscal 2025, up from 11% in the prior year. As hyperscalers standardize on 400ZR/400ZR+ for metro DCI links of 80-120 km, the optical transport network market gains a durable volume catalyst that offsets telco spending cyclicality.
Hyperscaler AI-Cluster Traffic Boom
Generative-AI training demands bandwidth dense enough to interconnect clusters of 25,000 GPUs at 400 Gbit/s, driving an unprecedented wave of DCI spending. Amazon Web Services, Microsoft Azure, Google Cloud, and Meta earmarked a combined USD 400 billion of 2026 capital outlays, roughly 35% of which targets networking infrastructure. Transceiver lead times have stretched to 52 weeks for 800 Gbit/s devices, advantaging vendors with captive photonics fabs. The shift toward IP-over-DWDM architectures allows routers with integrated coherent optics to bypass OTN switching, trimming costs but lowering service-layer revenues for carriers.
Capex Freeze at Tier-2 Telcos (2024-2025)
Deutsche Telekom trimmed German fixed-network investment 8% year over year, while America Movil reduced 2025 capex guidance in Brazil and Colombia by 12% in response to higher interest costs. Spending deferrals weigh on regional vendors such as ADVA, yet top suppliers partially hedge the shortfall with hyperscaler sales. Analysts expect a rebound once 5G backhaul needs and subsidy programs reignite upgrades after 2027.
Other drivers and restraints analyzed in the detailed report include:
- Government Fibre-Backhaul Stimulus
- Open-Line Systems Lowering Capex
- US-China Export Controls on Coherent DSPs
For complete list of drivers and restraints, kindly check the Table Of Contents.
Segment Analysis
DWDM systems held a 49.72% share of the optical transport network market in 2025, underscoring their dominance in long-haul and submarine corridors, where spectral efficiency dictates economics. Nokia's PSE-6s platform shows that coherent pluggables can now serve metro access links, merging DWDM performance with WDM simplicity. WDM solutions will post a 9.11% CAGR as metro operators adopt lower-cost 5G backhaul architectures. In turn, merchant-silicon vendors capture value from this convergence, reshaping competitive dynamics.
Legacy O-band technology remains niche for campus interconnects but illustrates application-specific segmentation. Ciena reported an 18% jump in WaveLogic revenue in fiscal 2025, while its traditional OTN switching revenue fell 3%, signaling internal value migration. As coherent pluggables mature, DWDM economics extend toward edge nodes, putting pressure on smaller suppliers that lack R&D heft. The optical transport network market, therefore, faces consolidation even as technology options broaden.
Components generated 58.44% of 2025 revenue, reflecting the large installed base of optical transport equipment. Yet services, projected to grow at an 8.89% CAGR, increasingly monetize the complexity of open-line systems. Cisco disclosed 68% gross margins for optical services, far above hardware margins, underscoring its strategic pivot toward recurring revenue.
The optical transport network market for services will expand as carriers outsource multi-vendor integration and capacity planning. Compact modular platforms such as Infinera's GX G42 fuse switching and transport, reducing footprint and driving demand for lifecycle support over pure hardware refreshes. AI-driven diagnostics could erode some maintenance revenue, but vendors offset this by layering traffic optimization analytics on top of support contracts.
Complete Report Scope:
- By Technology
- WDM
- DWDM
- O-Band and Other Technologies
- By Offering
- Services
- Network Maintenance and Support
- Network Design and Integration
- Components
- Optical Transport Equipment
- Optical Switch
- Optical Platform/Edge ROADM
- Services
- By End-User Vertical
- IT and Telecom Operators
- Cloud and Colocation Data Centres
- Government and Defence
- Healthcare
- Banking and Financial Services
- Other End-User Verticals
- By Application
- Long-Haul DWDM
- Data-Center-Interconnect
- Metro Networks
- Enterprise Networks
- By Data Rate / Wavelength
- 100-400 Gbit/s
- 400-800 Gbit/s
- Beyond 800 Gbit/s
- By Geography
- North America
- United States
- Canada
- Mexico
- Europe
- Germany
- United Kingdom
- France
- Russia
- Rest of Europe
- Asia-Pacific
- China
- Japan
- India
- South Korea
- Australia
- Rest of Asia-Pacific
- Middle East and Africa
- Middle East
- Saudi Arabia
- United Arab Emirates
- Rest of Middle East
- Africa
- South Africa
- Egypt
- Rest of Africa
- Middle East
- South America
- Brazil
- Argentina
- Rest of South America
- North America
Geography Analysis
Asia-Pacific held 35.67% of 2025 revenue, buoyed by China's backbone upgrades and India's BharatNet Phase III, which allocated INR 1.39 trillion (USD 16.8 billion) to rural fiber. China's three state carriers installed 180,000 new 100 Gbit/s wavelengths during 2024-2025. U.S. export controls, however, could slow China's transition to 800 Gbit/s gear, widening the technology gap with Western operators. Japan and South Korea continue to drive submarine innovation, with NEC securing a 24-fiber-pair Tokyo-Los Angeles cable supporting 400 Tbit/s.
The Middle East is projected to post the fastest CAGR of 9.47% through 2031. Saudi Arabia's Public Investment Fund committed USD 6.4 billion to twelve hyperscale data centers in 2025, each requiring 400 Gbit/s redundant links. UAE-based Khazna Data Centers is deploying 1.6 Tbit/s WaveLogic 6 optics on the Dubai-Abu Dhabi corridor, underlining sovereign efforts to localize AI training workloads.
North America and Europe remain the largest absolute markets thanks to legacy DWDM estates awaiting refresh. The BEAD program's USD 42.45 billion stimulus will drive metro DWDM and coherent-pluggable demand, while Europe's submarine projects, such as EllaLink and 2Africa, sustain long-haul orders. Capex freezes at some tier-2 European telcos temper near-term growth, yet cross-border CEF-2 funds of EUR 2.07 billion (USD 2.2 billion) should close connectivity gaps in Poland, Romania, and Greece. Regulatory oversight by the FCC and ETSI ensures interoperability, tempering vendor lock-in but potentially lengthening approval cycles.
- Nokia Corporation
- Ciena Corporation
- Cisco Systems, Inc.
- Huawei Technologies Co., Ltd.
- Fujitsu Limited
- ZTE Corporation
- Infinera Corporation
- Telefonaktiebolaget LM Ericsson
- NEC Corporation
- ADVA Optical Networking SE
- Ribbon Communications Inc.
- Tejas Networks Limited
- Juniper Networks, Inc.
- Sterlite Technologies Limited
- Padtec Holding S.A.
- FiberHome Telecommunication Technologies Co., Ltd.
- Lumentum Holdings Inc.
- Coherent Corp.
Additional Benefits:
- The market estimate (ME) sheet in Excel format
- 3 months of analyst support
TABLE OF CONTENTS
1 INTRODUCTION
- 1.1 Study Assumptions and Market Definition
- 1.2 Scope of the Study
2 RESEARCH METHODOLOGY
3 EXECUTIVE SUMMARY
4 MARKET LANDSCAPE
- 4.1 Market Overview
- 4.2 Market Drivers
- 4.2.1 Rapid 400 ZR/ZR+ Adoption for Data Center Interconnect
- 4.2.2 Hyperscaler AI-Cluster Traffic Boom
- 4.2.3 Government Fibre-Backhaul Stimulus (US BEAD, EU CEF-2)
- 4.2.4 Open-Line Systems Lowering Capex
- 4.2.5 Silicon Photonics Price Inflection
- 4.2.6 Under-Sea Green-Field Cables
- 4.3 Market Restraints
- 4.3.1 Capex Freeze at Tier-2 Telcos (2024-25)
- 4.3.2 US-China Export Controls on Coherent DSPs
- 4.3.3 Skilled-Labour Shortage for Fibre Installation
- 4.3.4 Supply-Chain Dependency on InP Epitaxy
- 4.4 Industry Value Chain Analysis
- 4.5 Regulatory Landscape
- 4.6 Technological Outlook
- 4.7 Impact of Macroeconomic Factors on the Market
- 4.8 Porter's Five Forces Analysis
- 4.8.1 Threat of New Entrants
- 4.8.2 Bargaining Power of Buyers
- 4.8.3 Bargaining Power of Suppliers
- 4.8.4 Threat of Substitutes
- 4.8.5 Intensity of Competitive Rivalry
5 MARKET SIZE AND GROWTH FORECASTS (VALUE)
- 5.1 By Technology
- 5.1.1 WDM
- 5.1.2 DWDM
- 5.1.3 O-Band and Other Technologies
- 5.2 By Offering
- 5.2.1 Services
- 5.2.1.1 Network Maintenance and Support
- 5.2.1.2 Network Design and Integration
- 5.2.2 Components
- 5.2.2.1 Optical Transport Equipment
- 5.2.2.2 Optical Switch
- 5.2.2.3 Optical Platform/Edge ROADM
- 5.2.1 Services
- 5.3 By End-User Vertical
- 5.3.1 IT and Telecom Operators
- 5.3.2 Cloud and Colocation Data Centres
- 5.3.3 Government and Defence
- 5.3.4 Healthcare
- 5.3.5 Banking and Financial Services
- 5.3.6 Other End-User Verticals
- 5.4 By Application
- 5.4.1 Long-Haul DWDM
- 5.4.2 Data-Center-Interconnect
- 5.4.3 Metro Networks
- 5.4.4 Enterprise Networks
- 5.5 By Data Rate / Wavelength
- 5.5.1 100-400 Gbit/s
- 5.5.2 400-800 Gbit/s
- 5.5.3 Beyond 800 Gbit/s
- 5.6 By Geography
- 5.6.1 North America
- 5.6.1.1 United States
- 5.6.1.2 Canada
- 5.6.1.3 Mexico
- 5.6.2 Europe
- 5.6.2.1 Germany
- 5.6.2.2 United Kingdom
- 5.6.2.3 France
- 5.6.2.4 Russia
- 5.6.2.5 Rest of Europe
- 5.6.3 Asia-Pacific
- 5.6.3.1 China
- 5.6.3.2 Japan
- 5.6.3.3 India
- 5.6.3.4 South Korea
- 5.6.3.5 Australia
- 5.6.3.6 Rest of Asia-Pacific
- 5.6.4 Middle East and Africa
- 5.6.4.1 Middle East
- 5.6.4.1.1 Saudi Arabia
- 5.6.4.1.2 United Arab Emirates
- 5.6.4.1.3 Rest of Middle East
- 5.6.4.2 Africa
- 5.6.4.2.1 South Africa
- 5.6.4.2.2 Egypt
- 5.6.4.2.3 Rest of Africa
- 5.6.4.1 Middle East
- 5.6.5 South America
- 5.6.5.1 Brazil
- 5.6.5.2 Argentina
- 5.6.5.3 Rest of South America
- 5.6.1 North America
6 COMPETITIVE LANDSCAPE
- 6.1 Market Concentration
- 6.2 Strategic Moves
- 6.3 Market Share Analysis
- 6.4 Company Profiles (includes Global Level Overview, Market Level Overview, Core Segments, Financials as Available, Strategic Information, Market Rank/Share, Products and Services, Recent Developments)
- 6.4.1 Nokia Corporation
- 6.4.2 Ciena Corporation
- 6.4.3 Cisco Systems, Inc.
- 6.4.4 Huawei Technologies Co., Ltd.
- 6.4.5 Fujitsu Limited
- 6.4.6 ZTE Corporation
- 6.4.7 Infinera Corporation
- 6.4.8 Telefonaktiebolaget LM Ericsson
- 6.4.9 NEC Corporation
- 6.4.10 ADVA Optical Networking SE
- 6.4.11 Ribbon Communications Inc.
- 6.4.12 Tejas Networks Limited
- 6.4.13 Juniper Networks, Inc.
- 6.4.14 Sterlite Technologies Limited
- 6.4.15 Padtec Holding S.A.
- 6.4.16 FiberHome Telecommunication Technologies Co., Ltd.
- 6.4.17 Lumentum Holdings Inc.
- 6.4.18 Coherent Corp.
7 MARKET OPPORTUNITIES AND FUTURE OUTLOOK
- 7.1 White-Space and Unmet-Need Assessment