|
시장보고서
상품코드
2122350
단세포 분석 : 시장 점유율 분석, 업계 동향과 통계, 성장 예측(2026-2031년)Global Single Cell Analysis - Market Share Analysis, Industry Trends & Statistics, Growth Forecasts (2026 - 2031) |
||||||
 Mordor Intelligence
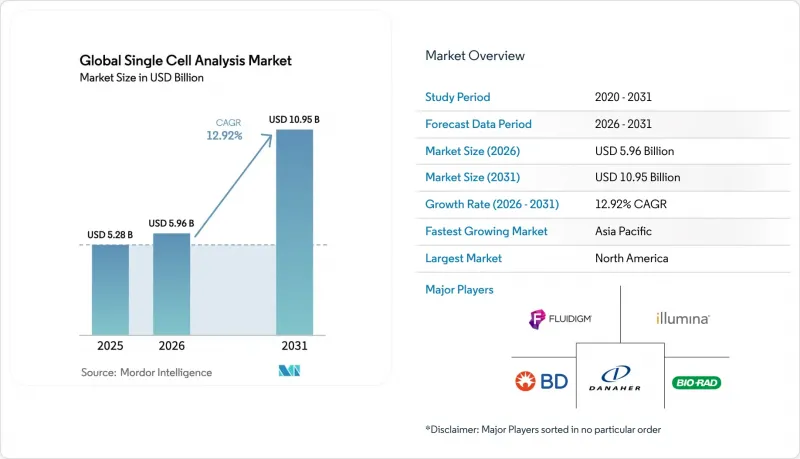
Mordor Intelligence에 의하면, 단세포 분석 시장 규모는 2025년 52억 8,000만 달러에서 2026년에는 59억 6,000만 달러에 이르고, 2026-2031년 CAGR 12.92%로 성장을 지속하여 2031년에는 109억 5,000만 달러에 달할 것으로 예측됩니다.
본 보고서에서는 산업을 제품별(소모품, 장비), 기법별(유세포분석, 기타), 세포 유형별(인간 세포, 기타), 워크플로우 단계별(시료 전처리, 기타),용도별(연구용, 의료·임상용), 최종 사용자별(학술·연구 실험실, 기타), 지역별로 분류하고 있습니다. 시장 규모와 전망은 금액(달러) 기준으로 제시되어 있습니다.
전 세계 단일 세포 분석 시장 동향 및 인사이트
정밀 의학 및 맞춤형 의학의 확산
임상 프로그램에서는 벌크 오믹스 접근법의 한계인 세포의 이질성을 해소하기 위해 단일 세포 기술에 대한 의존도가 높아지고 있습니다. 종양학은 이러한 변화를 여실히 보여주고 있습니다. 단일 세포 RNA 시퀀싱을 통해 내성 종양 클론이 특정되고, 면역 요법의 선택이 정교화되어 반응 예측 정확도가 35% 향상되었습니다. 주요 암 센터에서 일상적인 워크플로우로의 통합이 진행되고 있는 만큼, 단일 세포 분석 시장에는 장기적인 지속적인 수요가 예상됩니다.
정밀 종양학 분야의 단일 세포 멀티오믹스 연구에 대한 자금 지원 급증
단일 세포 해상도로 유전체, 트랜스크립토?ム, 프로테오?ム 측정 결과를 통합하는 스타트업 기업에 대한 벤처 투자액은 2024년에 500억 달러를 넘어섰습니다. 단일 세포에서 DNA, RNA, 단백질 패널을 동시에 제공하는 플랫폼은 바이오마커 발견 및 환자 계층화 파이프라인을 가속화하여 단기적인 상업적 보급을 뒷받침하고 있습니다.
고도 사이토메트리, NGS, 공간 오믹스 장비에 드는 막대한 초기 설비 투자 및 유지 관리 비용
첨단 공간 오믹스 장비의 가격은 대개 50만 달러를 초과하며, 연간 서비스 계약으로 인해 소유 비용의 10-15%가 추가됩니다. 샘플당 500-2,000달러에 달하는 소모품의 고가로 인해, 재정적 여유가 있는 연구 기관을 제외하고는 특히 라틴아메리카, 아프리카, 동남아시아의 일부 지역에서 도입이 제한되고 있습니다.
부문 분석
소모품 부문은 실험실에서 일상적인 워크플로우에 필수적인 시약, 칩, 분석 키트를 반복적으로 구매하기 때문에 2025년 매출의 57.46%를 차지했습니다. 라이브러리 조제용 시약에 대한 지속적인 수요는 예측 가능한 수익의 기반이 되며, 장비 예산에 대한 거시경제 변동에 대한 민감도를 낮추고 있습니다. 장비 판매는 규모는 작지만, 한 번의 실행으로 여러 오믹스 데이터를 얻을 수 있는 신제품 출시로 인해 연평균 성장률(CAGR) 14.08%를 나타낼 것으로 예측됩니다. 고성능 처리를 효율화하는 자동 액체 핸들링 및 로봇 모듈도 자본 설비로서의 매력을 높이고 있습니다.
소모품 제조업체들은 시약과 소프트웨어, 기술 지원을 결합한 통합 워크플로우 번들로 사업 중심을 옮기며 고객 락인을 강화하고 있습니다. 폭넓은 포트폴리오를 보유한 기업들은 교차 판매의 이점을 활용하는 한편, 틈새 시장 시약 공급업체들은 종합적인 솔루션을 제공하기 위한 파트너십을 모색하고 있습니다. 공간 오믹스 및 DNA·RNA·단백질을 병용하는 분석 장비가 프로토타입 단계에서 상용화로 전환됨에 따라, 단일 세포 분석용 기기 시장 규모는 급속히 확대될 전망입니다.
유세포 분석은 임상 면역학, 이식, 혈액암 검사실에서의 확고한 채택을 배경으로 2025년에도 매출 점유율 34.08%를 유지했습니다. 검출기와 형광증백제의 지속적인 업그레이드를 통해 40개 이상의 매개변수를 포괄하는 패널이 가능해지면서 실용성이 향상되고 있습니다. 차세대 시퀀싱은 기가베이스당 비용 감소와 세포 바코드화 기술로 인해 하이컨텐츠 전사체 프로파일링이 가능해짐에 따라 연평균 성장률(CAGR) 13.35%를 나타낼 것으로 예측되며, 가장 빠르게 성장하는 기술입니다. 단일 세포 분석 시장에서는 PCR, 현미경법, 질량 분석법, 마이크로플루이딕스 기술, RNA-FISH가 각각 전문적인 틈새 시장을 차지하고 있습니다. 질량 분석법을 이용한 단일 세포 단백질체학는 전사 산물에서 단백질로 이어지는 간극을 메우고 있는 반면, 공간 전사체학은 이미징과 시퀀싱을 결합하여 미세 환경에 대한 인사이트력을 제공합니다.
지역별 분석
북미는 2025년에 매출의 41.72%를 차지할 것으로 예상되며, NIH의 자금 지원, 암 센터의 긴밀한 네트워크, Thermo Fisher Scientific, Illumina, 10x Genomics와 같은 세계 시장 선도 기업들의 본사가 위치한 점이 이를 뒷받침하고 있습니다. FDA가 실험실에서 개발된 단일 세포 진단법에 관여함으로써 규제가 명확해지고 있습니다. 학술 의료 시스템과 산업 간의 지역적 협력을 통해 중개 연구 파이프라인이 가속화되고 있습니다. 분자진단에 대한 보험 적용 범위가 확대됨에 따라, 북미의 단일 세포 분석 시장 규모는 앞으로도 계속 확대될 것으로 예측됩니다.
아시아태평양은 2031년까지 연평균 성장률(CAGR) 14.12%를 기록하며 가장 높은 성장률을 보일 것으로 예측됩니다. 중국의 정밀의료 추진, 일본의 기술력, 인도의 확대되는 생명공학 부문이 수요를 뒷받침하고 있습니다. 국가 연구 보조금과 체외진단 검사에 대한 유리한 승인 절차가 소모품 및 장비의 현지 생산을 뒷받침하고 있습니다. 또한 각국 정부는 데이터 관리 수요에 대응하기 위해 클라우드 인프라에 대한 투자도 진행하고 있습니다.
유럽은 독일, 영국, 프랑스를 필두로 여전히 큰 시장 점유율을 유지하고 있습니다. ‘호라이즌 유럽(Horizon Europe)’의 지원금이 다기관 공동 연구를 뒷받침하는 한편, ‘체외진단용 의료기기 규정(IVDR)’에 따라 성능 입증 요건이 엄격해져 제품 설계에 영향을 미치고 있습니다. 중동과 남미에서는 도입 규모는 작지만 확대 추세를 보이고 있으며, 이는 의료의 현대화와 유전체 모니터링 프로그램의 진전을 반영하고 있습니다. 이러한 신흥 지역에서의 보급 속도는 비용 측면의 장벽과 인력 부족에 대한 대응 여부에 따라 결정될 것으로 보입니다.
기타 혜택
- 엑셀 형식 시장 예측(ME) 시트
- 3개월간의 애널리스트 지원
자주 묻는 질문
목차
제1장 서론
제2장 조사 방법
제3장 주요 요약
제4장 시장 구도
제5장 시장 규모와 성장 예측
제6장 경쟁 구도
제7장 시장 기회와 향후 전망
LSH 26.09.04According to Mordor Intelligence, the single cell analysis market size is expected to grow from USD 5.28 billion in 2025 to USD 5.96 billion in 2026 and is forecast to reach USD 10.95 billion by 2031 at 12.92% CAGR over 2026-2031.
This report Segments the Industry Into by Product (Consumables and Instruments), Technique (Flow Cytometry, and More), Cell Type (Human Cells and More), Workflow Step (Sample Preparation, and More), Application (Research Applications, Medical Applications), End User (Academic and Research Laboratories, and More), and Geography. The Market Sizes and Forecasts are Provided in Terms of Value (USD).
Global Single Cell Analysis Market Trends and Insights
Expanding Adoption of Precision and Personalized Medicine
Clinical programs increasingly rely on single-cell technologies to resolve cellular heterogeneity that limits bulk-omics approaches. Oncology illustrates the shift: single-cell RNA sequencing is identifying resistant tumor clones and refining immunotherapy selection, driving 35% gains in response-prediction accuracy . Growing integration into routine workflows across major cancer centers positions the single cell analysis market for sustained long-term demand.
Surge in Single-Cell Multi-Omics Funding for Precision Oncology
Venture investment in startups that combine genomic, transcriptomic, and proteomic readouts at single-cell resolution surpassed USD 50 billion in 2024. Platforms delivering simultaneous DNA, RNA, and protein panels from a single cell are accelerating biomarker discovery and patient-stratification pipelines, reinforcing near-term commercial uptake.
High Upfront Capital Expenditure and Maintenance Costs
Advanced spatial-omics instruments often list above USD 500,000, with annual service contracts adding 10-15% of ownership cost. High consumable prices, ranging USD 500-2,000 per sample, limit adoption outside well-funded centers, especially in Latin America, Africa, and parts of Southeast Asia .
Other drivers and restraints analyzed in the detailed report include:
- Increasing Prevalence of Cancer and Immune-Mediated Disorders
- Escalating Government and Venture-Capital Funding
- Introduction of AI-Enabled Bioinformatics Platforms
- Emergence of Spatial Transcriptomics Platforms Integrating Imaging + RNA-seq
- Shortage of Trained Bioinformaticians for Giga-Scale Datasets
- Data-Management, Storage, and Cybersecurity Challenges
For complete list of drivers and restraints, kindly check the Table Of Contents.
Segment Analysis
The consumables segment accounted for 57.46% of 2025 revenue as laboratories repeatedly purchase reagents, chips, and assay kits essential for routine workflows. Continuous demand for library-prep reagents anchors predictable income and lowers sensitivity to macroeconomic swings in instrumentation budgets. Instrument sales, although a smaller base, are projected to grow 14.08% CAGR owing to launches that combine multi-omic readouts in single runs. Automated liquid-handling and robotics modules that streamline high-throughput processing are also raising capital-equipment appeal.
Consumable manufacturers are pivoting toward integrated workflow bundles that pair reagents with software and technical support, deepening customer lock-in. Broad-portfolio firms capture cross-selling advantages, whereas niche reagent suppliers seek partnerships for full-solution offerings. The single cell analysis market size for instruments is set to expand rapidly as spatial-omics and combined DNA-RNA-protein analyzers move from prototype to commercial release.
Flow cytometry retained 34.08% revenue share in 2025 on the strength of established adoption in clinical immunology, transplantation, and blood-cancer labs. Continuous detector and fluorophore upgrades permit 40-plus-parameter panels, bolstering utility. Next-generation sequencing is the fastest-growing technique, forecast at 13.35% CAGR, as falling per-gigabase costs and cell-barcoding chemistries unlock high-content transcriptomic profiling. The single cell analysis market sees PCR, microscopy, mass spectrometry, microfluidics, and RNA-FISH occupying specialized niches. Mass-spectrometry-based single-cell proteomics is bridging transcript-to-protein gaps, while spatial transcriptomics combines imaging with sequencing to add microenvironment insights.
Complete Report Scope:
- By Product
- Consumables
- Instruments
- By Technique
- Flow Cytometry
- Next-Generation Sequencing
- Polymerase Chain Reaction (PCR)
- Microscopy
- Mass Spectrometry
- Microfluidics
- RNA-FISH
- Other Techniques
- By Cell Type
- Human Cells
- Animal Cells
- Microbial Cells
- Plant Cells
- By Workflow Step
- Sample Preparation
- Cell Isolation & Sorting
- Single-Cell Analysis
- Data Analysis & Management
- By Application
- Research Applications
- Stem Cell Research
- Neuroscience
- Immunology
- Oncology
- Microbiology
- Other Research Applications
- Medical / Clinical Applications
- Prenatal Testing
- In Vitro Fertilization
- Infectious Disease Diagnostics
- Oncology Diagnostics
- Research Applications
- By End User
- Academic & Research Laboratories
- Biotechnology & Pharmaceutical Companies
- Hospital & Diagnostic Laboratories
- Contract Research Organizations (CROs)
- By Geography
- North America
- United States
- Canada
- Mexico
- Europe
- Germany
- United Kingdom
- France
- Italy
- Spain
- Rest of Europe
- Asia-Pacific
- China
- Japan
- India
- South Korea
- Australia
- Rest of Asia-Pacific
- Middle East
- GCC
- South Africa
- Rest of Middle East
- South America
- Brazil
- Argentina
- Rest of South America
- North America
Geography Analysis
North America contributed 41.72% revenue in 2025, supported by NIH funding, a dense network of cancer centers, and headquarters of global market leaders such as Thermo Fisher Scientific, Illumina, and 10x Genomics. FDA engagement with lab-developed single-cell diagnostics is fostering regulatory clarity. Regional collaborations between academic health systems and industry accelerate translational pipelines. The single cell analysis market size in North America is expected to keep expanding as reimbursements for molecular diagnostics broaden.
Asia-Pacific is forecast to post the fastest 14.12% CAGR through 2031. China's precision-medicine initiatives, Japan's engineering strengths, and India's expanding biotech sector underpin demand. National research grants and favorable approval pathways for in-vitro tests are catalyzing local production of consumables and instruments. Regional governments are also investing in cloud infrastructure to cope with data-management demands.
Europe maintains a sizeable share led by Germany, the United Kingdom, and France. Horizon Europe grants fuel multi-center research, while the In-Vitro Diagnostic Regulation tightens performance-evidence requirements, influencing product designs. Smaller but growing adoption in the Middle East and South America reflects increasing healthcare modernization and genome-surveillance programs. Addressing cost barriers and workforce gaps will determine uptake pace across these emerging territories.
- Thermo Fisher Scientific
- Beckton Dickinson
- Illumina
- Beckton Dickinson
- 10x Genomics Inc.
- Agilent Technologies
- Bio-Rad Laboratories
- QIAGEN
- Merck KGaA (MilliporeSigma)
- Fluidigm Corp. (Standard BioTools)
- GE HealthCare Technologies Inc.
- Promega
- Takara Bio
- Oxford Nanopore Technologies plc
- PerkinElmer Inc. (Revvity)
- Cytek Biosciences Inc.
- Sartorius AG (Cellenion)
- Parse Biosciences
- Mission Bio Inc.
- BGI Genomics Co. Ltd.
- Dolomite Bio (Blacktrace)
- Menarini
- Sysmex
- NanoString Technologies Inc.
- BioSkryb Genomics
Additional Benefits:
- The market estimate (ME) sheet in Excel format
- 3 months of analyst support
TABLE OF CONTENTS
1 Introduction
- 1.1 Study Assumptions & Market Definition
- 1.2 Scope of the Study
2 Research Methodology
3 Executive Summary
4 Market Landscape
- 4.1 Market Overview
- 4.2 Market Drivers
- 4.2.1 Expanding Adoption of Precision and Personalized Medicine
- 4.2.2 Surge in single-cell multi-omics funding for precision oncology
- 4.2.3 Increasing Prevalence of Cancer and Immune-Mediated Disorders
- 4.2.4 Escalating Government and Venture-Capital Funding
- 4.2.5 Introduction of AI-Enbaled Bioinformatics Platforms
- 4.2.6 Emergence of spatial transcriptomics platforms integrating imaging + RNA-seq
- 4.3 Market Restraints
- 4.3.1 High upfront capital expenditure and maintenance costs for advanced cytometry, NGS, and spatial-omics instruments
- 4.3.2 Shortage of trained bioinformaticians for giga-scale single-cell datasets
- 4.3.3 Data-management, storage, and cybersecurity challenges posed by tera-scale single-cell datasets
- 4.4 Value / Supply-Chain Analysis
- 4.5 Regulatory & Technological Outlook
- 4.6 Porter's Five Forces
- 4.6.1 Threat of New Entrants
- 4.6.2 Bargaining Power of Buyers/Consumers
- 4.6.3 Bargaining Power of Suppliers
- 4.6.4 Threat of Substitute Products
- 4.6.5 Intensity of Competitive Rivalry
5 Market Size & Growth Forecasts
- 5.1 By Product
- 5.1.1 Consumables
- 5.1.2 Instruments
- 5.2 By Technique
- 5.2.1 Flow Cytometry
- 5.2.2 Next-Generation Sequencing
- 5.2.3 Polymerase Chain Reaction (PCR)
- 5.2.4 Microscopy
- 5.2.5 Mass Spectrometry
- 5.2.6 Microfluidics
- 5.2.7 RNA-FISH
- 5.2.8 Other Techniques
- 5.3 By Cell Type
- 5.3.1 Human Cells
- 5.3.2 Animal Cells
- 5.3.3 Microbial Cells
- 5.3.4 Plant Cells
- 5.4 By Workflow Step
- 5.4.1 Sample Preparation
- 5.4.2 Cell Isolation & Sorting
- 5.4.3 Single-Cell Analysis
- 5.4.4 Data Analysis & Management
- 5.5 By Application
- 5.5.1 Research Applications
- 5.5.1.1 Stem Cell Research
- 5.5.1.2 Neuroscience
- 5.5.1.3 Immunology
- 5.5.1.4 Oncology
- 5.5.1.5 Microbiology
- 5.5.1.6 Other Research Applications
- 5.5.2 Medical / Clinical Applications
- 5.5.2.1 Prenatal Testing
- 5.5.2.2 In Vitro Fertilization
- 5.5.2.3 Infectious Disease Diagnostics
- 5.5.2.4 Oncology Diagnostics
- 5.5.1 Research Applications
- 5.6 By End User
- 5.6.1 Academic & Research Laboratories
- 5.6.2 Biotechnology & Pharmaceutical Companies
- 5.6.3 Hospital & Diagnostic Laboratories
- 5.6.4 Contract Research Organizations (CROs)
- 5.7 By Geography
- 5.7.1 North America
- 5.7.1.1 United States
- 5.7.1.2 Canada
- 5.7.1.3 Mexico
- 5.7.2 Europe
- 5.7.2.1 Germany
- 5.7.2.2 United Kingdom
- 5.7.2.3 France
- 5.7.2.4 Italy
- 5.7.2.5 Spain
- 5.7.2.6 Rest of Europe
- 5.7.3 Asia-Pacific
- 5.7.3.1 China
- 5.7.3.2 Japan
- 5.7.3.3 India
- 5.7.3.4 South Korea
- 5.7.3.5 Australia
- 5.7.3.6 Rest of Asia-Pacific
- 5.7.4 Middle East
- 5.7.4.1 GCC
- 5.7.4.2 South Africa
- 5.7.4.3 Rest of Middle East
- 5.7.5 South America
- 5.7.5.1 Brazil
- 5.7.5.2 Argentina
- 5.7.5.3 Rest of South America
- 5.7.1 North America
6 Competitive Landscape
- 6.1 Market Concentration
- 6.2 Market Share Analysis
- 6.3 Company Profiles (includes Global-level Overview, Market-level Overview, Core Segments, Financials as available, Strategic Information, Market Rank/Share, Products & Services, Recent Developments)
- 6.3.1 Thermo Fisher Scientific Inc.
- 6.3.2 Becton, Dickinson and Company
- 6.3.3 Illumina Inc.
- 6.3.4 Beckman Coulter Inc. (Danaher)
- 6.3.5 10x Genomics Inc.
- 6.3.6 Agilent Technologies Inc.
- 6.3.7 Bio-Rad Laboratories Inc.
- 6.3.8 Qiagen NV
- 6.3.9 Merck KGaA (MilliporeSigma)
- 6.3.10 Fluidigm Corp. (Standard BioTools)
- 6.3.11 GE HealthCare Technologies Inc.
- 6.3.12 Promega Corporation
- 6.3.13 Takara Bio Inc.
- 6.3.14 Oxford Nanopore Technologies plc
- 6.3.15 PerkinElmer Inc. (Revvity)
- 6.3.16 Cytek Biosciences Inc.
- 6.3.17 Sartorius AG (Cellenion)
- 6.3.18 Parse Biosciences
- 6.3.19 Mission Bio Inc.
- 6.3.20 BGI Genomics Co. Ltd.
- 6.3.21 Dolomite Bio (Blacktrace)
- 6.3.22 Menarini Silicon Biosystems
- 6.3.23 Sysmex Corporation
- 6.3.24 NanoString Technologies Inc.
- 6.3.25 BioSkryb Genomics