

|
시장보고서
상품코드
2122381
이온교환수지 : 시장 점유율 분석, 산업 동향·통계 데이터, 성장 예측(2026-2031년)Ion Exchange Resin - Market Share Analysis, Industry Trends & Statistics, Growth Forecasts (2026 - 2031) |
||||||
 Mordor Intelligence
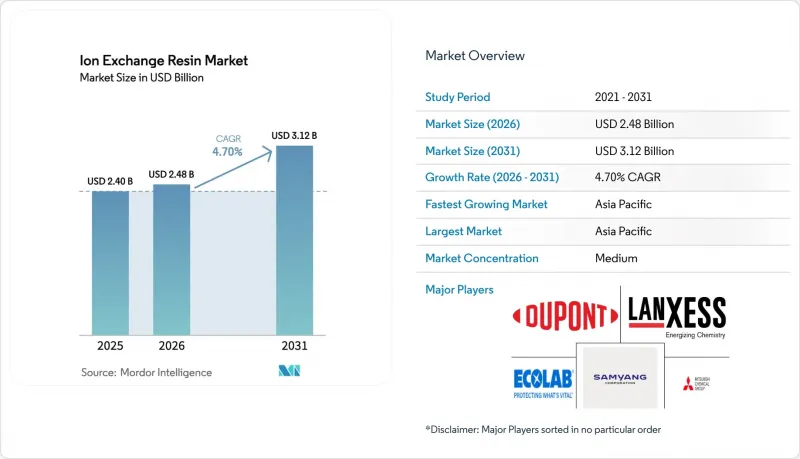
Mordor Intelligence에 따르면 이온교환수지 시장 규모는 2025년에 24억 달러로 평가되어 예측 기간(2026-2031년)에 CAGR 4.70%로 확대하며, 2026년 24억 8,000만 달러에서 2031년에는 31억 2,000만 달러에 달할 것으로 추정되고 있습니다.

이 보고서는 유형(범용 수지, 특수 수지), 활용 기능(연화·탈염, 초순수 제조 등), 최종 용도 산업(수처리, 전력, 식품 및 음료, 제약 등) 및 지역(아시아태평양, 북미, 유럽, 남미, 중동 및 아프리카)별로 분류되어 있습니다. 시장 예측은 금액(달러) 기준으로 제시되어 있습니다.
세계 이온교환수지 시장의 동향 및 인사이트
아시아태평양의 반도체 등급 초순수 수요
3nm 이하의 로직 칩 제조에는 총 유기 탄소(TOC)가 1ppb 미만이고 비저항이 18.2 MΩ*cm 이상인 물이 필요하며, 이 사양을 충족하는 것은 핵급 혼합층 수지만입니다. 미쓰비시 화학은 2026년 4월, 현재 2nm 공정의 생산을 확대하고 있는 대만 및 한국의 파운드리 업체를 대상으로 ‘Diaion’의 생산 능력을 15% 확대할 것이라고 발표했습니다. SEMI 규격에서는 포토리소그래피 장비 직전의 최종 장벽으로서 이온 교환 폴리셔의 사용이 의무화되어 있으며, 이로 인해 독립형 막식 루프는 대체되고 있습니다. 중국에서는 2025년에 200기 이상의 초순수 시스템이 도입되었는데, 이들 1기당 팹 용량 1기가와트당 10-15m3의 혼합층 수지를 소비하므로 태풍으로 인해 동아시아 전역에서 스티렌 출하가 지연될 때마다 공급망에 위험이 발생하고 있습니다.
PFAS 및 중금속 배출 제한으로 인해 북미에서 킬레이트 수지 수요가 확대되고 있습니다.
미국 환경보호청(EPA)은 2024년 4월, PFOA의 최대 오염 물질 농도를 4 ppt, PFOS를 10 ppt로 하는 기준을 확정하고, 2029년까지 이를 준수할 것을 의무화했습니다. 유형 II 강염기성 음이온 수지는 레거시 PFAS와 단쇄 PFAS를 동시에 제거하기 위한 최상의 이용 가능한 기술로 부상했습니다. 미시간주, 뉴저지주, 캘리포니아주의 공공사업자들은 사용 후 수지의 처리 문제가 아직 해결되지 않았음에도 불구하고 2025년에 입상층 시스템 개보수 공사로 3억 달러가 넘는 계약을 체결했습니다. 이와 병행하여 ‘수질정화법’ 개정에 따라 납, 카드뮴, 크롬의 기준치가 상향 조정됨에 따라 이미노디아세테이트계 및 아미노포스폰산계 기능성 수지의 채택이 가속화되었습니다. 현재 특수 등급 수지는 범용 연수화 비드에 비해 40-60% 높은 가격에 판매되고 있습니다.
변동이 심한 스티렌 및 아크릴 모노머 가격
스티렌·디비닐벤젠 공중합체는 세계 생산량의 80% 이상을 차지하고 있지만, 2024-2025년에 아시아에서는 스티렌이 톤당 1,150-1,450달러에 거래되어, 이로 인해 완제품 수지의 원가가 6-8% 상승했습니다. 의약품 및 식품 분야에서 사용되는 아크릴 수지 역시 2025년 상반기에 유럽의 아크릴산 가격이 전년 동기 대비 22% 상승함에 따라 유사한 가격 변동에 직면하고 있습니다. 현물 시장의 원료에 의존하고 있는 인도와 중국의 소규모 생산 업체들은 이익률이 7-9%로 압박받으며, 업계 재편이나 때때로 공장 가동 중단을 감수해야 하는 상황에 처해 있습니다.
부문별 분석
범용 수지는 1L당 8-12달러 가격대의 보일러 급수 연화 시스템을 주력 제품으로 하여 2025년 매출의 74.35%를 차지했습니다. 한편, 특수 수지는 연평균 5.33%의 성장이 예상되며, 범용 수지의 성장률을 63 베이시스 포인트 상회할 것으로 전망됩니다. 2024-2025년에 Sunresin사와 LANXESS사가 출시한 리튬 선택성 수지는 Mg:Li의 선택성이 100:1을 초과하여 아르헨티나와 칠레의 염수에서 직접 추출을 가능하게 하고 있습니다. NSF/ANSI 61을 준수하는 식품 등급 제품은 리터당 3-5달러의 추가 비용이 들지만, 음료 라인에서 이취로 인한 리콜을 방지할 수 있습니다.
영구적인 다공성을 지닌 거대 다공성 비드는 삼투압 충격을 견디고 수명을 연장할 수 있으며, 현재 설탕 탈색 및 항생제 정제 분야에서 주류를 이루고 있습니다. 규제 준수를 중시하는 화학 기술로의 전환이 지속됨에 따라 2031년까지 범용 제품의 매출 점유율은 축소될 전망입니다.
지역별 분석
아시아태평양은 2025년 매출의 34.59%를 차지하고 있으며, 반도체 팹 및 리튬 염수 프로젝트를 견인력으로 삼아 2031년까지 연평균 성장률(CAGR) 5.54%를 기록할 것으로 전망됩니다. 중국에서는 2025년에 200기 이상의 초순수 시스템이 도입될 예정이며, 각 시스템은 용량 1기가와트당 10-15m3의 혼합층 수지를 채택하고 있습니다. 인도에서는 제약 업계의 급속한 성장과 ‘스케줄 M’ 수질 기준 개정이 혼합층 수지 교체를 촉진하고 있는 반면, 베트남이나 말레이시아 등 아세안 시장에서는 전자 분야의 그린필드 투자가 잇따르고 있습니다. 원료인 스티렌의 가격 변동(2024-2025년에 고점에서 저점까지 26%의 변동폭)으로 인해 수직 통합을 하지 않은 생산 업체의 이익률이 압박받고 있습니다.
북미에서는 EPA의 PFAS 규제로 인해 2029년까지 미국 공공 상수도 시스템의 6-10%에서 음이온 교환 장치의 개조가 필요하게 됩니다. 캐나다의 오일샌드 프로젝트에서는 생산수의 정제에 이온 교환이 이용되고 있지만, 앨버타주에서의 설비 투자 축소로 인해 추가 수요는 억제되고 있습니다. 멕시코로의 니어쇼어링 유입으로 인해 초순수가 필요한 전자기기용 코팅 라인이 확대되고 있으며, USMCA 회랑 전역에서 이온교환수지 시장이 확대되고 있습니다.
유럽에서는 매립 규제로 인해 수명 주기 비용이 상승하고 있으며, 성장이 더딘 편이지만, 이 지역은 여전히 기술적 우위를 유지하고 있습니다. EU가 제시한 2030년까지 전해조 용량 40GW라는 수소 목표는 누적 600만-800만 m²의 PFSA 막 수요를 의미하지만, AEM의 파일럿 프로젝트가 PFSA 수요의 일부를 잠식할 가능성이 있습니다. 남미에서는 브라질과 아르헨티나에 수요가 집중되어 있으며, 이들 국가에서는 설탕 정제 및 광업 프로젝트가 식품 등급 및 킬레이트 수지의 채택을 주도하고 있습니다. 중동 및 아프리카에서는 사우디아라비아, UAE, 카타르에서 해수 담수화 및 ‘액체 배출 제로’ 의무화가 추진되고 있으며, 수요가 견인되고 있습니다.
기타 혜택:
- Excel 형식의 시장 예측(ME) 시트
- 3개월간의 애널리스트 지원
자주 묻는 질문
목차
제1장 서론
제2장 분석 방법
제3장 개요
제4장 시장 구도
제5장 시장 규모·성장률 예측
제6장 경쟁 구도
제7장 시장 기회와 향후 전망
KSA 26.09.07According to Mordor Intelligence, the ion exchange resin market size was valued at USD 2.40 billion in 2025 and is estimated to grow from USD 2.48 billion in 2026 to reach USD 3.12 billion by 2031, at a CAGR of 4.70% during the forecast period (2026-2031).
This report is Segmented by Type (Commodity Resins and Specialty Resins), Application Function (Softening and Demineralization, Ultrapure Water Production, and More), End-Use Industry (Water Treatment, Power, Food and Beverage, Pharmaceutical, and More), and Geography (Asia-Pacific, North America, Europe, South America, and Middle East and Africa). The Market Forecasts are Provided in Terms of Value (USD).
Global Ion Exchange Resin Market Trends and Insights
Semiconductor-Grade Ultrapure Water Demand in Asia-Pacific
Fabricating sub-3 nm logic chips requires water with total organic carbon below 1 ppb and resistivity above 18.2 MΩ*cm, a specification met only by nuclear-grade mixed-bed resins. Mitsubishi Chemical disclosed a 15% Diaion capacity expansion in April 2026, aimed at Taiwanese and South Korean foundries now ramping 2 nm production. SEMI standards mandate ion-exchange polishers as the final barrier before photolithography tools, displacing stand-alone membrane loops. China installed more than 200 ultrapure-water systems in 2025, each consuming 10-15 m3 of mixed-bed resin per gigawatt of fab capacity, creating supply-chain risk whenever typhoons delay styrene shipments across East Asia.
PFAS and Heavy-Metal Discharge Limits Boosting Chelating Resins in North America
The U.S. EPA finalized maximum contaminant levels of 4 ppt for PFOA and 10 ppt for PFOS in April 2024, with compliance required by 2029. Type II strong-base anion resins emerged as the best available technology for simultaneous removal of legacy and short-chain PFAS. Utilities in Michigan, New Jersey, and California awarded contracts exceeding USD 300 million in 2025 to retrofit granular-bed systems, even though spent-resin disposal remains unresolved. Parallel Clean Water Act updates tightened lead, cadmium, and chromium limits, accelerating uptake of iminodiacetic- and aminophosphonic-functional resins. Specialty grades now sell at 40-60% price premiums over commodity softening beads.
Volatile Styrene and Acrylic Monomer Prices
Styrene-divinylbenzene copolymers constitute more than 80% of global output, yet styrene traded between USD 1,150 and USD 1,450 t-1 in Asia during 2024-2025, lifting finished-resin costs 6-8%. Acrylic resins used in pharma and food lines face similar volatility after European acrylic-acid prices rose 22% year-on-year in H1 2025. Smaller producers in India and China, reliant on spot feedstock, saw margins compress to 7-9%, forcing consolidation and occasional plant shutdowns.
Other drivers and restraints analyzed in the detailed report include:
- Desalination and ZLD Megaprojects in the Middle East Raising Mixed-Bed Uptake
- Hydrogen-Electrolyzer Incentives Lifting PFSA Membranes in Europe
- European Union Landfill and Incineration Restrictions on Spent Resins
For complete list of drivers and restraints, kindly check the Table Of Contents.
Segment Analysis
Commodity resins delivered 74.35% of 2025 revenue, anchored by boiler-feed softening systems priced at USD 8-12 L-1. However, specialty resins are projected to grow 5.33% annually, eclipsing commodity expansion by 63 bps. Lithium-selective resins launched by Sunresin and LANXESS in 2024-2025 provide Mg:Li selectivity above 100:1, enabling direct extraction from Argentine and Chilean brines. Food-grade variants that meet NSF/ANSI 61 carry USD 3-5 L-1 additional cost yet prevent off-flavor recalls in beverage lines.
Macroporous beads with permanent porosity now dominate sugar-decolorization and antibiotic purification because they resist osmotic shock, extending service life. Continued migration toward compliance-driven chemistries will narrow commodity revenue share by 2031.
Complete Report Scope:
- By Type
- Commodity Resins
- Specialty Resins
- By Application Function
- Softening and Demineralization
- Ultrapure Water Production
- Heavy-Metal Removal and PFAS Mitigation
- Catalysis and Separation (Non-Water)
- Sugar Decolorization and Food and Beverage Purification
- Precious-Metal Recovery and Hydrometallurgy
- By End-use Industry
- Water Treatment
- Power
- Food and Beverage
- Pharmaceutical
- Chemical Processing
- Mining and Metallurgy
- Other End-User Industries
- By Geography
- Asia-Pacific
- China
- India
- Japan
- South Korea
- ASEAN Countries
- Rest of Asia-Pacific
- North America
- United States
- Canada
- Mexico
- Europe
- Germany
- United Kingdom
- Italy
- France
- Rest of Europe
- South America
- Brazil
- Argentina
- Rest of South America
- Middle East and Africa
- Saudi Arabia
- South Africa
- Rest of Middle East and Africa
- Asia-Pacific
Geography Analysis
Asia-Pacific held 34.59% of 2025 revenue and should log a 5.54% CAGR through 2031, paced by semiconductor fabs and lithium-brine projects. China added more than 200 ultrapure-water systems in 2025, each deploying 10-15 m3 of mixed-bed resin per gigawatt of capacity. India's pharmaceutical boom and revised Schedule M water codes are catalyzing mixed-bed upgrades, while ASEAN markets such as Vietnam and Malaysia are attracting greenfield electronics investments. Volatile styrene feedstock-26% price swing peak-to-trough in 2024-2025-compresses margins for producers without vertical integration.
In North America, EPA PFAS rules mean 6-10% of U.S. public water systems will require anion-exchange retrofits by 2029. Canada's oil-sands projects rely on ion exchange to polish produced water, but capex cuts in Alberta curb incremental demand. Mexico's near-shoring inflow is pushing electronics-coating lines that require ultrapure water, expanding the ion exchange resin market across the USMCA corridor.
Europe trails in growth as landfill restrictions raise lifecycle costs, yet the bloc retains a technology edge. EU hydrogen targets of 40 GW electrolyzer capacity by 2030 imply cumulative PFSA membrane demand of 6-8 million m2, though AEM pilots could partially cannibalize PFSA volumes. South America concentrates in Brazil and Argentina, where sugar refining and mining projects drive food-grade and chelating resin adoption. The Middle East and Africa drive demand as desalination and zero-liquid-discharge mandates rolled out across Saudi Arabia, the UAE, and Qatar.
- Anhui Sanxing Resin Co., Ltd.
- Bio-Rad Laboratories, Inc.
- DOSHION POLYSCIENCE PVT. LTD.
- DuPont
- Ecolab
- Eichrom Technologies, LLC
- IEI
- Jacobi Carbons Group
- LANXESS
- Mitsubishi Chemical Group Corporation
- Polymex
- Pure Resin Co., Ltd.
- ResinTech, Inc.
- Samyang Corporation
- Sunresin New Materials Co., Ltd.
- Suqing Group
- Suzhou Bojie Resin Technology Co., Ltd.
- Thermax Limited
- Xylem
Additional Benefits:
- The market estimate (ME) sheet in Excel format
- 3 months of analyst support
TABLE OF CONTENTS
1 Introduction
- 1.1 Study Assumptions and Market Definition
- 1.2 Scope of the Study
2 Research Methodology
3 Executive Summary
4 Market Landscape
- 4.1 Market Overview
- 4.2 Market Drivers
- 4.2.1 Semiconductor-Grade Ultrapure Water Demand in Asia-Pacific
- 4.2.2 PFAS and Heavy-Metal Discharge Limits Boosting Chelating Resins in North America
- 4.2.3 Desalination and ZLD Megaprojects in the Middle East Raising Mixed-Bed Uptake
- 4.2.4 Hydrogen-Electrolyzer Incentives Lifting PFSA Ion-Exchange Membranes in Europe
- 4.2.5 Sugar-Decolorization Boom Driving Food-Grade Resins in South America
- 4.3 Market Restraints
- 4.3.1 Volatile Styrene and Acrylic Monomer Prices
- 4.3.2 Bio-Based Adsorbents Undercutting Resin Economics
- 4.3.3 European Union Landfill and Incineration Restrictions on Spent Resins
- 4.4 Value Chain Analysis
- 4.5 Porter's Five Forces
- 4.5.1 Bargaining Power of Suppliers
- 4.5.2 Bargaining Power of Buyers
- 4.5.3 Threat of New Entrants
- 4.5.4 Threat of Substitutes
- 4.5.5 Industry Rivalry
5 Market Size and Growth Forecasts (Value)
- 5.1 By Type
- 5.1.1 Commodity Resins
- 5.1.2 Specialty Resins
- 5.2 By Application Function
- 5.2.1 Softening and Demineralization
- 5.2.2 Ultrapure Water Production
- 5.2.3 Heavy-Metal Removal and PFAS Mitigation
- 5.2.4 Catalysis and Separation (Non-Water)
- 5.2.5 Sugar Decolorization and Food and Beverage Purification
- 5.2.6 Precious-Metal Recovery and Hydrometallurgy
- 5.3 By End-use Industry
- 5.3.1 Water Treatment
- 5.3.2 Power
- 5.3.3 Food and Beverage
- 5.3.4 Pharmaceutical
- 5.3.5 Chemical Processing
- 5.3.6 Mining and Metallurgy
- 5.3.7 Other End-User Industries
- 5.4 By Geography
- 5.4.1 Asia-Pacific
- 5.4.1.1 China
- 5.4.1.2 India
- 5.4.1.3 Japan
- 5.4.1.4 South Korea
- 5.4.1.5 ASEAN Countries
- 5.4.1.6 Rest of Asia-Pacific
- 5.4.2 North America
- 5.4.2.1 United States
- 5.4.2.2 Canada
- 5.4.2.3 Mexico
- 5.4.3 Europe
- 5.4.3.1 Germany
- 5.4.3.2 United Kingdom
- 5.4.3.3 Italy
- 5.4.3.4 France
- 5.4.3.5 Rest of Europe
- 5.4.4 South America
- 5.4.4.1 Brazil
- 5.4.4.2 Argentina
- 5.4.4.3 Rest of South America
- 5.4.5 Middle East and Africa
- 5.4.5.1 Saudi Arabia
- 5.4.5.2 South Africa
- 5.4.5.3 Rest of Middle East and Africa
- 5.4.1 Asia-Pacific
6 Competitive Landscape
- 6.1 Market Concentration
- 6.2 Strategic Moves
- 6.3 Market Share/Ranking Analysis
- 6.4 Company Profiles (includes Global-level Overview, Market-level Overview, Core Segments, Financials as available, Strategic Information, Market Rank/Share, Products and Services, and Recent Developments)
- 6.4.1 Anhui Sanxing Resin Co., Ltd.
- 6.4.2 Bio-Rad Laboratories, Inc.
- 6.4.3 DOSHION POLYSCIENCE PVT. LTD.
- 6.4.4 DuPont
- 6.4.5 Ecolab
- 6.4.6 Eichrom Technologies, LLC
- 6.4.7 IEI
- 6.4.8 Jacobi Carbons Group
- 6.4.9 LANXESS
- 6.4.10 Mitsubishi Chemical Group Corporation
- 6.4.11 Polymex
- 6.4.12 Pure Resin Co., Ltd.
- 6.4.13 ResinTech, Inc.
- 6.4.14 Samyang Corporation
- 6.4.15 Sunresin New Materials Co., Ltd.
- 6.4.16 Suqing Group
- 6.4.17 Suzhou Bojie Resin Technology Co., Ltd.
- 6.4.18 Thermax Limited
- 6.4.19 Xylem
7 Market Opportunities and Future Outlook
- 7.1 White-space and Unmet-Need Assessment
- 7.2 Growing Demand for Fuel Cells


