

|
시장보고서
상품코드
2122391
가스 발전기 : 시장 점유율 분석, 업계 동향과 통계, 성장 예측(2026-2031년)Gas Generator - Market Share Analysis, Industry Trends & Statistics, Growth Forecasts (2026 - 2031) |
||||||
 Mordor Intelligence
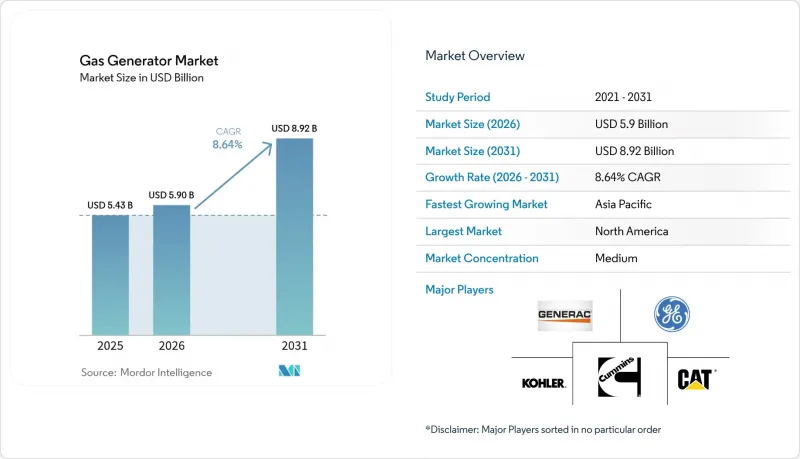
Mordor Intelligence에 의하면, 2026년 가스 발전기 시장 규모는 59억 달러로 추정되며, 2025년 54억 3,000만 달러에서 2031년에는 89억 2,000만 달러에 달할 것으로 예측됩니다.
또한 2026-2031년 연평균 성장률(CAGR)은 8.64%를 기록할 것으로 전망됩니다.
본 보고서는 출력 등급(75 KVA 미만, 75-375 KVA, 375-750 KVA 및 750 KVA 이상), 용도(예비 전원, 피크 부하 완화,프라임/연속 운전), 최종 사용자(산업용, 상업용, 주거용) 및 지역(북미, 유럽, 아시아태평양, 남미, 중동 및 아프리카)별로 분류되어 있습니다. 시장 규모 및 전망은 금액(달러)으로 제시되어 있습니다.
전 세계 가스 발전기 시장 동향 및 인사이트
천연가스 파이프라인 인프라의 급속한 확대
파이프라인망의 확장으로 연료 운송 비용이 절감되어 가스 발전기 시장의 설치 장소 선택의 유연성이 향상되고 있습니다. 미국에서만 해도 2024년에 ‘마운틴 밸리 파이프라인’ 및 ‘퍼미안 테이크어웨이 라인’ 등의 프로젝트를 통해 17.8 Bcf/d의 신규 수송 능력이 추가되어 분산형 자산공급 안정성이 강화되었습니다. 인도에서도 유사한 추세가 나타나고 있으며, 도시 가스 배급망이 서비스가 미치지 못하는 지역으로 확대됨에 따라 2030년까지 국내 수요가 60% 증가할 것으로 전망됩니다. 특히 75-375kVA급 발전기의 경우, 연료의 안정적인 공급은 상업용 및 경공업용 부하에 혜택을 주는 동시에, 예측 가능한 가스 가격에 의존하는 피크 셰이빙 계획의 경제성을 뒷받침하고 있습니다. 지속적인 투자(퍼미안 분지에서 추가로 7.3 Bcf/d가 가동될 예정)로 인해, 성숙한 경제권과 신흥 경제권 모두에서 가스 발전기 시장에 대한 구조적인 호재가 확고해질 것입니다.
디젤 발전기에 비해 낮은 운영 비용과 배출량
천연가스 발전기는 전 세계적인 연료 가격 차이를 활용하고, 오일 교환, 필터 교체 및 후처리 장치 유지보수를 최소화함으로써 운영 비용을 대폭 절감합니다. 사업자는 일반적으로 동급 디젤 발전기에 비해 연간 지출을 20-30% 절감할 수 있으며, 탄소세가 적용되는 지역에서는 이러한 절감 효과가 더욱 커집니다. 캘리포니아주의 Tier 5 비도로용 배출 규제는 규제 동향의 변화를 여실히 보여줍니다. NOx 배출 상한선이 강화됨에 따라 구매자들은 요소 주입이나 미립자 필터 없이도 규제를 준수할 수 있는 가스 모델로 전환하고 있습니다. 따라서 비용 및 배출량 측면에서의 우위 덕분에 산업 단지, 쇼핑몰, 지자체 시설 등에서 도입이 가속화되고 있습니다. 이러한 장소에서는 수명 주기 비용과 환경 성능이 초기 구매 가격만큼이나 중요하게 여겨지고 있습니다.
외딴 지역의 가스 공급망 미비
인구 밀도가 낮은 지역으로의 파이프라인 확장은 여전히 경제성이 없어, 광산, 농장, 또는 섬 등 디젤이나 LPG에 의존하고 있는 지역에서 가스 발전기의 보급을 제한하고 있습니다. 『Energies』지의 종합적인 조사에 따르면, 외딴 지역의 마이크로그리드 계획 담당자들은 파이프라인 연장에 드는 설비 투자를 낮은 부하율로는 회수할 수 없기 때문에 여전히 이동식 연료를 선호하는 것으로 나타났습니다. 북극권에서의 운영에서는 신뢰성 문제에 직면해 있어, 파이프라인에 의존하기보다는 현장에서의 연료 저장이 선호되고 있습니다. 가상 파이프라인이나 소규모 LNG 물류 체계가 구축되지 않는 한, 이러한 지역에서는 75kVA 미만 및 75-375kVA 기종의 보급이 정체되어 있습니다. 그 결과, 가스 발전기 제조업체들은 Off-grid 환경에서 경쟁력을 유지하기 위해 LPG 키트나 태양광 발전·축전지 하이브리드 패키지를 제품과 결합하여 제공해야 합니다.
부문 분석
2025년, 75kVA 미만 등급은 가스 발전기 시장 점유율의 47.10%를 차지하며, 부하가 비교적 가볍고 신속한 설치가 가장 중요시되는 가정 및 소규모 사업 분야에서 우위를 입증했습니다. 대조적으로, 75-375kVA 대역은 최근 정전 건수의 급증에 따라 상업용 건물과 경공업 플랜트가 회복탄력성을 강화하고 있어, 전체 출력 등급 중 가장 빠른 속도인 연평균 성장률(CAGR) 9.62%를 나타낼 것으로 예측됩니다. 375kVA를 초과하는 가스 발전기 시장 규모는 데이터센터나 병원 프로젝트에서 수 메가와트 규모의 블록이 사양으로 채택됨에 따라 확대되고 있지만, 이 등급 전체를 합쳐도 총액으로는 엔트리급 및 중급 부문에 미치지 못하는 상황입니다.
각 제조업체는 병렬 연결이 용이한 모듈식 프레임과 피크 셰이빙 주기에 대응하는 디지털 컨트롤러를 통해 75-375kVA 등급의 제품 라인업을 강화하고 있습니다. 원격 감시를 통해 서비스 방문 횟수가 감소하여 디젤 발전기에 비해 수명 주기 비용이 개선됩니다. 한편, 75kVA 미만의 모델은 영구적인 백업 설비를 위한 배선을 사전에 설치하는 신축 주택 건설 프로그램에서 보급이 확대되고 있으며, 제너렉(Genelac)사와 텍사스주 건설업체간의 제휴 등이 그 예입니다. 모든 정격에서 미래의 수소 혼합 연료에 대응 가능한 연료 유연성 설계는 탈탄소화 목표가 엄격해지는 가운데 자산의 수명을 지키는 데 도움이 됩니다.
지역별 분석
2025년, 북미는 가스 발전기 시장 점유율의 35.05%를 차지했습니다. 이는 세계 최대 규모의 파이프라인망과 디젤 엔진에서 전환을 도모하는 정책에 힘입은 결과입니다. 미국에서만 2024년에 하루 17.8 Bcf 규모의 신규 파이프라인을 가동하여, 계량기 뒤편의 자산에 대해 멕시코만 연안 지역 및 애팔래치아 지역 전역에 충분한 연료를 안정적으로 공급하고 있습니다. 버지니아주와 텍사스주의 데이터센터 클러스터에서는 대기 전원과 피크 부하 완화 역할을 모두 수행하는 수 메가와트급 가스 발전 블록이 활용되고 있는 반면,슈퍼마켓이나 지자체 주유소에서는 폭풍우에 대한 내성을 높이기 위해 150kVA에서 300kVA 규모의 발전 장치가 채택되고 있습니다. 대기질 기준을 충족하지 못하는 카운티에서 디젤 발전기를 단계적으로 폐지하도록 규정한 캘리포니아주의 규제로 인해, 더 깨끗한 스파크 점화식 모델에 대한 투자가 더욱 촉진되어 해당 지역의 선도적 지위가 확고해지고 있습니다.
아시아태평양에서는 파이프라인 확충, LNG 수입, 그리고 산업 현대화가 맞물려 2031년까지 연평균 성장률(CAGR) 9.31%라는 가장 높은 성장률을 나타낼 것으로 예측됩니다. 인도의 천연가스 수요는 2030년까지 60% 증가할 전망이며, 도시 가스 공급망이 현재 지방 도시로까지 확대됨에 따라 375kVA 미만의 설비에 대한 광범위한 수요 기반이 형성되고 있습니다. 중국에서는 공장 자동화로 인해 전력 품질 규정이 엄격해지면서 현장 가스 발전이 유리해지고 있는 반면, 각 성의 장려 프로그램에서는 고효율 열병합 발전(CHP) 설비의 자본 비용 중 최대 20%를 보조하고 있습니다. 일본과 한국에서는 수소 대응 엔진의 실증 시험이 진행되고 있지만, 재수소화 비용이 낮아질 때까지는 백업 및 계통 지원 용도의 주요 연료로 천연가스가 계속 사용될 전망입니다.
유럽에서는 TTF 가격의 급등으로 인해 연료비 경쟁력이 압박받고 있음에도 불구하고, 단계적인 확대가 계속되고 있습니다. 독일과 네덜란드의 에너지 안보 정책이 열병합 발전(CHP) 설비의 개조를 뒷받침하고 있으며, 도시 지역의 소음 제한(65 dB(A))을 충족하는 저소음형 인클로저는 인구 밀도가 높은 도시 지역에서 비즈니스 기회를 확대되고 있습니다. 가스 엔진과 축전지를 결합한 하이브리드 시스템을 통해 시설은 엄격한 계통 연계 시험을 통과하고, 75-375kVA 및 375-750kVA 두 범위 모두에서 수요를 유지할 수 있게 됩니다. 남미, 중동 및 아프리카에서는 새로운 국경을 넘는 파이프라인과 LNG 터미널을 통해 공급이 확대되면서 수주가 가속화되고 있지만, 농촌 지역의 송전망이 미비하여 외딴 주에서의 보급에는 여전히 한계가 있습니다.
기타 혜택:
- 엑셀 형식 시장 예측(ME) 시트
- 3개월간의 애널리스트 지원
자주 묻는 질문
목차
제1장 서론
제2장 조사 방법
제3장 주요 요약
제4장 시장 구도
제5장 시장 규모와 성장 예측
제6장 경쟁 구도
제7장 시장 기회와 향후 전망
LSH 26.09.03According to Mordor Intelligence, gas generator market size in 2026 is estimated at USD 5.9 billion, growing from 2025 value of USD 5.43 billion with 2031 projections showing USD 8.92 billion, growing at 8.64% CAGR over 2026-2031.
This report is Segmented by Power Rating (Below 75 KVA, 75 To 375 KVA, 375 To 750 KVA, and Above 750 KVA), Application (Standby, Peak Shaving, and Prime/Continuous), End-User (Industrial, Commercial, and Residential), and Geography (North America, Europe, Asia-Pacific, South America, and Middle East and Africa). The Market Sizes and Forecasts are Provided in Terms of Value (USD).
Global Gas Generator Market Trends and Insights
Rapid Expansion of Natural-Gas Pipeline Infrastructure
Widening pipeline networks cuts delivered fuel costs and expands siting flexibility for the gas generator market. The United States alone added 17.8 Bcf/d of new capacity in 2024 through projects such as Mountain Valley Pipeline and Permian takeaway lines, reinforcing supply security for distributed assets. India mirrors this trend as city-gas distribution grids expand to underserved districts, supporting a 60% rise in national demand by 2030. Consistent fuel availability, particularly for the 75-375 kVA class, benefits commercial and light-industrial loads, while also underpinning the economics of peak-shaving schemes that rely on predictable gas pricing. Continued investment-another 7.3 Bcf/d set to enter service from the Permian Basin-locks in a structural tailwind for the gas generator market across both mature and emerging economies.
Lower OPEX & Emissions Versus Diesel Gensets
Natural-gas units slash running costs by capitalizing on the global fuel-price gap and by minimizing oil changes, filter swaps, and after-treatment upkeep. Operators typically realize a 20-30% lower annual expenditure compared to comparable diesel sets, a saving that is amplified wherever carbon fees apply. California's Tier 5 off-road rules illustrate the regulatory swing: tougher NOx ceilings push buyers toward gas models that comply without urea injection or particulate filters. The cost-emissions advantage therefore accelerates adoption in industrial parks, shopping malls, and municipal facilities-settings where life-cycle economics and environmental scorecards now matter as much as initial purchase price.
Sparse Gas-Grid Access in Remote Areas
Extending pipelines to low-density territories remains uneconomical, limiting gas generator penetration in areas where mines, farms, or islands rely on diesel or LPG. A comprehensive Energies review shows that remote microgrid planners still prefer transportable fuels because the capital expenditure for pipe extensions cannot be recouped at modest load factors. Arctic operations face reliability challenges that favor on-site fuel storage over reliance on pipelines. Without virtual-pipeline or small-scale LNG logistics, adoption of below-75 kVA and 75-375 kVA stalls in these regions. Consequently, gas-set suppliers must pair offerings with LPG kits or hybrid PV-battery packages to stay relevant off-grid.
Other drivers and restraints analyzed in the detailed report include:
- Backup-Power Boom in Data-Centers & Hospitals
- Extreme-Weather Events Driving Standby Installations
- Volatile Natural-Gas Pricing
For complete list of drivers and restraints, kindly check the Table Of Contents.
Segment Analysis
The <75 kVA class claimed 47.10% of the gas generator market share in 2025, confirming its dominance in homes and small businesses, where modest loads and quick installation are most important. In contrast, the 75-375 kVA band is projected to post a 9.62% CAGR, the fastest pace among all ratings, as commercial buildings and light-industrial plants enhance resilience after recent outage spikes. The gas generator market size for units above 375 kVA is expanding as data center and hospital projects specify multi-megawatt blocks; however, those tiers together still trail the entry and mid-range segments in total value.
Manufacturers strengthen the 75-375 kVA offering through modular frames that parallel easily and through digital controllers that support peak-shaving cycles. Remote monitoring reduces service visits, improving lifetime economics compared to diesel sets. Meanwhile, models below 75 kVA are gaining traction in new-home construction programs that pre-wire for permanent backup, such as Generac's partnership with Texas builders. Across all ratings, fuel-flexible designs that can accept future hydrogen blends help protect asset life as decarbonization targets become tighter.
Complete Report Scope:
- By Power Rating
- Below 75 kVA
- 75 to 375 kVA
- 375 to 750 kVA
- Above 750 kVA
- By Application
- Standby
- Peak Shaving
- Prime/Continuous
- By End-User
- Industrial
- Commercial
- Residential
- By Geography
- North America
- United States
- Canada
- Mexico
- Europe
- Germany
- United Kingdom
- France
- Italy
- NORDIC Countries
- Russia
- Rest of Europe
- Asia Pacific
- China
- India
- Japan
- South Korea
- ASEAN Countries
- Rest of Asia-Pacific
- South America
- Brazil
- Argentina
- Rest of South America
- Middle East and Africa
- Saudi Arabia
- United Arab Emirates
- South Africa
- Egypt
- Rest of Middle East and Africa
- North America
Geography Analysis
North America accounted for 35.05% of the gas generator market share in 2025, driven by the world's largest pipeline grid and a policy shift away from diesel engines. The United States alone placed 17.8 Bcf per day of new pipe in service during 2024, ensuring ample fuel for behind-the-meter assets across the Gulf Coast and Appalachia. Data-center clusters in Virginia and Texas utilize multi-megawatt gas blocks that serve both standby and peak-shaving roles, while supermarkets and municipal pumps employ 150 kVA to 300 kVA frames for storm resilience. California regulations that phase out diesel gensets in non-attainment counties further channel spending toward cleaner spark-ignition models, cementing regional leadership.
The Asia Pacific is projected to post the fastest 9.31% CAGR through 2031, as pipeline build-out, LNG imports, and industrial modernization converge. India's natural-gas demand is set to climb 60% by 2030, and city-gas distribution schemes now reach secondary towns, unlocking a broad base for <375 kVA equipment. In China, factory automation drives tighter power-quality specs that favor on-site gas generation, while provincial incentive programs reimburse up to 20% of capital cost for high-efficiency CHP units. Japan and South Korea pair pilot hydrogen-ready engines, yet natural gas remains the primary fuel for backup and grid-support duties until the costs of reen hydrogen call.
Europe maintains gradual expansion despite high TTF prices that squeeze fuel-cost advantages. Energy-security policies in Germany and the Netherlands are driving combined heat and power retrofits, while silent enclosures that meet 65 dB(A) city limits open up opportunities in densely populated urban districts. Hybrid systems that combine gas engines with battery storage enable facilities to pass stringent grid-interconnection tests, sustaining demand in both the 75-375 kVA and 375-750 kVA ranges. South America and the Middle East & Africa register accelerating orders as new cross-border pipelines and LNG terminals unlock supply, though sparse rural grids still cap penetration in remote provinces.
- Generac Holdings Inc.
- Caterpillar Inc.
- Cummins Inc.
- Kohler Co.
- Mitsubishi Heavy Industries Ltd.
- Atlas Copco AB
- AKSA Power Generation
- Doosan Portable Power
- Briggs & Stratton LLC
- Wacker Neuson SE
- Himoinsa (Sumitomo)
- Yanmar Holdings Co.
- FG Wilson (Caterpillar UK)
- MTU America Inc.
- Pramac Generator S.p.A.
- Wartsila Corp.
- Honda Power Equipment
- Siemens Energy AG
Additional Benefits:
- The market estimate (ME) sheet in Excel format
- 3 months of analyst support
TABLE OF CONTENTS
1 Introduction
- 1.1 Study Assumptions & Market Definition
- 1.2 Scope of the Study
2 Research Methodology
3 Executive Summary
4 Market Landscape
- 4.1 Market Overview
- 4.2 Market Drivers
- 4.2.1 Rapid expansion of natural-gas pipeline infrastructure
- 4.2.2 Lower OPEX & emissions versus diesel gensets
- 4.2.3 Backup-power boom in data-centers & hospitals
- 4.2.4 Extreme-weather events driving standby installations
- 4.2.5 Growth of CHP-ready micro-gas generators
- 4.2.6 Diesel-genset phase-outs in air-quality non-attainment zones
- 4.3 Market Restraints
- 4.3.1 Sparse gas-grid access in remote areas
- 4.3.2 Volatile natural-gas pricing
- 4.3.3 Competition from hydrogen & fuel-cell solutions
- 4.3.4 Tightening urban noise & methane-slip rules
- 4.4 Supply-Chain Analysis
- 4.5 Regulatory Landscape
- 4.6 Technological Outlook
- 4.7 Porters Five Forces
- 4.7.1 Bargaining Power of Suppliers
- 4.7.2 Bargaining Power of Buyers
- 4.7.3 Threat of New Entrants
- 4.7.4 Threat of Substitute Products
- 4.7.5 Intensity of Competitive Rivalry
5 Market Size & Growth Forecasts
- 5.1 By Power Rating
- 5.1.1 Below 75 kVA
- 5.1.2 75 to 375 kVA
- 5.1.3 375 to 750 kVA
- 5.1.4 Above 750 kVA
- 5.2 By Application
- 5.2.1 Standby
- 5.2.2 Peak Shaving
- 5.2.3 Prime/Continuous
- 5.3 By End-User
- 5.3.1 Industrial
- 5.3.2 Commercial
- 5.3.3 Residential
- 5.4 By Geography
- 5.4.1 North America
- 5.4.1.1 United States
- 5.4.1.2 Canada
- 5.4.1.3 Mexico
- 5.4.2 Europe
- 5.4.2.1 Germany
- 5.4.2.2 United Kingdom
- 5.4.2.3 France
- 5.4.2.4 Italy
- 5.4.2.5 NORDIC Countries
- 5.4.2.6 Russia
- 5.4.2.7 Rest of Europe
- 5.4.3 Asia Pacific
- 5.4.3.1 China
- 5.4.3.2 India
- 5.4.3.3 Japan
- 5.4.3.4 South Korea
- 5.4.3.5 ASEAN Countries
- 5.4.3.6 Rest of Asia-Pacific
- 5.4.4 South America
- 5.4.4.1 Brazil
- 5.4.4.2 Argentina
- 5.4.4.3 Rest of South America
- 5.4.5 Middle East and Africa
- 5.4.5.1 Saudi Arabia
- 5.4.5.2 United Arab Emirates
- 5.4.5.3 South Africa
- 5.4.5.4 Egypt
- 5.4.5.5 Rest of Middle East and Africa
- 5.4.1 North America
6 Competitive Landscape
- 6.1 Market Concentration
- 6.2 Strategic Moves (M&A, Partnerships, PPAs)
- 6.3 Market Share Analysis (Market Rank/Share for key companies)
- 6.4 Company Profiles (includes Global level Overview, Market level overview, Core Segments, Financials as available, Strategic Information, Products & Services, and Recent Developments)
- 6.4.1 Generac Holdings Inc.
- 6.4.2 Caterpillar Inc.
- 6.4.3 Cummins Inc.
- 6.4.4 Kohler Co.
- 6.4.5 Mitsubishi Heavy Industries Ltd.
- 6.4.6 Atlas Copco AB
- 6.4.7 AKSA Power Generation
- 6.4.8 Doosan Portable Power
- 6.4.9 Briggs & Stratton LLC
- 6.4.10 Wacker Neuson SE
- 6.4.11 Himoinsa (Sumitomo)
- 6.4.12 Yanmar Holdings Co.
- 6.4.13 FG Wilson (Caterpillar UK)
- 6.4.14 MTU America Inc.
- 6.4.15 Pramac Generator S.p.A.
- 6.4.16 Wartsila Corp.
- 6.4.17 Honda Power Equipment
- 6.4.18 Siemens Energy AG
7 Market Opportunities & Future Outlook
- 7.1 White-space & Unmet-Need Assessment


