

|
시장보고서
상품코드
2122392
산업용 배터리 : 시장 점유율 분석, 산업 동향·통계 데이터, 성장 예측(2026-2031년)Industrial Battery - Market Share Analysis, Industry Trends & Statistics, Growth Forecasts (2026 - 2031) |
||||||
 Mordor Intelligence
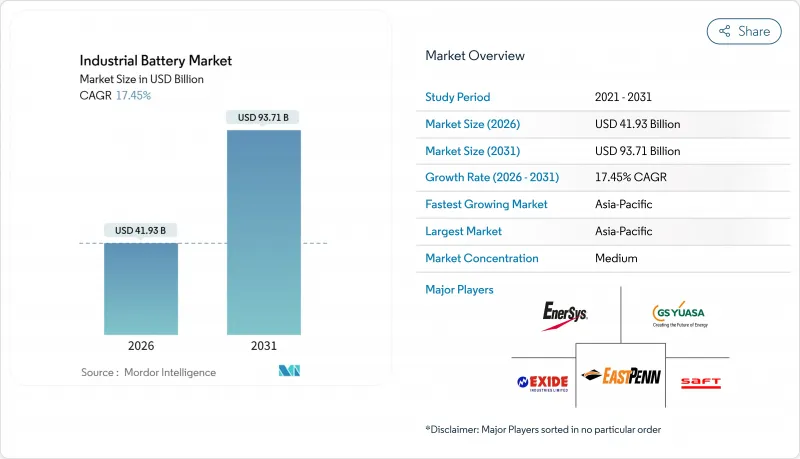
Mordor Intelligence에 따르면 산업용 배터리 시장 규모는 2026년에 419억 3,000만 달러로 추정되고 있으며, 예측 기간(2026-2031년)에 CAGR 17.45%로 확대하며, 2031년에는 937억 1,000만 달러에 달할 것으로 전망되고 있습니다.
이 보고서는 기술별(리튬이온, 납산, 니켈계, 기타), 용도별(지게차·동력 장치, 통신용 백업, UPS/데이터센터, 그리드 규모 ESS, 기타), 최종사용자 산업별(전력·유틸리티, 석유 및 가스,제조·창고업, 통신, 기타) 및 지역(북미, 유럽, 아시아태평양, 남미, 중동 및 아프리카)별로 분류되어 있습니다.
전 세계 산업용 배터리 시장의 동향 및 인사이트
리튬이온 배터리 비용 곡선의 하락
2024년에는 팩 가격이 kWh당 115달러까지 하락했으며, 이는 2017년 이후 가장 급격한 하락세였습니다. 또한 셀에서 팩으로의 통합을 통해 간접비가 절감됨에 따라 주요 은행들은 2026년 말까지 kWh당 80달러 미만으로 떨어질 것으로 예측하고 있습니다. 2024년 초, 중국의 LFP 셀 거래 가격은 kWh당 50-53달러에 달했으며, 유럽과 미국의 경쟁사들은 현지 생산으로 전환하거나 이익률을 양보할 수밖에 없는 상황에 처해 있습니다. 현재 유틸리티 규모의 4시간 시스템은 2035년까지 kWh당 147-243달러에 달할 것으로 예측되어, 통신용 백업 분야에서 납축전지의 총비용 측면에서의 우위가 점차 사라지고 있습니다. 구매자들은 10년간의 수명 주기 분석을 바탕으로 예산을 수립하는 경향이 강해지고 있으며, 열폭주에 대한 우려가 남아 있음에도 불구하고 리튬이온 배터리 주문이 증가하고 있습니다.
재생 가능 에너지를 활용한 ESS 도입 확대
2025년 10월까지 그리드 규모의 배터리 도입량은 전년 대비 38% 증가하여, 2025년 한 해에만 94GW/247 GWh가 추가될 전망입니다. 또한 간헐적인 태양광 및 풍력발전 포트폴리오에 안정화 용량이 필요하므로 2035년까지 220 GW/972GWh로 급증할 전망입니다. 미국에서는 투자 세액 공제 및 주 정부 규제를 배경으로, 2025년에 18.2GW 규모의 에너지 저장 설비 도입이 계획되어 있습니다. 중국에서는 각 성의 규정에 따라 신규 재생에너지 발전소에 10-20%의 에너지 저장 설비 병설이 의무화되어 단기적인 수요를 창출하고 있지만, 차익 거래 상한선 설정으로 인해 수익성은 불투명합니다. 인도에서는 재생에너지 비중이 높은 송전망을 안정화하기 위해 2026년까지 4GWh 규모의 독립형 에너지 저장 설비 도입을 목표로 하고 있습니다. 유럽에서는 주파수 조절을 통한 프리미엄이 배터리 업계에 여전히 매력적이지만, 2028년 이후에는 상호 연결 선로의 확장으로 인해 스프레드가 축소될 가능성이 있습니다.
중요 광물의 가격 변동
탄산리튬 가격은 2022년 정점 대비 75% 급락했으나, 2025년에는 재고 소진과 견고한 수요가 겹치며 다시 공급이 타이트해졌습니다. 이로 인해 계약 협상 및 현금 흐름 계획에 불확실성이 발생하고 있습니다. 중국은 음극재의 90% 이상, 양극재의 85%를 가공하고 있으며, 이로 인해 유럽과 미국의 구매자들에게 지정학적 리스크가 높아지고 있습니다. 정제 인산 및 고순도 망간 황산의 공급 병목 현상은 분기 내에 원자재 비용을 2배로 치솟게 할 수 있으며, 구매자들은 조달 주기를 단축하고 운전 자금의 여유분을 늘리도록 압박받고 있습니다. 미국의 전략 비축은 가격보다는 안보 목적을 위한 것으로, 현물 시장의 공급을 제한할 가능성이 있습니다.
부문별 분석
리튬이온 배터리는 2025년에 매출의 51.26%를 차지하며, 2031년까지 연평균 성장률(CAGR) 18.56%로 확대될 것으로 예측되며, 산업용 배터리 시장에서 주도적인 입지를 공고히 하고 있습니다. 납축전지가 전통적으로 차지하며 온 통신 및 시동·조명 틈새 시장은 구매자들이 제품 수명 기간 중의 총 비용을 중시함에 따라 축소되고 있습니다. 니켈계 배터리는 항공우주 및 철도 분야에서 여전히 중요한 위치를 차지하고 있지만, 판매량이 정체되는 추세는 리튬이온 배터리의 온도 범위가 확대된 것을 반영하고 있습니다.
신규 기술인 나트륨 이온 배터리는 희귀한 리튬 대신 풍부하게 존재하는 나트륨을 사용함으로써 LFP(인산철리튬)에 비해 20-30%의 비용 절감이 기대됩니다. 한편, 바나듐 레독스 플로우 배터리는 6시간 이상의 방전 지속 시간으로 주목을 받고 있습니다. 고체 전지의 프로토타입은 여전히 리튬이온 전지보다 3-5배의 비용이 들기 때문에 대부분의 산업용 구매자들은 도입을 결정하기보다는 상황을 지켜보는 태도를 취하고 있습니다. 재활용 규제로 인해 유럽에서는 납축전지의 퇴출이 가속화되고 있으며, 투자는 수익성이 높은 리튬계 제품 라인으로 이동하고 있습니다.
지역별 분석
아시아태평양은 2025년에 매출의 49.92%를 차지하며 산업용 배터리 시장을 독점하고 있으며, 2031년까지 연평균 19.53%의 성장률을 보일 것으로 전망됩니다. 중국은 전 세계 배터리 생산량의 85%를 차지하고 있으며, 신규 재생에너지 시설에 10-20%의 에너지 저장 설비 설치 의무화가 수요를 지원하고 있습니다. 한편, 인도에서는 24억 달러 규모의 ‘생산 연계 인센티브(PLI)’를 통해 50GWh의 국내 생산 능력을 유치하고 있습니다. 한국의 LG 에너지솔루션과 삼성SDI는 합계 520GWh를 넘는 생산 능력을 보유하고 있으며, 북미와 유럽으로 수출하고 있습니다. 일본은 자동차용 및 틈새 산업용 고니켈 배터리에 계속해서 주력하고 있습니다.
북미에서는 kWh당 35달러의 생산 세액 공제와 2022년 이후 30개 이상의 기가팩토리 건설이 발표되었으며, 2030년까지 1TWh의 생산 능력을 목표로 하고 있습니다. 캐나다는 풍부한 광물 자원을 바탕으로 유럽과 미국에 대한 대체 거점으로서의 위상을 확립하고 있지만, 정련 능력은 채굴 능력을 따라가지 못하고 있습니다. 멕시코는 조립 투자를 유치하고 있지만, 인허가 절차의 병목 현상에 직면해 있습니다.
유럽의 ‘중요 원자재법’은 2030년까지 국내 조달률 10%, 현지 가공률 40%를 목표로 하고 있으며, Northvolt, ACC, CATL의 유럽 생산 라인을 지원하고 있습니다. 독일, 프랑스, 영국은 주파수 조정용 에너지 저장 분야를 선도하고 있으나, 상호 연결선 확장으로 인해 2028년 이후에는 이익률에 압박이 가해질 가능성이 있습니다. 북유럽의 수력 발전은 에너지 집약적인 양극재 합성을 유치하고 있으나, 수율 문제로 인해 생산 확대 속도가 둔화되고 있습니다.
남미 및 중동 및 아프리카는 여전히 발전 단계에 있으며, 브라질과 아랍에미리트(UAE)에서는 유틸리티 규모의 프로젝트가 시범적으로 진행되고 있지만, 제조 능력이 제한적이어서 아시아태평양이나 북미에 비해 규모는 여전히 작은 상태입니다.
기타 혜택:
- Excel 형식의 시장 예측(ME) 시트
- 3개월간의 애널리스트 지원
자주 묻는 질문
목차
제1장 서론
제2장 분석 방법
제3장 개요
제4장 시장 구도
제5장 시장 규모·성장률 예측
제6장 경쟁 구도
제7장 시장 기회와 향후 전망
KSA 26.09.07According to Mordor Intelligence, the industrial battery market size is estimated at USD 41.93 billion in 2026, and is expected to reach USD 93.71 billion by 2031, at a CAGR of 17.45% during the forecast period (2026-2031).
This report is Segmented by Technology (Lithium-Ion, Lead-Acid, Nickel-Based, and Others), Application (Forklift and Motive Power, Telecom Backup, UPS/Data Centres, Grid-Scale ESS, and Others), End-User Industry (Power and Utilities, Oil and Gas, Manufacturing and Warehousing, Telecom, and Others), and Geography (North America, Europe, Asia-Pacific, South America, and Middle East and Africa).
Global Industrial Battery Market Trends and Insights
Declining Lithium-Ion Battery Cost Curve
Pack prices slid to USD 115 per kWh in 2024, the sharpest drop since 2017, and major banks forecast sub-USD 80 per kWh by late 2026 as cell-to-pack integration cuts overhead. Chinese LFP cells traded at USD 50-53 per kWh in early 2024, forcing Western rivals to localize or cede margin. Utility-scale four-hour systems are now modeled to reach USD 147-243 per kWh by 2035, eroding lead-acid's total-cost supremacy in telecom backup. Buyers increasingly align budgets to ten-year life-cycle analyses, tilting orders toward lithium-ion despite residual thermal-runaway concerns.
Renewable-Powered ESS Build-Outs
Grid-scale battery additions rose 38% year-over-year to October 2025 and are set to add 94 GW/247 GWh in 2025 alone, jumping to 220 GW/972 GWh by 2035 as intermittent solar and wind portfolios require firming capacity. The United States plans 18.2 GW of storage in 2025, benefiting from investment-tax credits and state mandates. China's provincial rules force new renewables to pair 10-20% storage, creating near-term demand, although capped arbitrage margins cloud profitability. India targets 4 GWh of standalone storage by 2026 to stabilize high-renewable grids. Europe's frequency-regulation premiums remain attractive for batteries, though interconnector growth could compress spreads after 2028.
Critical-Mineral Price Volatility
Lithium carbonate plunged 75% from its 2022 peak, then tightened again in 2025 as inventory destocking met robust demand, unsettling contract negotiations and cash-flow planning. China processes more than 90% of anode materials and 85% of cathodes, amplifying geopolitical exposure for Western buyers. Supply bottlenecks in purified phosphoric acid and high-purity manganese sulfate can double input costs within a quarter, prompting buyers to shorten procurement cycles and raise working-capital buffers. U.S. strategic stockpiles address security rather than price, and may constrict spot availability.
Other drivers and restraints analyzed in the detailed report include:
- Warehouse Automation & AGVs Surge
- DC Micro-Grids in Data Centres
- Lead-Acid Pollution Regulations
For complete list of drivers and restraints, kindly check the Table Of Contents.
Segment Analysis
Lithium-ion held 51.26% revenue in 2025 and is projected to compound at 18.56% to 2031, solidifying its leadership in the industrial battery market. Lead-acid's legacy telecom and starter-lighting niches shrink as buyers weigh total cost over calendar life. Nickel-based chemistries stay relevant in aerospace and rail, yet flat volumes reflect lithium-ion's broadened temperature range.
Emerging sodium-ion cells promise 20-30% cost savings versus LFP by swapping abundant sodium for scarce lithium, while vanadium redox flow batteries gain traction for six-hour-plus discharge durations. Solid-state prototypes remain three-to-five-times costlier than lithium-ion, prompting most industrial buyers to monitor rather than commit. Recycling mandates accelerate lead-acid's retreat in Europe, redirecting investment to higher-margin lithium-based lines.
Complete Report Scope:
- By Technology
- Lithium-ion
- Lead-acid
- Nickel-based
- Others (incl. Flow Battery, Sodium-ion)
- By Application
- Forklift and Motive Power
- Telecom Backup
- UPS/Data Centres
- Grid-Scale ESS
- Others (incl Automated Guided Vehicles, Rail and Marine)
- By End-User Industry
- Power and Utilities
- Oil and Gas
- Manufacturing and Warehousing
- Telecom
- Others (incl Transportation and Logistics)
- By Geography
- North America
- United States
- Canada
- Mexico
- Europe
- Germany
- France
- United Kingdom
- Italy
- Spain
- Nordic Countries
- Russia
- Rest of Europe
- Asia-Pacific
- China
- Japan
- India
- South Korea
- ASEAN Countries
- Rest of Asia-Pacific
- South America
- Brazil
- Argentina
- Rest of South America
- Middle East and Africa
- United Arab Emirates
- Saudi Arabia
- South Africa
- Rest of Middle East and Africa
- North America
Geography Analysis
Asia-Pacific dominated the industrial battery market with 49.92% revenue in 2025 and will grow at 19.53% through 2031. China's 85% share of global cell output and mandatory 10-20% storage pairing for new renewables spur demand, while India's USD 2.4 billion Production-Linked Incentive lures 50 GWh of domestic capacity. South Korea's LG Energy Solution and Samsung SDI exceed 520 GWh of combined capacity, exporting to North America and Europe. Japan remains focused on high-nickel cells for automotive and niche industrial uses.
North America benefits from a USD 35 per kWh production credit and 30+ gigafactory announcements since 2022, targeting 1 TWh of capacity by 2030. Canada's mineral endowment positions it as a Western alternative, although refining lags extraction. Mexico attracts assembly investments but faces permitting bottlenecks.
Europe's Critical Raw Materials Act seeks 10% domestic sourcing and 40% local processing by 2030, supporting Northvolt, ACC, and CATL's European lines. Germany, France, and the U.K. lead in frequency-regulation storage, though expanded interconnectors may pressure margins after 2028. Nordic hydropower attracts energy-intensive cathode synthesis, yet yield challenges slow ramp-ups.
South America and the Middle East-Africa remain nascent, with Brazil and the U.A.E. piloting utility-scale projects, but limited manufacturing keeps scale small relative to Asia-Pacific and North America.
- EnerSys
- East Penn Manufacturing
- Exide Industries
- GS Yuasa Corp.
- Saft Groupe SA
- Amara Raja Batteries
- Panasonic Energy
- CATL
- BYD Co. Ltd.
- LG Energy Solution
- Samsung SDI
- Johnson Controls
- Leoch Int'l
- JYC Battery
- Narada Power
- Crown Battery
- Hoppecke Batteries
- NorthStar Battery
- Trojan Battery
- Vision Group
Additional Benefits:
- The market estimate (ME) sheet in Excel format
- 3 months of analyst support
TABLE OF CONTENTS
1 Introduction
- 1.1 Study Assumptions & Market Definition
- 1.2 Scope of the Study
2 Research Methodology
3 Executive Summary
4 Market Landscape
- 4.1 Market Overview
- 4.2 Market Drivers
- 4.2.1 Declining lithium-ion battery cost curve
- 4.2.2 Renewable-powered ESS build-outs
- 4.2.3 Warehouse automation & AGVs surge
- 4.2.4 DC micro-grids in data centres
- 4.2.5 Telecom tower storage mandates
- 4.2.6 OEM-driven 2nd-life leasing models
- 4.3 Market Restraints
- 4.3.1 Critical-mineral price volatility
- 4.3.2 Lead-acid pollution regulations
- 4.3.3 Solid-state tech "wait-and-see" effect
- 4.3.4 Rising BESS fire-risk insurance costs
- 4.4 Battery/Raw-Material Price Trends & Forecast
- 4.5 Import and Export Analysis
- 4.6 Supply-Chain Analysis
- 4.7 Regulatory Landscape
- 4.8 Technological Outlook
- 4.9 Porter's Five Forces
- 4.9.1 Bargaining Power of Suppliers
- 4.9.2 Bargaining Power of Buyers
- 4.9.3 Threat of New Entrants
- 4.9.4 Threat of Substitutes
- 4.9.5 Competitive Rivalry
5 Market Size & Growth Forecasts
- 5.1 By Technology
- 5.1.1 Lithium-ion
- 5.1.2 Lead-acid
- 5.1.3 Nickel-based
- 5.1.4 Others (incl. Flow Battery, Sodium-ion)
- 5.2 By Application
- 5.2.1 Forklift and Motive Power
- 5.2.2 Telecom Backup
- 5.2.3 UPS/Data Centres
- 5.2.4 Grid-Scale ESS
- 5.2.5 Others (incl Automated Guided Vehicles, Rail and Marine)
- 5.3 By End-User Industry
- 5.3.1 Power and Utilities
- 5.3.2 Oil and Gas
- 5.3.3 Manufacturing and Warehousing
- 5.3.4 Telecom
- 5.3.5 Others (incl Transportation and Logistics)
- 5.4 By Geography
- 5.4.1 North America
- 5.4.1.1 United States
- 5.4.1.2 Canada
- 5.4.1.3 Mexico
- 5.4.2 Europe
- 5.4.2.1 Germany
- 5.4.2.2 France
- 5.4.2.3 United Kingdom
- 5.4.2.4 Italy
- 5.4.2.5 Spain
- 5.4.2.6 Nordic Countries
- 5.4.2.7 Russia
- 5.4.2.8 Rest of Europe
- 5.4.3 Asia-Pacific
- 5.4.3.1 China
- 5.4.3.2 Japan
- 5.4.3.3 India
- 5.4.3.4 South Korea
- 5.4.3.5 ASEAN Countries
- 5.4.3.6 Rest of Asia-Pacific
- 5.4.4 South America
- 5.4.4.1 Brazil
- 5.4.4.2 Argentina
- 5.4.4.3 Rest of South America
- 5.4.5 Middle East and Africa
- 5.4.5.1 United Arab Emirates
- 5.4.5.2 Saudi Arabia
- 5.4.5.3 South Africa
- 5.4.5.4 Rest of Middle East and Africa
- 5.4.1 North America
6 Competitive Landscape
- 6.1 Market Concentration
- 6.2 Strategic Moves (M&A, Partnerships, PPAs)
- 6.3 Market Share Analysis (Market Rank/Share for key companies)
- 6.4 Company Profiles (includes Global level Overview, Market level overview, Core Segments, Financials as available, Strategic Information, Products & Services, and Recent Developments)
- 6.4.1 EnerSys
- 6.4.2 East Penn Manufacturing
- 6.4.3 Exide Industries
- 6.4.4 GS Yuasa Corp.
- 6.4.5 Saft Groupe SA
- 6.4.6 Amara Raja Batteries
- 6.4.7 Panasonic Energy
- 6.4.8 CATL
- 6.4.9 BYD Co. Ltd.
- 6.4.10 LG Energy Solution
- 6.4.11 Samsung SDI
- 6.4.12 Johnson Controls
- 6.4.13 Leoch Int'l
- 6.4.14 JYC Battery
- 6.4.15 Narada Power
- 6.4.16 Crown Battery
- 6.4.17 Hoppecke Batteries
- 6.4.18 NorthStar Battery
- 6.4.19 Trojan Battery
- 6.4.20 Vision Group
7 Market Opportunities & Future Outlook
- 7.1 White-space & Unmet-Need Assessment


