|
시장보고서
상품코드
2122398
슈퍼컴퓨터 시장 : 시장 점유율 분석, 업계 동향 및 통계 데이터, 성장 예측(2026-2031년)Supercomputers - Market Share Analysis, Industry Trends & Statistics, Growth Forecasts (2026 - 2031) |
||||||
 Mordor Intelligence
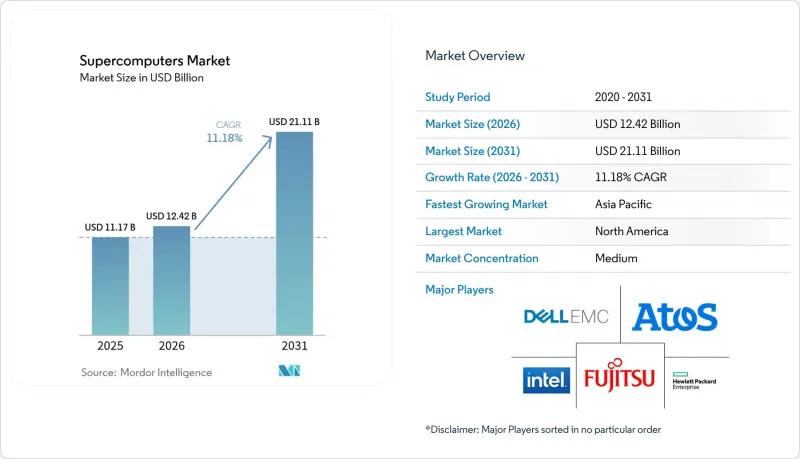
Mordor Intelligence에 의하면, 2026년 슈퍼컴퓨터 시장 규모는 124억 2,000만 달러로 추정되고, 2025년 111억 7,000만 달러에서 확대해, 2031년에는 211억 1,000만 달러에 이를 것으로 예측됩니다.
2026-2031년 연평균 성장률(CAGR)은 11.18%를 나타낼 전망입니다.
본 보고서는 구성 요소별(프로세서(CPU), 가속기(GPU/ASIC) 등), 시스템 유형별(클러스터형, 초병렬 처리(MPP) 등), 배포 방식별(온프레미스, 클라우드 등), 처리 규모별(페타스케일, 프리엑사스케일,엑사스케일), 최종 사용자별(정부·국방, 학술·연구 등), 그리고 지역별로 분류되어 있습니다. 시장 전망은 금액(달러)으로 표시되어 있습니다.
세계의 슈퍼컴퓨터 시장 동향 및 인사이트
엑사스케일 경쟁에 따른 공공 자금의 급증
미국, 유럽, 중국, 일본의 대규모 프로그램은 현재의 페타스케일급 시스템을 10배 이상 능가하는 차세대 시스템에 자금을 지원하고 있습니다. 미국 에너지부의 ‘디스커버리(Discovery)’ 시스템은 ‘프론티어(Frontier)’의 처리량보다 3-5배를 목표로 하고 있는 반면, 유럽의 ‘유로HPC 공동 사업(EuroHPC Joint Undertaking)’은 지역별 연구의 자율성을 뒷받침하는 분산형 엑사스케일 네트워크에 자금을 지원하고 있습니다. 하드웨어, 소프트웨어, 전문 서비스를 패키지로 제공할 수 있는 벤더는 장기 계약을 확보할 수 있으며, 초기 도입 후에도 수익 전망이 보장됩니다. 대학들이 최첨단급 시스템을 요구함에 따라 학술 기관 간의 입찰 경쟁이 격화되고 있으며, 이로 인해 중소 공급업체를 국가 프로그램에 참여시키는 제2 수요층이 형성되고 있습니다.
HPC 시스템에서의 AI/ML 워크로드 확산
AI 추론 및 훈련은 이제 기존 HPC 센터에 널리 보급되어, 아키텍트는 고대역폭 메모리와 이기종 컴퓨팅 서브시스템을 통합할 수밖에 없게 되었습니다. NVIDIA의 H100 및 AMD의 MI300X 가속기는 신규 조달 시 표준 품목이 되었으며, 이는 AI 계층이 피크 FLOPS 요구 사항을 얼마나 주도하고 있는지를 반영합니다. 금융 기관은 리스크 분석을 위해 초저지연 클러스터를 도입하고 있으며, 생명과학 기업들은 신약 개발 파이프라인에 멀티노드 GPU 랙을 활용하고 있습니다. 이러한 변화는 소프트웨어 생태계를 재구성하고 있으며, 컴파일러, 스케줄러, 라이브러리는 텐서 코어 및 희소 행렬 연산을 위해 최적화되어야 합니다. 턴키 방식의 AI-HPC 솔루션을 제공하는 시스템 통합사업자들은 지속적으로 높은 수익률을 보이는 서비스 계약을 수주하고 있습니다.
데이터센터의 전력 및 냉각 비용 급증
엑사스케일급 시스템은 일반적으로 20-40 MW의 전력을 소비하며, 이는 불과 5년 전 배정되었던 예산을 훨씬 초과하는 수치입니다. 공기 냉각이 한계에 다다른 가운데, 액체 냉각 및 침지 냉각은 시험 단계에서 주류로 전환되고 있습니다. 시스템 수명 주기 전반에 걸쳐 에너지 비용이 하드웨어 상각비를 초과하는 사례가 빈번하게 나타나고 있어, 운영 사업자들은 장기 전력 구매 계약 협상을 피할 수 없게 되었습니다. 각 벤더사는 ‘와트당 성능’이라는 지표로 차별화를 꾀하고 있으며, 열 부하를 억제하는 치플릿(chiplet) 및 광 인터커넥트에 대한 연구 개발이 촉진되고 있습니다. 친환경 데이터센터에 대한 정책적 인센티브가 입지 선정에 영향을 미치며, 신규 건설은 재생에너지가 과잉 공급되는 지역으로 이동하고 있습니다.
부문 분석
2025년, 가속기는 슈퍼컴퓨터 시장 규모 중 14억 5,000만 달러를 차지한 것으로 평가되었으며, 2031년까지 연평균 성장률(CAGR) 15.05%를 유지할 것으로 전망됩니다. GPU 및 맞춤형 ASIC은 기존의 부동소수점 연산에 더해 AI 추론도 담당하게 되면서, 랙당 평균 발열량이 40kW에서 80kW로 증가하고 있습니다. 메모리 공급업체들은 HBM3E 수요에 대응하는 데 어려움을 겪고 있어, 2025년의 많은 건설 프로젝트에 제약이 발생하고 있습니다. 스토리지 시장은 NVMe over Fabrics로 전환되면서, 데이터 양이 많은 워크로드에서 발생하는 I/O 병목 현상이 해소될 것입니다.
프로세서는 2025년에도 슈퍼컴퓨터 시장에서 38.67%의 점유율을 유지했으나, 고객이 가속기에 더 많은 예산을 할당함에 따라 단위 매출 성장세가 둔화되고 있습니다. 각 벤더들은 GPU에 일관되게 연결되는 칩렛 기반 설계로 전환하고 있으며, 이를 위해서는 통합된 메모리 세미언틱스가 요구됩니다. 소프트웨어 및 서비스는 여전히 가장 높은 수익률을 보이는 분야이며, 최적화 계약은 하드웨어 수명 주기보다 더 오랜 기간 지속됩니다. 상호 연결 매출은 노드 수와 연동하여 증가하고 있으며, 800Gbps 이더넷 레인과 400Gbps 인피니밴드가 차세대 토폴로지의 백본을 형성하고 있습니다.
2025년 슈퍼컴퓨터 시장 규모 중 클러스터 기반 아키텍처는 44억 4,000만 달러를 차지했으며, 표준화로 인해 조달이 용이해짐에 따라 39.74%의 점유율을 유지하고 있습니다. 한편, 이기종 시스템은 연평균 성장률(CAGR) 15.56%로 성장을 지속하고, 있으며, CPU, GPU 및 전용 가속기를 단일 스케줄러 아래로 통합함으로써 AI 및 시뮬레이션 워크로드에 유연하게 대응하고 있습니다. 격자 QCD나 기상 모델 등 극히 많은 노드 수가 필요한 분야에서는 대규모 병렬 처리가 여전히 필수적입니다.
SYCL이나 OpenMP의 오프로드 명령어와 같은 소프트웨어 프레임워크는 다양한 칩에 걸친 개발 프로세스를 원활하게 하고 활용도를 높이고 있습니다. 고밀도 GPU와 CPU를 풍부하게 탑재한 헤드 노드를 조합한 제품을 제공하는 벤더는 듀얼 퍼포스 클러스터를 원하는 연구시설 수요를 타고 있습니다. 벡터 시스템은 틈새 분야이긴 하지만, 유전체 정렬이나 실시간 리스크 계산 작업에서 새로운 중요성을 띠고 있습니다.
지역별 분석
북미는 2025년 매출의 41.08%를 차지했습니다. 이는 미국이 ‘엘 캐피탄’의 자매 프로젝트인 ‘디스커버리’를 포함한 수십억 달러 규모의 엑사스케일 프로젝트에 대한 자금 지원을 지속했기 때문입니다. 캐나다에서 클라우드 기반 연구 보조금이 도입됨에 따라 대학계 스타트업의 접근성이 확대되었습니다. 하이퍼스케일 제공업체들은 AI 집약형 인스턴스 유형을 활용하여 지역 가용성 영역을 업그레이드함으로써, 관리형 서비스 계약을 둘러싼 시스템 통합사업자 간의 경쟁을 심화시켰습니다.
연평균 성장률(CAGR) 12.55%로 성장하고 있는 아시아태평양은 중국의 국내 조달형 페타스케일 구축과, 2030년까지 현재 성능의 5-10배를 목표로 하는 일본의 ‘후가쿠 NEXT’ 로드맵의 혜택을 받고 있습니다. 인도는 디지털 공공 인프라 구축 사업을 확대하고 있으며, 지역적 컴퓨팅 주권이 필요한 유전체학 및 기후 변화 관련 용도에 자금을 배정하고 있습니다. 호주와 싱가포르는 지역적 지구 시스템 허브에 대한 공동 자금 조달을 통해 중규모 클러스터에 대한 수요를 뒷받침하고 있습니다.
유럽에서는 독일, 핀란드, 이탈리아에 컴퓨팅 능력을 배분하는 ‘EuroHPC 컨소시엄’의 보조금을 통해 꾸준한 성장을 유지하고 있습니다. 주권 조항에 따라 구매자는 EU가 개발한 소프트웨어 스택과 결합된 개방형 아키텍처의 하드웨어를 선택해야 합니다. 에너지 가격 변동으로 인해 북유럽 국가들에서는 데이터센터 건설이 가속화되고 있으며, 저탄소 수력발전을 활용하여 상업 및 공공 연구 양쪽을 목적으로 하는 노드를 호스팅하고 있습니다. 중동에서는 사우디아라비아의 ‘HUMAIN’과 같은 AI 팩토리에 자금을 지원하여, 탄화수소에 의존하지 않는 경제 다각화를 도모하고 있습니다. 남미에서는 40억 달러 규모의 브라질 이니셔티브를 통해 TOP500 목록에서 해당 지역의 순위가 상승했으며, 전 세계 학술 파트너들과의 협력이 시작되고 있습니다.
기타 혜택 :
- Excel 형식 시장 예측(ME) 시트
- 3개월간의 애널리스트 지원
자주 묻는 질문
목차
제1장 서론
제2장 분석 방법
제3장 주요 요약
제4장 시장 구도
제5장 시장 규모 및 성장률 예측
제6장 경쟁 구도
제7장 시장 기회 및 향후 전망
AJY 26.09.09According to Mordor Intelligence, the supercomputer market size in 2026 is estimated at USD 12.42 billion, growing from 2025 value of USD 11.17 billion with 2031 projections showing USD 21.11 billion, growing at 11.18% CAGR over 2026-2031.
This report is Segmented by Component (Processor (CPU), Accelerators (GPU/ASIC), and More), System Type (Cluster-Based, Massively Parallel Processing (MPP), and More), Deployment Mode (On-Premises, Cloud-Based and More), Processing Scale (Petascale, Pre-Exascale, Exascale), End-User (Government and Defense, Academic and Research and More), and Geography. The Market Forecasts are Provided in Terms of Value (USD).
Global Supercomputers Market Trends and Insights
Race-to-Exascale Public Funding Surge
Large-scale programs in the United States, Europe, China, and Japan fund next-generation systems that outpace today's petascale machines by factors of 10 or more. The U.S. Department of Energy's Discovery system targets 3-5 times Frontier's throughput, while Europe's EuroHPC Joint Undertaking funds a distributed exascale network that underpins regional research autonomy. Vendors able to bundle hardware, software, and professional services capture longer contracts, assuring revenue visibility beyond initial installations. Academic bidding has intensified as universities seek leadership-class machines, creating a second tier of demand that sweeps smaller suppliers into national programs.
Proliferation of AI/ML Workloads on HPC Systems
AI inference and training now permeate traditional HPC centers, compelling architects to integrate high-bandwidth memory and heterogeneous compute subsystems. NVIDIA's H100 and AMD's MI300X accelerators have become standard line-items in new procurements, reflecting how AI layers drive peak-flops requirements. Financial institutions deploy ultra-low-latency clusters for risk analytics, while life-science firms exploit multi-node GPU racks for drug-discovery pipelines. The shift reshapes software ecosystems; compilers, schedulers, and libraries must optimize for tensor cores and sparsity-aware operations. System integrators that deliver turnkey AI-HPC solutions consistently win higher-margin service deals.
Ballooning Datacenter Power and Cooling Costs
Exascale machines regularly draw 20-40 MW, dwarfing budgets allocated only five years ago. Liquid and immersion cooling migrate from pilot to mainstream as air-cooling plateaus. Energy frequently surpasses amortized hardware costs over system lifetimes, forcing operators to negotiate long-term power-purchase contracts. Vendors differentiate on performance per watt metrics, spurring R&D into chiplets and optical interconnects that curb thermal footprints. Policy incentives for green datacenters influence site-selection, pushing new builds toward regions with renewable-energy surpluses.
Other drivers and restraints analyzed in the detailed report include:
- Demand for Climate and Biomedical Simulations Post-COVID
- Rising Availability of Cloud-based "HPC-as-a-Service"
- Advanced-Node Chip Supply-Chain Fragility
For complete list of drivers and restraints, kindly check the Table Of Contents.
Segment Analysis
Accelerators commanded USD 1.45 billion of the supercomputer market size in 2025, upholding 15.05% CAGR projections through 2031. GPUs and custom ASICs shoulder AI inferencing alongside traditional floating-point simulations, lifting average rack-level heat from 40 kW to 80 kW. Memory vendors struggle to meet HBM3E demand, constraining many 2025 builds. Storage transitions to NVMe over Fabrics, shrinking I/O bottlenecks in data-rich workloads.
Processors retained 38.67% supercomputer market share in 2025, yet face slowing unit revenues as customers allocate larger budgets to accelerators. Vendors pivot to chiplet-based designs that attach coherently to GPUs, calling for unified memory semantics. Software and Services remains the highest-margin slice, where optimization contracts outlive hardware cycles. Interconnect revenue grows in lockstep with node counts, with 800 Gbps Ethernet lanes and 400 Gbps InfiniBand forming the backbone of next-generation topologies.
Cluster-based architectures represented USD 4.44 billion of the supercomputer market size in 2025, sustaining their 39.74% share as standardization eases procurement. Meanwhile, heterogeneous systems post 15.56% CAGR, bundling CPUs, GPUs, and purpose-built accelerators under a single scheduler to flex across AI and simulation workloads. Massively parallel processing remains essential for lattice-QCD and weather models that crave extreme node counts.
Software frameworks such as SYCL and OpenMP offload directives pave smoother development paths across diverse chips, raising utilization rates. Vendors that package high-density GPUs with CPU-rich head nodes ride demand from research facilities seeking dual-purpose clusters. Vector systems, though niche, find renewed relevance in genomic alignment and real-time risk-calculation tasks.
Complete Report Scope:
- By Component
- Processor (CPU)
- Accelerators (GPU/ASIC)
- Memory
- Storage
- Interconnect
- Software and Services
- By System Type
- Cluster-Based
- Massively Parallel Processing (MPP)
- Accelerated / Heterogeneous
- Vector
- By Deployment Mode
- On-Premises
- Cloud-based (HPC-aaS)
- Hybrid
- By Processing Scale
- Petascale
- Pre-Exascale
- Exascale
- By End-user
- Government and Defense
- Academic and Research Institutes
- Financial Services
- Healthcare and Life Sciences
- Manufacturing and Industrial
- Energy and Utilities
- By Geography
- North America
- United States
- Canada
- Mexico
- Europe
- Germany
- United Kingdom
- France
- Russia
- Rest of Europe
- Asia-Pacific
- China
- Japan
- India
- South Korea
- Australia
- Rest of Asia-Pacific
- Middle East and Africa
- Middle East
- Saudi Arabia
- United Arab Emirates
- Rest of Middle East
- Africa
- South Africa
- Egypt
- Rest of Africa
- Middle East
- South America
- Brazil
- Argentina
- Rest of South America
- North America
Geography Analysis
North America commanded 41.08% of 2025 revenue as the United States continued to bankroll multi-billion-dollar exascale projects, including the Discovery companion to El Capitan. Canada's adoption of cloud-based research grants broadened access for university-affiliated startups. Hyper-scale providers upgraded regional availability zones with AI-intensive instance types, heightening competition among system integrators for managed-services contracts.
Asia-Pacific, advancing at 12.55% CAGR, benefits from China's domestically sourced petascale rollouts and Japan's Fugaku NEXT roadmap targeting 5-10 times current performance by 2030. India expands digital public-infrastructure missions, earmarking funds for genomics and climate applications that require localized compute-sovereignty. Australia and Singapore co-finance regional Earth-systems hubs, bolstering demand for mid-range clusters.
Europe maintains steady growth through EuroHPC Joint Undertaking grants that distribute capacity across Germany, Finland, and Italy. Sovereignty clauses push buyers toward open-architecture hardware combined with EU-developed software stacks. Energy-price volatility spurs Nordic data-center builds, leveraging low-carbon hydroelectricity to host dual-purpose commercial and public-research nodes. The Middle East funds AI factories, such as Saudi Arabia's HUMAIN, to diversify economies beyond hydrocarbons. South America's USD 4 billion Brazilian initiative elevates regional rank on TOP500 lists and opens collaboration with academic partners worldwide.
- Hewlett Packard Enterprise Company
- Lenovo Group Limited
- Dell Technologies Inc.
- Fujitsu Limited
- Atos SE
- International Business Machines Corporation
- NEC Corporation
- Intel Corporation
- Advanced Micro Devices, Inc.
- NVIDIA Corporation
- Sugon Information Industry Co., Ltd.
- Inspur Group Co., Ltd.
- Super Micro Computer, Inc.
- Penguin Computing, Inc.
- Huawei Technologies Co., Ltd.
- DataDirect Networks, Inc.
- Mellanox Technologies Ltd. (NVIDIA)
- Arm Ltd.
- Cray Inc. (HPE brand)
- E4 Computer Engineering S.p.A.
- H3C Technologies Co., Ltd.
Additional Benefits:
- The market estimate (ME) sheet in Excel format
- 3 months of analyst support
TABLE OF CONTENTS
1 INTRODUCTION
- 1.1 Study Assumptions and Market Definition
- 1.2 Scope of the Study
2 RESEARCH METHODOLOGY
3 EXECUTIVE SUMMARY
4 MARKET LANDSCAPE
- 4.1 Market Overview
- 4.2 Market Drivers
- 4.2.1 Race-to-Exascale public funding surge
- 4.2.2 Proliferation of AI/ML workloads on HPC systems
- 4.2.3 Demand for climate and biomedical simulations post-COVID
- 4.2.4 Rising availability of cloud-based "HPC-as-a-Service"
- 4.2.5 Open-source HPC software stack maturity
- 4.2.6 National digital-sovereignty programs (under-the-radar)
- 4.3 Market Restraints
- 4.3.1 Ballooning datacenter power and cooling costs
- 4.3.2 Persistent talent gap in parallel-programming skills
- 4.3.3 Advanced-node chip supply-chain fragility
- 4.3.4 Lengthy public-sector procurement cycles (niche)
- 4.4 Industry Value / Supply-Chain Analysis
- 4.5 Regulatory Landscape
- 4.6 Technological Outlook
- 4.7 Porter's Five Forces Analysis
- 4.7.1 Bargaining Power of Suppliers
- 4.7.2 Bargaining Power of Consumers
- 4.7.3 Threat of New Entrants
- 4.7.4 Threat of Substitutes
- 4.7.5 Intensity of Competitive Rivalry
- 4.7.6 Assessment of Macroeconomic Impact
5 MARKET SIZE AND GROWTH FORECASTS (VALUE)
- 5.1 By Component
- 5.1.1 Processor (CPU)
- 5.1.2 Accelerators (GPU/ASIC)
- 5.1.3 Memory
- 5.1.4 Storage
- 5.1.5 Interconnect
- 5.1.6 Software and Services
- 5.2 By System Type
- 5.2.1 Cluster-Based
- 5.2.2 Massively Parallel Processing (MPP)
- 5.2.3 Accelerated / Heterogeneous
- 5.2.4 Vector
- 5.3 By Deployment Mode
- 5.3.1 On-Premises
- 5.3.2 Cloud-based (HPC-aaS)
- 5.3.3 Hybrid
- 5.4 By Processing Scale
- 5.4.1 Petascale
- 5.4.2 Pre-Exascale
- 5.4.3 Exascale
- 5.5 By End-user
- 5.5.1 Government and Defense
- 5.5.2 Academic and Research Institutes
- 5.5.3 Financial Services
- 5.5.4 Healthcare and Life Sciences
- 5.5.5 Manufacturing and Industrial
- 5.5.6 Energy and Utilities
- 5.6 By Geography
- 5.6.1 North America
- 5.6.1.1 United States
- 5.6.1.2 Canada
- 5.6.1.3 Mexico
- 5.6.2 Europe
- 5.6.2.1 Germany
- 5.6.2.2 United Kingdom
- 5.6.2.3 France
- 5.6.2.4 Russia
- 5.6.2.5 Rest of Europe
- 5.6.3 Asia-Pacific
- 5.6.3.1 China
- 5.6.3.2 Japan
- 5.6.3.3 India
- 5.6.3.4 South Korea
- 5.6.3.5 Australia
- 5.6.3.6 Rest of Asia-Pacific
- 5.6.4 Middle East and Africa
- 5.6.4.1 Middle East
- 5.6.4.1.1 Saudi Arabia
- 5.6.4.1.2 United Arab Emirates
- 5.6.4.1.3 Rest of Middle East
- 5.6.4.2 Africa
- 5.6.4.2.1 South Africa
- 5.6.4.2.2 Egypt
- 5.6.4.2.3 Rest of Africa
- 5.6.4.1 Middle East
- 5.6.5 South America
- 5.6.5.1 Brazil
- 5.6.5.2 Argentina
- 5.6.5.3 Rest of South America
- 5.6.1 North America
6 COMPETITIVE LANDSCAPE
- 6.1 Market Concentration
- 6.2 Strategic Moves
- 6.3 Market Share Analysis
- 6.4 Company Profiles (includes Global level Overview, Market level overview, Core Segments, Financials as available, Strategic Information, Market Rank/Share for key companies, Products and Services, and Recent Developments)
- 6.4.1 Hewlett Packard Enterprise Company
- 6.4.2 Lenovo Group Limited
- 6.4.3 Dell Technologies Inc.
- 6.4.4 Fujitsu Limited
- 6.4.5 Atos SE
- 6.4.6 International Business Machines Corporation
- 6.4.7 NEC Corporation
- 6.4.8 Intel Corporation
- 6.4.9 Advanced Micro Devices, Inc.
- 6.4.10 NVIDIA Corporation
- 6.4.11 Sugon Information Industry Co., Ltd.
- 6.4.12 Inspur Group Co., Ltd.
- 6.4.13 Super Micro Computer, Inc.
- 6.4.14 Penguin Computing, Inc.
- 6.4.15 Huawei Technologies Co., Ltd.
- 6.4.16 DataDirect Networks, Inc.
- 6.4.17 Mellanox Technologies Ltd. (NVIDIA)
- 6.4.18 Arm Ltd.
- 6.4.19 Cray Inc. (HPE brand)
- 6.4.20 E4 Computer Engineering S.p.A.
- 6.4.21 H3C Technologies Co., Ltd.
7 MARKET OPPORTUNITIES AND FUTURE OUTLOOK
- 7.1 White-space and Unmet-need Assessment