

|
시장보고서
상품코드
2122406
분산 안테나 시스템 : 시장 점유율 분석, 업계 동향과 통계, 성장 예측(2026-2031년)Distributed Antenna Systems - Market Share Analysis, Industry Trends & Statistics, Growth Forecasts (2026 - 2031) |
||||||
 Mordor Intelligence
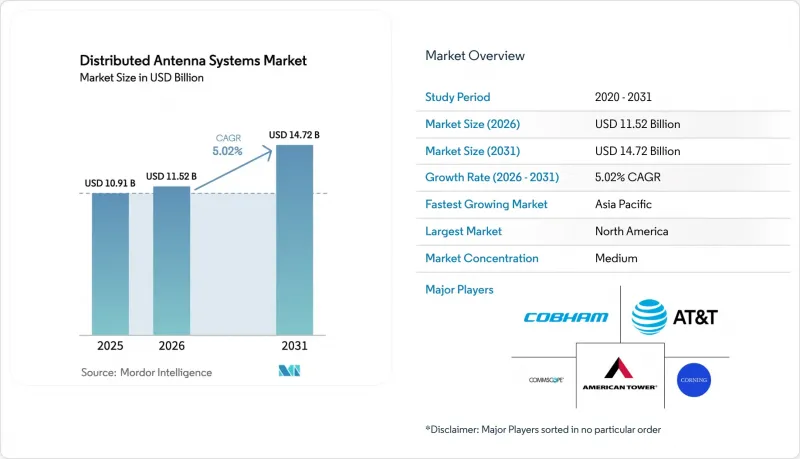
Mordor Intelligence에 따르면 분산 안테나 시스템(DAS) 시장 규모는 2025년 109억 1,000만 달러, 2026년 115억 2,000만 달러에서 2031년까지 147억 2,000만 달러로 확대할 것으로 예측되고 있으며, 2026-2031년까지 연평균 성장률(CAGR)은 5.02%에 달할 전망입니다.
이 보고서는 안테나 유형별(액티브, 패시브, 디지털, 하이브리드), 최종사용자별(제조업, 헬스케어, 정부·공공안전, 기타),용도별(기업 DAS, 공공안전 DAS, 뉴트럴 호스트·다중 사업자 DAS), 소유 모델별(통신사 소유, 뉴트럴 호스트, 기업 소유), 지역별로 분류되어 있습니다. 시장 예측은 금액(달러) 기준으로 제시되어 있습니다.
전 세계 분산 안테나 시스템 시장의 동향 및 인사이트
5G 네트워크의 고밀도화에 따른 실내 커버리지 수요 증가
밀리미터파 신호는 벽을 통과할 때 큰 감쇠를 받기 때문에 통신 사업자는 실외 매크로 기지국의 구축을 실내 플랫폼으로 보완할 수밖에 없습니다. 특히 중국내 364만 곳의 5G 기지국 설치 현황 및 싱가포르가 2025년까지 5G의 50%를 독립형 방식으로 운영하도록 의무화하고 있는 상황에서 그 필요성은 더욱 두드러집니다. 덴버의 엠파워 필드에 도입된 뉴트럴 호스트형 DAS는 두 차례의 콘서트에서 50테라바이트의 데이터를 전송했습니다. 이는 일반적인 NFL 경기의 몇 배에 해당하는 양으로, 대규모 행사장에는 해당 장소에 특화된 인프라가 필요함을 보여줍니다. C-밴드로의 전환을 통해 전파 침투성과 용량의 균형이 잡혔지만, 그럼에도 주요 시설에서는 여전히 실내 노드가 요구되고 있습니다. 모바일 트래픽의 80%가 실내에서 발생하므로 경기장, 병원, 교통 허브 등에 고밀도 사용자가 모일 경우, 분산 안테나 시스템 시장의 통신 사업자는 신속한 투자 회수를 기대할 수 있습니다.
건물내 공공안전 통신 커버리지에 관한 규제상 의무
FCC 도켓 21-346에서는 2025년까지 상업용 건물의 실내 LTE 커버리지를 99%로 확보할 것을 의무화하고 있으며, 이에 따라 DAS 도입이 필수화되었습니다. FirstNet의 17억 달러 규모의 농촌 지역 보조금 프로그램을 통해 3만 채의 건물에 시스템이 도입되었으며, 소유주에게는 ‘Enhanced 911’의 정확도 기준을 충족할 경우 인센티브가 제공되었습니다. 유럽의 교통 회랑에 대한 통신 커버리지 지침과 싱가포르의 소방법 개정도 유사한 압력을 가하고 있습니다. 클리블랜드 클리닉(Cleveland Clinic)과 같은 대규모 의료 시설에서는 FirstNet과 상용 5G를 단일 네트워크로 통합하여 공공안전과 의료 업무 모두에서 가동 시간을 확보하고 있습니다. 이러한 규정 준수로 인해 DAS 도입 주기는 선택적에서 의무적인 일정으로 전환되었으며, 부동산 개발업자의 의사결정 기간이 단축되었습니다.
다수 사업자 간의 협력 및 주파수 대역 확보의 복잡성
단일 시설 내에서 3개 이상의 통신 사업자에게 서비스를 제공하는 경우, 주파수 및 출력 마스크에 관한 상세한 협상이 필요하며, 이로 인해 프로젝트 기간이 6-18개월 연장됩니다. 슈퍼돔에서는 AT&T, Verizon, T-Mobile의 91개 구역을 조정하는 데 상용 서비스 개시까지 14개월이 소요되었습니다. 필터링이 불충분할 경우 수동 상호 변조로 인해 신호가 10-15dB 저하될 가능성이 있으므로, 통합업체는 검사에 추가 비용을 지출하고 있습니다. 많은 신흥 시장의 규제 당국은 여전히 회장 단위가 아닌 사업자 단위로 주파수 대역을 허가하고 있으며, 이로 인해 분산형 안테나 시스템 시장에서 중립성의 이점이 제한되고 있습니다.
부문 분석
분산 안테나 시스템 시장에서 하이브리드 플랫폼은 고출력 능동형 유닛과 동축 수동형 레이아웃 사이에서 시장 점유율을 확대하고 있습니다. 하이브리드 DAS는 연평균 성장률(CAGR) 6.10%를 기록하고 있으며, 여전히 DAS 시장 규모에서 가장 큰 점유율을 차지하고 있는 능동형 시스템의 점유율을 앞으로도 계속 빼앗을 것으로 예상됩니다. 액티브 유닛은 멀티밴드 출력이 가능하지만, 사이트당 5-15kW를 소비하고 패시브형에 비해 65% 더 많은 랙 공간을 차지하므로 시설 소유주는 냉각 시스템 및 전원 회로 업그레이드를 해야만 합니다. 패시브 솔루션은 10만 제곱피트 이하의 건물에서는 여전히 실용적이지만, 동축 케이블 100피트마다 3-6dB의 감쇠가 발생합니다. 디지털 광섬유 방식은 RF 신호를 광 신호로 변환함으로써 에너지 소비를 60-70% 절감하고, 소프트웨어 업그레이드도 용이하게 합니다. 이는 20개국에서 전개되고 있는 LampSite의 도입 사례에서도 분명하게 드러납니다.
하이브리드 시스템은 광 백홀과 로컬 증폭 기능을 통합하여 설비 투자와 전력 예산의 균형을 맞출 수 있습니다. 오스틴에서 Verizon이 도입한 Open RAN의 경우, 벤더 종속을 피하기 위해 삼성의 소프트웨어 유닛과 콤스코프의 안테나를 연동하고 있습니다. 통신 사업자가 하이브리드 방식을 선호하는 이유는 현재 에너지 비용이 OPEX의 20-30%를 차지하고 있으며, 소프트웨어 제어를 통해 야간에는 섹터를 끌 수 있기 때문입니다. 모듈형 라디오 헤드 및 원격 소프트웨어 키를 제공하는 공급업체는 설치 장소가 여러 예산 주기에 걸쳐 단계적으로 투자를 진행하므로 가격 결정력을 높이고 있습니다.
2025년에도 통신 사업자가 매출의 28.60%를 차지하며 여전히 수요를 주도하고 있지만, 가장 빠르게 성장하고 있는 분야는 병원입니다. 전자 차트 접근, 영상 데이터 전송, 실시간 모니터링에서 분산 안테나 시스템 시장에서는 서비스 중단이 전혀 허용되지 않기 때문에 병원 시장은 연평균 성장률(CAGR) 7.80%로 확대되고 있습니다. 로체스터의 메이요 클리닉에서는 코닝사의 DAS 상에서 7만 대 이상의 의료기기를 가동하고 있으며, 운영상의 중요성을 보여주고 있습니다. 제조 현장에서는 로봇 공학 용도에서 1제곱피트당 0.97-1.12달러라는 저렴한 비용으로 인해 CBRS 스몰 셀이 선호되고 있으며, 이로 인해 DAS의 보급이 억제되고 있습니다.
정부 기관 및 공공안전 기관은 밴드 14의 통합에 의존하고 있으며, 이러한 사용 사례로 인해 스몰 셀과의 경쟁이 있음에도 불구하고 분산형 안테나 시스템의 시장 점유율은 견고하게 유지되고 있습니다. 엠파워 필드와 같은 스포츠 시설에서는 DAS의 용량을 활용하여 모바일 주문 및 증강현실(AR) 리플레이를 구현하고, 부가 수익 창출을 촉진하고 있습니다. 하츠필드-잭슨 공항에서 볼 수 있듯이, 교통 허브에서는 여러 차례의 재구축을 피하기 위해 중립 호스트 네트워크가 채택되고 있습니다.
지역별 분석
북미는 FCC의 실내 99% 커버리지 의무화와 FirstNet의 3만 동에 달하는 도입 규모에 힘입어, 2025년 분산형 안테나 시스템 시장 매출의 38.50%를 차지했습니다. 엠파워 필드와 같이 유동 인구가 많은 시설에서는 2일 동안 50테라바이트의 데이터가 전송되어, 1제곱피트당 4-8달러의 투자가 정당화되었습니다. 이 지역에서는 프리미엄 중립 호스트 가격 책정이 선호되지만, 중급급 시설의 경우 3-7년의 회수 기간이 예상되므로 사업자들은 경기장, 공항, 의료 시설에 주력하고 있습니다.
아시아태평양은 연평균 성장률(CAGR) 7.43%를 기록하며 단기적인 성장의 원동력이 되고 있습니다. 이는 중국의 5G 기지국 364만 개, 인도의 70만 개라는 목표, 그리고 싱가포르의 전국적인 실내 커버리지 목표에 힘입은 것입니다. 홍콩과 선전의 대규모 도시 프로젝트에서는 10주 이내에 전체 노선의 커버리지가 구축되어 그 실행 속도가 입증되었습니다. 일본의 경우, 건물이 밀집해 있는 반면 노후화가 진행되고 있으며, 개보수가 복잡해지고 있으며, 공급업체들은 얇은 안테나 도입을 서두르고 있습니다. 한국과 호주는 이미 커버리지 목표를 달성했으며, 현재는 시설 업그레이드에 중점을 두고 있습니다.
유럽의 에너지 효율 규제는 전력 소비를 60-70% 절감하는 디지털 솔루션을 촉진하고 있습니다. 그러나 건축 기준이 통일되어 있지 않아 허가 취득에 3-12개월이 소요되어, 여러 국가에 걸친 확산이 지연되고 있습니다. 영국의 ‘프로젝트 기가비트’와 교통 회랑에 관한 의무 규정으로 인해 공공 자금 지원 프로그램이 활발히 추진되고 있으나, 역사적 건축물에는 특수한 내화 케이블이 필요합니다. 중동 및 아프리카에서는 리야드, 두바이, 도하의 스마트 시티 프로그램을 배경으로 2031년까지 급속한 성장이 예상됩니다. du가 구축한 최초의 5G-Advanced 실내 네트워크는 5.1Gbps를 달성하며, 최첨단 성능에 대한 수요가 높음을 보여주고 있습니다. 사우디아라비아의 주파수 공유 시범 사업은 다른 지역에서 흔히 볼 수 있는 조정 지연을 피할 수 있음을 시사하며, 규제 측면에서의 유연성을 보여줍니다. 라틴아메리카와 사하라 이남 아프리카에서는 DAS(분산형 안테나 시스템)가 고급 쇼핑몰이나 공항에 국한되어 있는 등 아직 발전 단계에 있지만, 도시화와 스마트폰 보급률 추세를 고려할 때 자금 조달의 장벽이 완화된다면 잠재적인 수요가 예상됩니다.
기타 혜택
- 엑셀 형식의 시장 예측(ME) 시트
- 3개월간의 애널리스트 지원
자주 묻는 질문
목차
제1장 서론
제2장 조사 방법
제3장 개요
제4장 시장 구도
제5장 시장 규모와 성장 예측
제6장 경쟁 구도
제7장 시장 기회와 향후 전망
KSA 26.09.07According to Mordor Intelligence, the distributed antenna systems market size is projected to expand from USD 10.91 billion in 2025 and USD 11.52 billion in 2026 to USD 14.72 billion by 2031, registering a CAGR of 5.02% between 2026 to 2031.
This report is Segmented by Antenna Type (Active, Passive, Digital, and Hybrid), End-User (Manufacturing, Healthcare, Government and Public Safety, and More), Application (Enterprise DAS, Public Safety DAS, and Neutral-Host/Multi-Operator DAS), Ownership Model (Carrier-Owned, Neutral-Host, and Enterprise-Owned), and Geography. The Market Forecasts are Provided in Terms of Value (USD).
Global Distributed Antenna Systems Market Trends and Insights
5G Network Densification Boosting Indoor-Coverage Demand
Millimeter-wave signals suffer high attenuation through walls, so operators are compelled to supplement outdoor macro roll-outs with indoor platforms, especially in China's 3.64 million 5G base-station footprint and Singapore's 50% standalone 5G mandate for 2025. Neutral-host DAS at Empower Field in Denver moved 50 terabytes over two concerts, several times a typical NFL game, illustrating how large venues require venue-specific infrastructure. The switch to C-Band balances penetration and capacity, yet still demands indoor nodes in premium properties. Because 80% of mobile traffic originates indoors, distributed antenna systems market carriers see rapid payback when high-density users congregate in stadiums, hospitals, and transport hubs.
Regulatory Mandates for In-Building Public-Safety Coverage
FCC Docket 21-346 requires 99% indoor LTE coverage for commercial buildings by 2025, driving compulsory DAS adoption. FirstNet's USD 1.7 billion rural grant program placed systems in 30,000 buildings, giving owners an incentive to meet Enhanced 911 accuracy rules. European transport-corridor coverage directives and Singapore's fire-code updates create similar pressure. Large medical campuses such as Cleveland Clinic integrated FirstNet and commercial 5G in a single network, assuring both public-safety and clinical uptime. Compliance has reduced DAS deployment cycles from discretionary to mandated timelines, shortening decision windows for property developers.
Multi-Operator Coordination and Spectrum-Clearance Complexity
Serving three or more carriers inside one venue forces detailed negotiation of frequencies and power masks, extending projects by 6-18 months. At the Superdome, aligning 91 zones for AT&T, Verizon, and T-Mobile took 14 months before commercial service began. Passive inter-modulation can degrade signal by 10-15 dB if filtering is inadequate, so integrators spend extra on testing. Many emerging-market regulators still license spectrum per operator rather than venue, limiting the neutrality benefits in the distributed antenna systems market.
Other drivers and restraints analyzed in the detailed report include:
- Neutral-Host Business Models Lowering Property-Owner CAPEX
- AI-Driven DAS Self-Optimization Lowers Network OPEX
- High Installation and Deployment Costs for Large Venues
For complete list of drivers and restraints, kindly check the Table Of Contents.
Segment Analysis
Hybrid platforms are carving space between high-powered active units and coaxial passive layouts in the distributed antenna systems market. Hybrid DAS recorded a 6.10% CAGR and is expected to keep eating into active systems that still represent the largest slice of the distributed antenna systems market size. Active units, while capable of multi-band power output, consume 5-15 kW per site and occupy 65% more rack space than passive variants, forcing venue owners to upgrade cooling and power circuits. Passive solutions remain viable in buildings under 100,000 square-feet but lose 3-6 dB every 100 feet of coax. Digital fiber variants convert RF to light, cutting energy 60-70% and easing software upgrades, as evidenced by LampSite roll-outs across 20 countries.
Hybrid systems integrate fiber backhaul with localized amplification, which brings a compromise between capital and power budgets. Verizon's Open RAN deployment in Austin links Samsung software units with CommScope antennas to avoid vendor lock-in. Operators favor hybrids because energy now represents 20-30% of OPEX, and software control lets them turn off sectors overnight. Suppliers offering modular radio heads and remote software keys gain pricing power as venues stagger investments over several budget cycles.
Telecommunications operators still dominated demand with 28.60% revenue in 2025, but hospitals are the fastest risers, expanding at a 7.80% CAGR as electronic health-record access, imaging transfer, and real-time monitoring require zero service interruptions in the distributed antenna systems market. Mayo Clinic in Rochester runs more than 70,000 medical devices on a Corning DAS, showing the operational stakes. Manufacturing floors are leaning toward CBRS small cells for robotics due to lower USD 0.97-1.12 per-square-foot cost, curbing DAS penetration.
Government and public-safety agencies rely on Band 14 integration, a use case that keeps distributed antenna systems market share sticky despite small-cell competition. Sports venues such as Empower Field exploit DAS capacity to enable mobile ordering and augmented-reality replays, driving ancillary revenue. Transportation hubs adopt neutral-host networks to avoid multiple rebuilds, as seen at Hartsfield-Jackson Airport.
Complete Report Scope:
- By Antenna Type
- Active
- Passive
- Digital
- Hybrid
- By End-User
- Manufacturing
- Healthcare
- Government and Public Safety
- Transportation and Logistics
- Sports and Entertainment Venues
- Telecommunications Operators
- Other Commercial Sectors
- By Application
- Enterprise DAS
- Public Safety DAS
- Neutral-Host / Multi-Operator DAS
- By Ownership Model
- Carrier-Owned
- Neutral-Host
- Enterprise-Owned
- By Geography
- North America
- United States
- Canada
- Mexico
- Europe
- United Kingdom
- Germany
- Netherlands
- France
- Ireland
- Rest of Europe
- Asia-Pacific
- China
- India
- Singapore
- Japan
- Australia
- Indonesia
- Rest of Asia-Pacific
- South America
- Brazil
- Chile
- Rest of South America
- Middle East
- United Arab Emirates
- Saudi Arabia
- Turkey
- Rest of Middle East
- Africa
- South Africa
- Nigeria
- Rest of Africa
- North America
Geography Analysis
North America held 38.50% of 2025 revenue in the distributed antenna systems market, propelled by the FCC's 99% indoor mandate and FirstNet's 30,000-building footprint. High-traffic venues such as Empower Field moved 50 terabytes in two days, justifying USD 4-8 per-square-foot investments. The region favors premium neutral-host pricing yet faces 3-7 year paybacks in mid-tier properties, so operators focus on stadiums, airports, and healthcare.
Asia-Pacific is the near-term growth engine at 7.43% CAGR, underpinned by China's 3.64 million 5G sites, India's 700,000-site target, and Singapore's nationwide indoor targets. Large metro projects in Hong Kong and Shenzhen installed full-line coverage within ten weeks, illustrating execution speed. Japan's dense yet aging buildings complicate retrofits, pushing suppliers toward slimline antennas. South Korea and Australia, past the coverage milestone, now emphasize venue upgrades.
Europe's energy-efficiency rules spur digital solutions that cut consumption 60-70%. Fragmented building codes, however, add 3-12 months to permitting, slowing multi-country roll-outs. The United Kingdom's Project Gigabit and transport-corridor obligations keep public-funded programs active, yet historic edifices require specialized fire-proof cabling. The Middle East and Africa is expected to grow rapidly through 2031 on the back of smart-city programs in Riyadh, Dubai, and Doha. du's first 5G-Advanced indoor network hit 5.1 Gbps, signaling appetite for cutting-edge performance. Spectrum-sharing pilots in Saudi Arabia point to regulatory openness that could sidestep coordination delays common elsewhere. Latin America and Sub-Saharan Africa remain nascent, with DAS limited to premium malls and airports, but urbanization and smartphone-penetration trends suggest a latent pipeline once financing hurdles ease.
- CommScope Holding Company Inc.
- Corning Incorporated
- AT&T Inc.
- American Tower Corporation
- Cobham Limited
- SOLiD Inc.
- TE Connectivity Ltd.
- Comba Telecom Systems Holdings Ltd.
- Boingo Wireless Inc.
- JMA Wireless
- Dali Wireless Inc.
- Zinwave (Wilson Electronics)
- Nokia Corporation
- Ericsson AB
- Huawei Technologies Co. Ltd.
- Radio Frequency Systems
- Advanced RF Technologies Inc.
- PBE Axell Wireless
- Maven Wireless Sweden AB
- Baicells Technologies Co. Ltd.
- Tower Bersama Group
- Anixter International Inc.
- Amphenol Corporation
- Antenna Products Corporation
Additional Benefits:
- The market estimate (ME) sheet in Excel format
- 3 months of analyst support
TABLE OF CONTENTS
1 INTRODUCTION
- 1.1 Study Assumptions and Market Definition
- 1.2 Scope of the Study
2 RESEARCH METHODOLOGY
3 EXECUTIVE SUMMARY
4 MARKET LANDSCAPE
- 4.1 Market Overview
- 4.2 Market Drivers
- 4.2.1 5G Network Densification Boosting Indoor-Coverage Demand
- 4.2.2 Regulatory Mandates for In-Building Public-Safety Coverage
- 4.2.3 Neutral-Host Business Models Lowering Property-Owner CAPEX
- 4.2.4 AI-Driven DAS Self-Optimisation Lowers Network OPEX
- 4.2.5 Rising Mobile Data Traffic in Large Venues
- 4.2.6 Proliferation of IoT and Smart-Building Applications
- 4.3 Market Restraints
- 4.3.1 Multi-Operator Coordination and Spectrum-Clearance Complexity
- 4.3.2 Sustainability Pressure on Energy-Intensive Systems
- 4.3.3 High Installation and Deployment Costs for Large Venues
- 4.3.4 Complex Regulatory Approvals and Building-Zoning Permits
- 4.4 Industry Value Chain Analysis
- 4.5 Regulatory Landscape
- 4.6 Technological Outlook
- 4.7 Impact of Macroeconomic Factors
- 4.8 Porter's Five Forces Analysis
- 4.8.1 Threat of New Entrants
- 4.8.2 Bargaining Power of Suppliers
- 4.8.3 Bargaining Power of Buyers
- 4.8.4 Threat of Substitutes
- 4.8.5 Competitive Rivalry
5 MARKET SIZE AND GROWTH FORECASTS (VALUE)
- 5.1 By Antenna Type
- 5.1.1 Active
- 5.1.2 Passive
- 5.1.3 Digital
- 5.1.4 Hybrid
- 5.2 By End-User
- 5.2.1 Manufacturing
- 5.2.2 Healthcare
- 5.2.3 Government and Public Safety
- 5.2.4 Transportation and Logistics
- 5.2.5 Sports and Entertainment Venues
- 5.2.6 Telecommunications Operators
- 5.2.7 Other Commercial Sectors
- 5.3 By Application
- 5.3.1 Enterprise DAS
- 5.3.2 Public Safety DAS
- 5.3.3 Neutral-Host / Multi-Operator DAS
- 5.4 By Ownership Model
- 5.4.1 Carrier-Owned
- 5.4.2 Neutral-Host
- 5.4.3 Enterprise-Owned
- 5.5 By Geography
- 5.5.1 North America
- 5.5.1.1 United States
- 5.5.1.2 Canada
- 5.5.1.3 Mexico
- 5.5.2 Europe
- 5.5.2.1 United Kingdom
- 5.5.2.2 Germany
- 5.5.2.3 Netherlands
- 5.5.2.4 France
- 5.5.2.5 Ireland
- 5.5.2.6 Rest of Europe
- 5.5.3 Asia-Pacific
- 5.5.3.1 China
- 5.5.3.2 India
- 5.5.3.3 Singapore
- 5.5.3.4 Japan
- 5.5.3.5 Australia
- 5.5.3.6 Indonesia
- 5.5.3.7 Rest of Asia-Pacific
- 5.5.4 South America
- 5.5.4.1 Brazil
- 5.5.4.2 Chile
- 5.5.4.3 Rest of South America
- 5.5.5 Middle East
- 5.5.5.1 United Arab Emirates
- 5.5.5.2 Saudi Arabia
- 5.5.5.3 Turkey
- 5.5.5.4 Rest of Middle East
- 5.5.6 Africa
- 5.5.6.1 South Africa
- 5.5.6.2 Nigeria
- 5.5.6.3 Rest of Africa
- 5.5.1 North America
6 COMPETITIVE LANDSCAPE
- 6.1 Market Concentration
- 6.2 Strategic Moves
- 6.3 Market Share Analysis
- 6.4 Company Profiles (includes Global level Overview, Market level overview, Core Segments, Financials as available, Strategic Information, Market Rank/Share for key companies, Products and Services, and Recent Developments)
- 6.4.1 CommScope Holding Company Inc.
- 6.4.2 Corning Incorporated
- 6.4.3 AT&T Inc.
- 6.4.4 American Tower Corporation
- 6.4.5 Cobham Limited
- 6.4.6 SOLiD Inc.
- 6.4.7 TE Connectivity Ltd.
- 6.4.8 Comba Telecom Systems Holdings Ltd.
- 6.4.9 Boingo Wireless Inc.
- 6.4.10 JMA Wireless
- 6.4.11 Dali Wireless Inc.
- 6.4.12 Zinwave (Wilson Electronics)
- 6.4.13 Nokia Corporation
- 6.4.14 Ericsson AB
- 6.4.15 Huawei Technologies Co. Ltd.
- 6.4.16 Radio Frequency Systems
- 6.4.17 Advanced RF Technologies Inc.
- 6.4.18 PBE Axell Wireless
- 6.4.19 Maven Wireless Sweden AB
- 6.4.20 Baicells Technologies Co. Ltd.
- 6.4.21 Tower Bersama Group
- 6.4.22 Anixter International Inc.
- 6.4.23 Amphenol Corporation
- 6.4.24 Antenna Products Corporation
7 MARKET OPPORTUNITIES AND FUTURE OUTLOOK
- 7.1 White-Space and Unmet-Need Assessment


