

|
시장보고서
상품코드
2122434
복합재료 : 시장 점유율 분석, 업계 동향 및 통계, 성장 예측(2026-2031년)Composite Material - Market Share Analysis, Industry Trends & Statistics, Growth Forecasts (2026 - 2031) |
||||||
 Mordor Intelligence
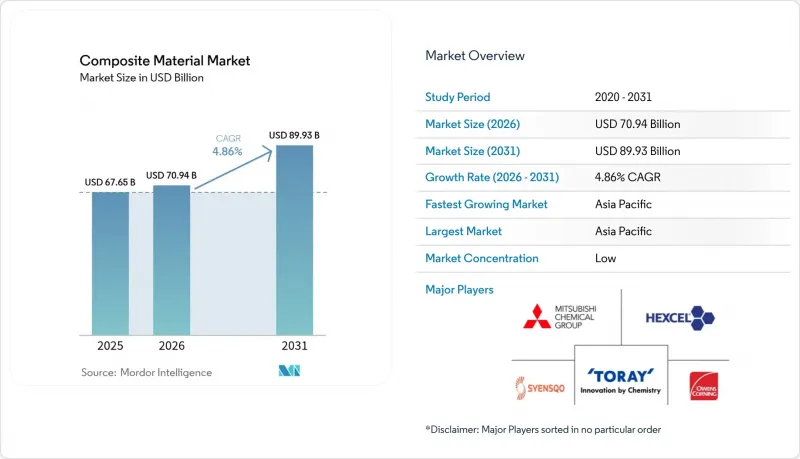
에 의하면, 복합재료 시장 규모는 2025년 676억 5,000만 달러로 평가되었습니다. 2026년에는 709억 4,000만 달러로 확대되어 2026-2031년에 걸쳐 CAGR 4.86%로 성장을 지속하여, 2031년에는 899억 3,000만 달러에 이를 것으로 예측됩니다.

본 보고서에서는 매트릭스 재료별(폴리머 매트릭스 복합재료(PMC), 세라믹/탄소 매트릭스 복합재료(CMC), 기타 매트릭스), 보강 섬유별(유리 섬유, 탄소섬유, 기타),최종 이용 산업별(자동차 및 운송, 풍력에너지, 기타), 지역별(아시아태평양, 북미, 유럽, 기타)로 산업을 분류하고 있습니다. 시장 예측은 금액(달러) 기준으로 제시되어 있습니다.
세계의 복합재료 시장 동향 및 인사이트
전동화가 견인하는 e-모빌리티 부문에서의 탄소섬유 수요
전기자동차에는 약 450파운드의 플라스틱 및 폴리머 복합재료가 사용됩니다. 이는 내연기관 차량에 비해 18% 증가한 수치입니다. 이는 차량 총중량을 10% 줄일 때마다 일반적으로 주행 거리가 6-8% 늘어날 수 있기 때문입니다. 배터리 인클로저는 대표적인 용도로, 탄소섬유 강화 폴리머는 열적 안정성을 저해하지 않으면서 알루미늄에 비해 질량을 30% 줄여줍니다. 유리섬유 강화 열가소성 수지로 성형된 차체 패널은 비용 경쟁력을 갖춘 경량화를 실현하며, 인테리어 트림에 사용되는 천연섬유 라미네이트는 지속가능성 노력을 한층 더 강화합니다. 각 자동차 제조업체는 강성, 충돌 안전성, 수명 주기 배출량을 최적화하기 위해 탄소섬유, 유리 섬유, 바이오 보강재를 조합한 다중 소재 구조로의 전환을 추진하고 있습니다. 공급망 측도 이에 대응하여, 2026년부터 2028년에 걸친 신차 출시 기간 중 발생할 수 있는 병목 현상을 피하기 위해 북미, 유럽, 동아시아 전역에서 토우 생산 능력과 인증 프리프레그 생산 라인 확충을 추진하고 있습니다.
풍력 터빈 블레이드 제조에서의 활용 확대
세계 풍력 발전 설비 설치량은 2024년에 17%, 2025년에는 35% 증가하여, 누적 용량은 2035년에 예상되는 450GW라는 대목으로 끌어올려지고 있습니다. 차세대 해상 풍력 발전기는 현재 15MW를 초과하며, 110m가 넘는 블레이드가 필요하지만, 이는 특주 복합재 적층 구조를 통해서만 실현 가능합니다. 금세기 말까지 블레이드 제조에는 연간 100만 톤 이상의 유리섬유와 탄소섬유 보강재가 소비될 전망이며, 유리섬유 용융 능력과 고탄성률 탄소섬유 공급에 대한 압박이 커지고 있습니다. 미터당 비용 측면에서는 유리섬유 강화 플라스틱이 여전히 주류를 이루고 있지만, 블레이드 선단의 처짐이나 블레이드 뿌리 부분의 무게를 줄이기 위해 선택적으로 탄소섬유를 사용한 스퍼 캡의 채택이 확대되고 있습니다. 유럽에서는 용접이 가능한 블레이드 뿌리 접합부를 구현하기 위한 열가소성 수지 블레이드의 검사 운영이 진행되고 있으며, 이를 통해 시멘트 가마에서의 혼소를 피하는 재활용 경로가 실현될 가능성이 있습니다. 이 부문에서 새롭게 도입되고 있는 블레이드 순환형 규제로 인해, 자재의 추적 가능성과 수지의 재배합은 OEM 및 제조업체에게 시급한 우선 과제가 되고 있습니다.
복합재료의 높은 비용
탄소섬유 복합재료는 일반적으로 부품 납품 가격 기준으로 강재의 5-10배에 달하기 때문에 비용에 민감한 부문으로의 보급을 저해하고 있습니다. 항공우주 등급 프리프레그의 경우 오토클레이브를 통한 경화, 엄격한 환경 관리, 광범위한 비파괴 검사가 필요하며, 이 모든 요소가 단위당 비용을 상승시키고 있습니다. 자동차 부문에서도 유사한 장벽에 직면해 있어, 중량 대비 성능 비율이 뛰어나함에도 불구하고 탄소섬유의 사용은 주로 고급차 브랜드로 한정되어 있습니다. 섬유 방적 라인이나 프리커서 공장은 자본 집약적이기 때문에 생산 규모는 여전히 중요한 장벽으로 남아 있습니다. 미국 국립 재생에너지 연구소(NREL)가 개발한 열성형법 등의 획기적인 기술은 재활용 가능한 탄소섬유 시트에서 90-95%의 비용 절감을 약속하고 있지만, 상업적 도입을 위해서는 수년에 걸친 인증 검사가 필요합니다. 원자재 가격이 하락하거나 설계 엔지니어가 시스템 수준에서 뛰어난 비용 절감 효과를 실현하기 전까지는 많은 잠재적 도입 기업들이 대량 대체 도입을 미룰 가능성이 있습니다.
부문별 분석
폴리머 매트릭스 복합재료(PMC)는 2025년 매출의 55.62%를 차지하며, 균형 잡힌 성능과 제조성을 모두 갖춘 점에서 복합재료 시장이 최적의 선택이라는 점을 입증했습니다. 항공우주, 선박, 풍력 발전용 블레이드 부문에서는 열경화성 에폭시 수지가 여전히 주류를 이루고 있지만, 자동차 및 소비재 부문에서는 재활용 가능한 열가소성 수지가 꾸준히 시장 점유율을 확대되고 있습니다. 시판되는 열가소성 UD 테이프의 생산 라인은 현재 폭 1m를 초과하며, 배터리 트레이 및 시트 구조용 고처리량 프레스 성형에 적합합니다. 이와 병행하여, 세라믹 매트릭스 복합재(CMC)에 기인한 복합재 시장 규모는 항공우주용 추진 시스템 및 집광형 태양열 발전 수신기에 힘입어 2026년부터 2031년까지 연평균 성장률(CAGR) 8.12%를 나타낼 것으로 예측됩니다.
CMC는 1,600°C 이상의 고온을 견디며, 니켈 초합금을 대체하고 냉각 수요를 대폭 줄임으로써 타의 추종을 불허하는 열효율을 실현합니다. 초기 투자 비용은 막대하지만, 생산이 안정화되면 경량화, 연료 소비량 감소, 유지보수 비용 절감을 통해 수명 주기 전반에 걸친 가치 제안이 초기 비용의 추가 부담을 상쇄합니다. 금속 매트릭스 복합재료는 전자 기판 캐리어 및 브레이크 로터용으로서 뛰어난 열전도성과 내마모성을 활용하여 틈새 시장에서 성장하고 있습니다. 적층 가공 기술과 5축 CNC 가공을 통해 설계의 자유도가 확대되고 있으며, 향후 10년 후반에는 시장 침투가 더욱 진행될 것으로 예측됩니다.
지역별 분석
아시아태평양은 2025년에 매출의 44.85%를 차지하며 복합재료 시장의 중심이 되었습니다. 중국의 해상 풍력 발전 설비 설치 확대, 인도의 지하철 네트워크 확장, 동남아시아의 송전망 인프라 업그레이드에 따라 2031년까지 연평균 7.45%의 성장이 예상됩니다. 이 지역의 복합재료 시장 규모는 탄소섬유 생산 능력 확대의 혜택도 받고 있습니다. 한국의 효성은 항공우주 및 수소 탱크 수요에 대응하기 위해 연간 생산량을 9,000톤으로 늘리고 있습니다. 일본의 밸류체인은 고정밀 토우 스프레드 및 프리프레그 기술에 중점을 두고 있으며, 국내 항공기 프로그램과 수출 고객 모두에게 서비스를 제공합니다.
북미는 항공우주 부문에 대한 지속적인 공급, 재생에너지에 대한 연방 정부의 투자, 회복 조짐을 보이는 레저용 선박 부문의 호조에 힘입어 근소한 차이로 그 뒤를 따르고 있습니다. 미국 에너지부는 풍력 터빈의 복합재료 재활용을 촉진하기 위해 2,000만 달러를 배정하며, 순환 경제를 향한 정책의 추진력을 보여주고 있습니다. 캐나다의 각 주는 학술 연구 개발과 사출 오버몰딩 파일럿 라인을 결합한 첨단 소재 클러스터를 지원하고 있으며, 바이오 열가소성 플라스틱에 대한 국내 지적 재산권을 유지하는 것을 목표로 하고 있습니다.
유럽은 높은 설계 능력과 엄격한 환경 규제를 갖추고 있어, 바이오 수지 및 폐쇄형 루프 공정의 급속한 보급을 촉진하고 있습니다. 2024년 하반기에는 공급망 혼란과 에너지 비용 급등으로 생산량이 감소했음에도 불구하고, 이 지역은 세계 생산량의 21.74% 점유율을 유지했습니다. 베스타스(Vestas)의 순환형 블레이드나 저배출 타워와 같은 노력은 EU의 기후 정책이 OEM의 우선순위를 종합적인 지속가능성으로 이끌고 있음을 보여줍니다. 동유럽 국가들은 숙련된 노동력과 서유럽 시장과의 근접성을 활용하여, 풀트라젼 및 필라멘트 와인딩 공장에 대한 투자 유치를 추진하고 있습니다.
남미와 중동 및 아프리카는 총 규모는 작지만, 인프라 현대화 및 해수 담수화 프로젝트에 복합재료 솔루션이 채택됨에 따라 비율 면에서는 현저한 성장을 보이고 있습니다. 브라질의 풍력 발전 회랑, 사우디아라비아의 해수 담수화용 브라인 배관, 남아프리카공화국의 전기 버스 차체 등이 주목할 만한 수요 집적지가 되고 있습니다. 다국적 기업의 기술 이전과 현지산 보강재(사이잘, 황마)공급이 맞물려 현지 혁신이 촉진되고 있으며, 수입 부품과의 비용 격차가 서서히 좁혀지고 있습니다.
기타 혜택
- 엑셀 형식 시장 예측(ME) 시트
- 3개월간의 애널리스트 지원
자주 묻는 질문
목차
제1장 서론
제2장 조사 방법
제3장 주요 요약
제4장 시장 구도
제5장 시장 규모 및 성장 예측
제6장 경쟁 구도
제7장 시장 기회 및 향후 전망
KTH 26.09.08According to Mordor Intelligence, the composite material market size is expected to grow from USD 67.65 billion in 2025 to USD 70.94 billion in 2026 and is forecast to reach USD 89.93 billion by 2031 at 4.86% CAGR over 2026-2031.
This report Segments the Industry by Matrix Material (Polymer Matrix Composites (PMC), Ceramic/Carbon Matrix Composites (CMCs), Other Matrices), Reinforcement Fiber (Glass Fiber, Carbon Fiber, and More), End-Use Industry (Automotive and Transportation, Wind Energy, and More), and Geography (Asia-Pacific, North America, Europe, and More). The Market Forecasts are Provided in Terms of Value (USD).
Global Composite Material Market Trends and Insights
Electrification-Driven Carbon-Fiber Demand in E-Mobility
Electric vehicles integrate roughly 450 lb of plastics and polymer composites-an 18% rise compared with internal-combustion platforms-because every 10% curb in curb weight typically stretches driving range by 6-8%. Battery enclosures have become a flagship application, where carbon-fiber reinforced polymers deliver a 30% mass cut versus aluminum without sacrificing thermal stability. Body panels molded from glass-fiber reinforced thermoplastics enable cost-competitive lightweighting, while natural-fiber laminates in interior trim broaden sustainability credentials. Automakers are converging on multi-material architectures that blend carbon, glass and bio reinforcements to optimise stiffness, crashworthiness and lifecycle emissions. Supply chains are responding by expanding tow capacity and qualified prepreg lines across North America, Europe and East Asia to avert bottlenecks during the 2026-2028 model-launch window.
Increasing Usage in the Manufacturing of Wind Turbine Blades
Global wind installations climbed 17% in 2024 and 35% in 2025, pushing cumulative capacity toward the 450 GW mark envisaged for 2035. Next-generation offshore machines now exceed 15 MW, requiring blades longer than 110 m that can only be realised with tailored composite lay-ups. More than 1 million t of glass and carbon reinforcements will be consumed annually for blade manufacture by the end of the decade, intensifying pressure on glass-fiber melt capacity and high-modulus carbon supply. While glass-fiber reinforced plastics continue to dominate on a cost-per-meter basis, selective carbon spar caps are proliferating to curb tip deflection and blade-root mass. Europe is piloting thermoplastic blades for weldable root joints, potentially enabling recycling routes that avoid co-processing in cement kilns. The sector's emerging blade-circularity regulations make material traceability and resin reformulation urgent priorities for OEMs and fabricators.
High Cost of Composite Materials
Carbon-fiber composites typically price at five-to-ten times steel on a delivered-part basis, deterring penetration into cost-sensitive segments. Aerospace-grade prepregs entail autoclave curing, tight environmental controls and extensive non-destructive testing, each inflating unit expense. Automotive programs confront similar hurdles, confining carbon-fiber usage largely to premium marques despite favorable weight-benefit ratios. Production scale remains a pivotal barrier, since fiber-spinning lines and precursor plants run capital-intensive. Breakthroughs such as National Renewable Energy Laboratory's thermoforming route promise 90-95% cost savings for recyclable carbon sheets, yet commercial deployment will require multi-year qualification campaigns. Until raw-material prices drop or design engineers capture superior system-level savings, many potential adopters may defer high-volume substitution.
Other drivers and restraints analyzed in the detailed report include:
- Growing Adoption of Thermoplastic Composites in Mass-Production Automotive
- Increasing Use of Composites in the Aerospace and Defense Industry
- Challenges in Recycling Composite Materials
For complete list of drivers and restraints, kindly check the Table Of Contents.
Segment Analysis
Polymer matrix composites (PMCs) delivered 55.62% of 2025 revenue, reinforcing the composites market as the preferred option for balanced performance and manufacturability. Thermoset epoxies remain mainstream in aerospace, marine and wind blades, yet recyclable thermoplastics are steadily eroding share in automotive and consumer goods. Commercial thermoplastic UD-tape lines now exceed 1 m wide, favouring high-throughput press forming for battery trays and seat structures. In parallel, the composites market size attributable to ceramic matrix composites is projected to post an 8.12% CAGR between 2026 and 2031, propelled by aerospace propulsion and concentrated solar-power receivers.
CMCs withstand more than 1 600 °C, replacing nickel super-alloys and slashing cooling demands, thereby unlocking unrivalled thermal efficiencies. Investment outlays are significant, but once quiver production stabilises, their life-cycle value proposition offsets initial premiums through weight savings, fuel burn reductions and lower maintenance. Metal matrix composites occupy a smaller niche that thrives on extraordinary thermal conductivity and wear resistance for electronic substrate carriers and brake rotors. Additive-manufacturing pathways and five-axis CNC finishing are broadening design envelopes, hinting at incremental penetration in the latter half of the decade.
Complete Report Scope:
- By Matrix Material
- Polymer Matrix Composites (PMC)
- Thermoset Resins
- Thermoplastic Resins
- Ceramic/Carbon Matrix Composites (CMCs)
- Other Matrices (Metal Matrix Composites)
- Polymer Matrix Composites (PMC)
- By Reinforcement Fiber
- Glass Fiber
- Carbon Fiber
- Aramid Fiber
- Other Fibers (Natural/Bio Fiber)
- By End-use Industry
- Automotive and Transportation
- Wind Energy
- Aerospace and Defense
- Pipes and Tanks
- Construction
- Electrical and Electronics
- Sports and Recreation
- Other End user Industries (Healthcare, Marine, etc.)
- By Geography
- Asia-Pacific
- China
- India
- Japan
- South Korea
- Thailand
- Malaysia
- Indonesia
- Vietnam
- Rest of Asia-Pacific
- North America
- United States
- Canada
- Mexico
- Europe
- Germany
- United Kingdom
- France
- Italy
- Spain
- Russia
- NORDIC Countries
- Turkey
- Rest of Europe
- South America
- Brazil
- Argentina
- Colombia
- Rest of South America
- Middle East and Africa
- Saudi Arabia
- South Africa
- Nigeria
- Qatar
- Egypt
- United Arab Emirates
- Rest of Middle-East and Africa
- Asia-Pacific
Geography Analysis
Asia-Pacific anchors the composites market with 44.85% revenue in 2025 and is projected to grow at 7.45% through 2031 as China escalates offshore wind installations, India expands metro rail networks and Southeast Asia upgrades grid infrastructure. The regional composites market size also benefits from escalating carbon-fiber capacity; South Korea's Hyosung is lifting annual output to 9 000 t to meet aerospace and hydrogen-tank demand. Japan's value chain focuses on high-precision tow spreading and prepreg technologies, serving both domestic air-frame programs and export customers.
North America trails closely, propelled by sustained aerospace deliveries, federal investments in renewable energy and a resurgent recreational-marine segment. The United States Department of Energy earmarked USD 20 million to advance wind-turbine composite recycling, signalling policy momentum toward circularity. Canadian provinces sponsor advanced-materials clusters that couple academic R&D with injection over-molding pilot lines, aiming to retain domestic IP around bio-based thermoplastics.
Europe commands sophisticated design capabilities and stringent environmental regulations that foster rapid adoption of bio-resins and closed-loop processes. Although supply-chain disruptions and energy-cost spikes trimmed production in late-2024, the bloc maintains a 21.74% share of global volumes. Initiatives such as Vestas's circular blades and low-emission towers illustrate how EU climate policy is steering OEM priorities toward holistic sustainability. Eastern European nations, leveraging skilled labor and proximity to Western markets, are courting investment in pultrusion and filament-winding plants.
South America and the Middle East & Africa, while collectively smaller, are registering outsized percentage gains as infrastructure modernization and desalination projects specify composite solutions. Brazilian wind corridors, Saudi desalination brine lines and South African electric-bus bodies are notable demand pockets. Technology transfer from multinational players, combined with local reinforcement supply (sisal, jute), is catalysing indigenous innovation and gradually narrowing cost gaps with imported parts.
- 3M
- Arkema
- BASF
- CPIC BRASIL Fibras de Vidro Ltda
- DuPont
- Exel Composites
- Gurit Services AG
- Hexcel Corporation
- HS HYOSUNG ADVANCED MATERIALS
- Lanxess
- Mitsubishi Chemical Group Corporation.
- Nippon Graphite Fiber Co., Ltd.
- Owens Corning
- SGL Carbon
- Syensqo
- Teijin Limited
- Toray Industries Inc.
Additional Benefits:
- The market estimate (ME) sheet in Excel format
- 3 months of analyst support
TABLE OF CONTENTS
1 Introduction
- 1.1 Study Assumptions and Market Definition
- 1.2 Scope of the Study
2 Research Methodology
3 Executive Summary
4 Market Landscape
- 4.1 Market Overview
- 4.2 Market Drivers
- 4.2.1 Electrification-Driven Carbon-Fiber Demand in E-Mobility
- 4.2.2 Increasing Usage in the Manufacturing of Wind Turbine
- 4.2.3 Growing Adoption of Thermoplastic Composites in Mass-Production Automotive
- 4.2.4 Technological Advancement in the Field of Material Science
- 4.2.5 Increasing Use of Composites in the Aerospace and Defense Industry
- 4.3 Market Restraints
- 4.3.1 High Cost of Composite Materials
- 4.3.2 Challenges in Recycling of these Materials
- 4.3.3 Skilled-Labour Gap in Automated Lay-up Processes
- 4.4 Value Chain Analysis
- 4.5 Porter's Five Forces
- 4.5.1 Bargaining Power of Suppliers
- 4.5.2 Bargaining Power of Buyers
- 4.5.3 Threat of New Entrants
- 4.5.4 Threat of Substitutes
- 4.5.5 Degree of Competition
5 Market Size and Growth Forecasts (Value)
- 5.1 By Matrix Material
- 5.1.1 Polymer Matrix Composites (PMC)
- 5.1.1.1 Thermoset Resins
- 5.1.1.2 Thermoplastic Resins
- 5.1.2 Ceramic/Carbon Matrix Composites (CMCs)
- 5.1.3 Other Matrices (Metal Matrix Composites)
- 5.1.1 Polymer Matrix Composites (PMC)
- 5.2 By Reinforcement Fiber
- 5.2.1 Glass Fiber
- 5.2.2 Carbon Fiber
- 5.2.3 Aramid Fiber
- 5.2.4 Other Fibers (Natural/Bio Fiber)
- 5.3 By End-use Industry
- 5.3.1 Automotive and Transportation
- 5.3.2 Wind Energy
- 5.3.3 Aerospace and Defense
- 5.3.4 Pipes and Tanks
- 5.3.5 Construction
- 5.3.6 Electrical and Electronics
- 5.3.7 Sports and Recreation
- 5.3.8 Other End user Industries (Healthcare, Marine, etc.)
- 5.4 By Geography
- 5.4.1 Asia-Pacific
- 5.4.1.1 China
- 5.4.1.2 India
- 5.4.1.3 Japan
- 5.4.1.4 South Korea
- 5.4.1.5 Thailand
- 5.4.1.6 Malaysia
- 5.4.1.7 Indonesia
- 5.4.1.8 Vietnam
- 5.4.1.9 Rest of Asia-Pacific
- 5.4.2 North America
- 5.4.2.1 United States
- 5.4.2.2 Canada
- 5.4.2.3 Mexico
- 5.4.3 Europe
- 5.4.3.1 Germany
- 5.4.3.2 United Kingdom
- 5.4.3.3 France
- 5.4.3.4 Italy
- 5.4.3.5 Spain
- 5.4.3.6 Russia
- 5.4.3.7 NORDIC Countries
- 5.4.3.8 Turkey
- 5.4.3.9 Rest of Europe
- 5.4.4 South America
- 5.4.4.1 Brazil
- 5.4.4.2 Argentina
- 5.4.4.3 Colombia
- 5.4.4.4 Rest of South America
- 5.4.5 Middle East and Africa
- 5.4.5.1 Saudi Arabia
- 5.4.5.2 South Africa
- 5.4.5.3 Nigeria
- 5.4.5.4 Qatar
- 5.4.5.5 Egypt
- 5.4.5.6 United Arab Emirates
- 5.4.5.7 Rest of Middle-East and Africa
- 5.4.1 Asia-Pacific
6 Competitive Landscape
- 6.1 Strategic Moves
- 6.2 Market Share (%)/Ranking Analysis
- 6.3 Company Profiles {(includes Global level Overview, Market level overview, Core Segments, Financials as available, Strategic Information, Market Rank/Share for key companies, Products and Services, Recent Developments)}
- 6.3.1 3M
- 6.3.2 Arkema
- 6.3.3 BASF
- 6.3.4 CPIC BRASIL Fibras de Vidro Ltda
- 6.3.5 DuPont
- 6.3.6 Exel Composites
- 6.3.7 Gurit Services AG
- 6.3.8 Hexcel Corporation
- 6.3.9 HS HYOSUNG ADVANCED MATERIALS
- 6.3.10 Lanxess
- 6.3.11 Mitsubishi Chemical Group Corporation.
- 6.3.12 Nippon Graphite Fiber Co., Ltd.
- 6.3.13 Owens Corning
- 6.3.14 SGL Carbon
- 6.3.15 Syensqo
- 6.3.16 Teijin Limited
- 6.3.17 Toray Industries Inc.
7 Market Opportunities and Future Outlook
- 7.1 White-space and Unmet-Need Assessment


