

|
시장보고서
상품코드
2122482
대급조폭발물(Counter-IED) : 시장 점유율 분석, 업계 동향과 통계, 성장 예측(2026-2031년)Counter-IED - Market Share Analysis, Industry Trends & Statistics, Growth Forecasts (2026 - 2031) |
||||||
 Mordor Intelligence
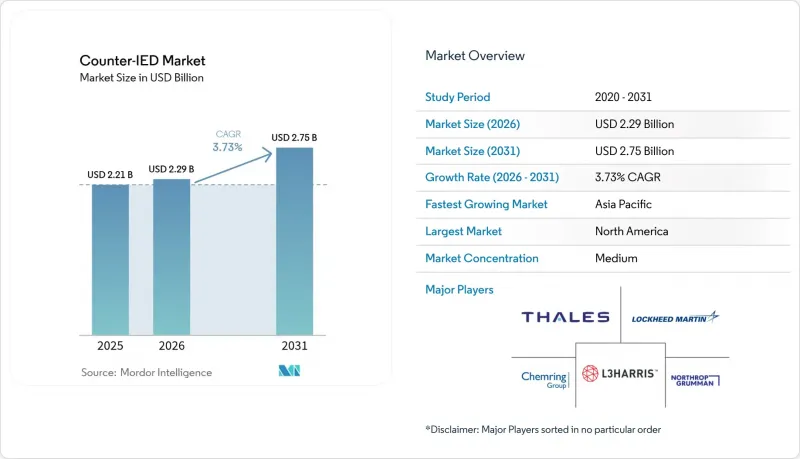
Mordor Intelligence에 의하면, 2026년 대급조폭발물(Counter-IED) 시장 규모는 22억 9,000만 달러로 추정되며, 2025년 22억 1,000만 달러에서 2031년에는 27억 5,000만 달러에 달할 것으로 예측됩니다.
또한 2026-2031년 연평균 성장률(CAGR)은 3.73%를 나타낼 전망입니다.
본 보고서는 기능별(감지 및 대응), 도입 형태별(차량 탑재형, 휴대형 등), 최종 사용자별(군 및 국토 안보), 기술별(RF 재밍, 센서 기반 감지, 로봇 및 자율 시스템), 지역별(북미, 유럽, 아시아태평양 등)로 분류되어 있습니다. 시장 전망은 금액(달러) 기준으로 제시되어 있습니다.
전 세계 IED 대응 시장 동향 및 인사이트
비대칭 전쟁 대비를 위한 국방 예산 배분 증가
각국의 국방부는 현재 증가하는 예산 중 비대칭적 위협에 대응하는 능력에 할당하는 비율을 확대되고 있습니다. 미국의 2026 회계연도 예산 요청액은 1조 100억 달러를 초과하며, 대테러 및 지뢰 제거 기술에 대한 자금 지원이 명시되어 있습니다. 2024년에 GDP의 2%라는 국방비 기준치를 넘어선 유럽의 NATO 회원국들은 우크라이나 작전 경험을 통해 얻은 교훈을 바탕으로 C-IED 프로그램에 대한 추가 자금 투입을 계속하고 있습니다. 동아시아의 국방비는 2023년에 4,110억 달러에 달했으며, 여전히 증가 추세를 보이고 있어 이에 따라 감지 레이더, 휴대용 파괴 장치, 그리고 경로 확보용 무인 지상 차량(UGV)에 대한 새로운 입찰이 진행되고 있습니다. 예산 확대에 따라 조달 기관들은 계속 늘어나는 자체 제작 장비에 대응하기 위해 개방형 아키텍처와 기술의 신속한 업데이트를 중시하고 있습니다.
유인·무인 연계(MUM-T)형 대 IED 자산 배치 가속화
MUM-T 전술은 시제 단계에서 실전 배치 단계로 넘어갔습니다. 미 육군의 ‘아파치 섀도우 그레이이글’ 실험에서는 자율적인 차량 행렬의 경로 확보가 입증되었으며, IED 제거 임무에서 상호 운용 가능한 데이터 링크의 유효성이 확인되었습니다. 이스라엘 방위군은 현재 고위험 무력화 임무에 ‘RobDozer’ 불도저와 M113을 기반으로 한 자율 시스템을 운용하여, 가자 국경 루트에서의 인명 피해를 줄이고 있습니다. 유럽의 지상군도 이에 발맞추어, 프랑스와 영국의 해상 기뢰 대책 및 ELROB 시험을 통해 라인메탈사의 UGV(무인 지상 차량)를 활용한 차량 행렬 선도 시스템이 공개되었습니다. 그 결과 발생한 수요는 유인 및 로봇 혼합 팀에 대응 가능한 확장성 있는 제어 소프트웨어와 표준화된 페이로드 베이의 개발을 촉진하고 있습니다.
전자전(EW) 등급 GaN RF 프런트엔드의 높은 자본 비용
갈륨 나이탈리아드(GaN) 전력 증폭기를 통해 CREW 송신기는 5G 시대의 광범위한 위협 범위를 커버할 수 있습니다. 이는 GaN이 기존의 비소화 갈륨 부품보다 높은 전자 이동도와 열 효율을 갖추고 있어, 더 소형화된 소자로 멀티 옥타브 대역에 걸쳐 kW급 출력을 실현할 수 있기 때문입니다. 반면, 제조 측면에서는 과제가 있습니다. GaN 층은 고가의 실리콘 카바이드 기판 위에 금속 유기 화학 기상 증착(MOCVD) 반응기를 사용하여 증착되지만, 웨이퍼 수율은 여전히 한 자릿수에 머물러 있어 프로브 테스트를 통과한 각 다이에는 높은 가격이 책정되어 있습니다. 미국과 유럽의 신뢰할 수 있는 파운드리 생산 능력이 제한적이라는 점이 문제를 더욱 심각하게 만들고 있으며, 주요 제조업체들은 상용 통신 구매자들과 동일한 에피택시 공정 할당량을 놓고 경쟁할 수밖에 없는 상황입니다. 그 결과, L-밴드의 평균 판매 가격은 와트당 20달러를 크게 상회하는 상태를 유지하고 있습니다. 노스롭 그루먼사의 기술 개요서에 따르면, 2027년까지 새로운 150mm 반응로와 자동화된 후공정 라인이 가동을 시작하지 않는 한, 다년간의 자금 조달 여력이 없는 소규모 동맹국에서는 여단 규모를 초과하는 대량 구매가 1년 이상 지연될 가능성이 있으며, 그 결과,일부 국방부가 기존 실리콘 재질의 재머를 계획보다 더 오랫동안 계속 사용하게 될 우려가 있다고 경고하고 있습니다.
부문 분석
2025년, 지휘관들이 수송대 출발 전에 폭탄을 발견하는 것을 우선시함에 따라 감지 솔루션이 대 IED 시장 매출에서 가장 큰 비중을 차지하며 대 IED 시장 점유율의 59.10%에 달했습니다. 고해상도 합성 개구 알고리즘과 결합된 지하 탐사 레이더는 보행 속도로도 토양의 변동을 식별할 수 있게 되었으며, 수동형 RF 스니퍼는 기폭 회로를 감지합니다. 작전 방침이 능동적 무력화로 전환됨에 따라, 대 IED 대책 시장 규모는 2031년까지 연평균 4.59%의 성장률을 보일 것으로 예측됩니다.
대책 수단에 대한 수요는 20 MHz에서 6GHz를 커버하는 광대역 CREW 송신기나, 광속으로 위협을 무력화하는 ‘아이언 빔’ 레이저와 같은 지향성 에너지 무기에 집중되고 있습니다. 로보틱스 분야도 새로운 영역을 확장하고 있습니다. IAI사의 ‘RobDozer’와 같은 장갑형 EOD UGV(무인 지상 차량)는 15톤의 쟁기날과 원격 조종식 파괴 장치를 채택하여, 공병을 위험에 빠뜨리지 않고 적대적인 지형에서 경로를 확보할 수 있게 해줍니다.
2025년 대(對) IED 시장 규모 중 차량 탑재형 시스템이 66.60%를 차지했습니다. 이는 재머, 카메라, 레이더를 전술 트럭에 통합하는 수송대 보호 교리에 기반을 둔 것입니다. 이 접근 방식은 차량용 전원 공급 장치와 방탄 차폐막을 제공하기 때문에 여단의 이동 및 병참 보급에 있어 표준적인 수단이 되었습니다.
그러나 성장의 중심은 점차 공중으로 옮겨가고 있습니다. 유인 헬리콥터나 그룹 4 무인항공기(UAV)에 매달리는 공중 포드는 연평균 성장률(CAGR) 5.18%를 나타낼 것으로 예측되며, 이는 모든 배치 범주 중 가장 빠른 성장률입니다. 미 해군의 초기형 ALMDS 지뢰 감지 포드와 육군의 NERO 전자전 페이로드는 그 매력을 여실히 보여주고 있습니다. 광범위한 커버리지, 도로변 매복에 대한 노출 최소화, 그리고 새로운 전구로 신속한 재배치가 가능합니다. 도보 부대는 도시 지역 골목길에서의 봉쇄 수색을 확실하게 수행하기 위해 여전히 11kg의 GMJ9500과 같은 휴대용 교란 장치에 의존하고 있습니다.
지역별 분석
2025년, 북미는 대급조폭발물(Counter-IED) 시장 매출의 49.30%를 차지했습니다. 이는 1조 달러 규모의 국방 예산과 이라크 및 아프가니스탄에서의 풍부한 작전 노하우에 힘입은 결과입니다. 미국 국방부(DoD)는 다중 영역 방어(Multi-Domain Defense) 프로토타입을 사용자 평가 단계로 진행하여 조달 주기를 단축하는 동시에 해당 지역에서의 주도권을 유지하고 있습니다. 캐나다의 국경 경비 강화와 멕시코의 조직 범죄 관련 IED에 대한 집중이 수요를 더욱 끌어올리고 있습니다.
아시아태평양의 대급조폭발물(Counter-IED) 시장은 남중국해 및 동중국해의 영토 갈등을 배경으로 2031년까지 연평균 성장률(CAGR) 5.05%를 나타낼 것으로 예측되며, 이는 전 지역 중 가장 높은 성장률입니다. 인도는 긴급 조달 규정에 따라 이스라엘산 레이더, 도로변용 재머, 로봇식 지뢰 제거기에 투자하고 있는 반면, 호주는 국방 전략 재검토(Defense Strategic Review)의 일환으로 무인 경로 정리 시스템에 자금을 투입하고 있습니다. 아세안(ASEAN) 국가들은 도시 지역의 교통 거점을 보호하기 위해 저비용 휴대용 방해 장치를 채택하고 있으며, 이로 인해 지역 고객 기반이 확대되고 있습니다. 유럽에서는 나토(NATO)의 ‘강화된 전방 주둔(Enhanced Forward Presence)’ 및 우크라이나 전쟁을 계기로 한 재군비 가속화로 인해 구매세가 유지되고 있습니다. 브뤼셀의 다자간 프로그램에서는 시험 프로토콜 및 수명 주기 지원이 조정되고 있으며, 독자적인 대지뢰·대급조폭발물(Counter-IED)(C-IED) 연구소를 보유하지 않은 소규모 회원국을 지원하고 있습니다. 중동 및 아프리카에서는 조달이 여전히 간헐적이지만, 석유 수출 수익 덕분에 걸프 국가들은 최고 수준의 지향성 에너지 시스템을 구매할 수 있게 되었으며, 한편 사헬 지역의 유엔 평화유지 활동은 견고한 감지 키트에 대한 수요를 뒷받침하고 있습니다.
기타 혜택:
- 엑셀 형식 시장 예측(ME) 시트
- 3개월간의 애널리스트 지원
자주 묻는 질문
목차
제1장 서론
제2장 조사 방법
제3장 주요 요약
제4장 시장 구도
제5장 시장 규모 및 성장 예측(금액 기준)
제6장 경쟁 구도
제7장 시장 기회와 향후 전망
LSH 26.09.03According to Mordor Intelligence, counter-IED market size in 2026 is estimated at USD 2.29 billion, growing from 2025 value of USD 2.21 billion with 2031 projections showing USD 2.75 billion, growing at 3.73% CAGR over 2026-2031.
This report is Segmented by Capability (Detection and Countermeasures), Deployment (Vehicle-Mounted, Hand-held/Man-portable, and More), End User (Military and Homeland Security), Technology (RF Jamming, Sensor-Based Detection, and Robotic and Autonomous Systems), and Geography (North America, Europe, Asia-Pacific, and More). The Market Forecasts are Provided in Terms of Value (USD).
Global Counter-IED Market Trends and Insights
Rising defense-budget allocation to asymmetric warfare preparedness
Defense ministries now allocate larger slices of rising budgets to irregular-threat capabilities. The US FY 2026 request tops USD 1.01 trillion, explicitly funding counter-terrorism and demining technologies. European NATO members that exceeded the 2% of GDP defense benchmark in 2024 continue to channel incremental funds toward C-IED programs, influenced by operational lessons from Ukraine. East Asian expenditure reached USD 411 billion in 2023 and is still climbing, translating into fresh tenders for detection radars, handheld disruptors, and route-clearance UGVs. As budgets grow, procurement agencies emphasize open architectures and rapid technology refresh to stay ahead of proliferating homemade devices.
Accelerated fielding of manned-unmanned teaming (MUM-T) C-IED assets
MUM-T doctrine has moved from prototypes to field deployment. The US Army's Apache-Shadow-Gray Eagle experiments demonstrated autonomous convoy route-clearance, validating interoperable data links for IED defeat missions. Israel Defense Forces now operate RobDozer bulldozers and M113-based autonomous systems for high-risk neutralization, cutting human exposure on Gaza border routes. European ground forces follow suit through the Franco-British Maritime Mine Counter Measures and ELROB trials that showcased Rheinmetall's UGV convoy leader. The resulting demand favors scalable control software and standardized payload bays compatible with mixed manned and robotic teams.
High capital cost of EW-grade GaN RF front-ends
Gallium-nitride power amplifiers let CREW transmitters cover wide 5G-era threat envelopes because GaN offers higher electron mobility and thermal efficiency than older gallium-arsenide parts, allowing smaller devices to push kilowatt-class output across multioctave bands. The downside is manufacturing: GaN layers are grown on costly silicon-carbide substrates in metal-organic chemical vapor deposition reactors that still run single-digit wafer yields, so each die that survives probe testing carries a premium price. Limited trusted-foundry capacity inside the United States and Europe compounds the problem, forcing primes to compete with commercial telecom buyers for the same epitaxy slots, which keeps average selling prices well above USD 20 per watt in the L-band. Northrop Grumman engineering briefs caution that unless new 150 mm reactors and automated back-end lines come online by 2027, volume buys larger than brigade scale could slip a year or more for smaller allies that lack multiyear funding lines, prompting some defense ministries to hold legacy silicon jammers longer than planned.
Other drivers and restraints analyzed in the detailed report include:
- Rapid advances in AI-enabled multi-sensor fusion for IED detection
- Growing demand for vehicle-agnostic CREW kits across allied armed forces
- Spectrum-management bottlenecks limiting CREW jamming power levels
For complete list of drivers and restraints, kindly check the Table Of Contents.
Segment Analysis
Detection solutions generated the largest slice of the counter-IED market revenue in 2025, equal to a 59.10% counter-IED market share, as commanders prioritized finding bombs before convoys rolled. Ground-penetrating radar paired with high-resolution synthetic-aperture algorithms now distinguishes disturbed soil at a walking pace, while passive RF sniffers flag trigger circuits. The counter-IED market size for countermeasures is projected to rise 4.59% annually to 2031 as doctrine shifts toward active defeat.
Demand for countermeasures centers on wideband CREW transmitters covering 20 MHz to 6 GHz and directed-energy weapons such as Iron Beam lasers that neutralize threats at the speed of light. Robotics adds another layer: armored EOD UGVs like IAI RobDozer employ 15-ton plow blades and remote-controlled disruptors, enabling route-clearance in hostile terrain without exposing sappers.
Vehicle-mounted systems accounted for 66.60% of the counter-IED market size in 2025, underpinned by convoy protection doctrines that embed jammers, cameras, and radars onto tactical trucks. The approach delivers on-board power and ballistic shielding, making it the default for brigade movement and logistics resupply.
Growth momentum, however, is shifting skyward. Aerial pods-whether slung under manned helicopters or Group 4 UAVs-are forecast to post a 5.18% CAGR, the fastest in the deployment category. Early US Navy ALMDS mine-detection pods and Army NERO EW payloads illustrate the appeal: wide area coverage, minimal exposure to roadside ambush, and quick redeployment to new theaters. Dismounted troops still rely on man-portable disruptors such as the 11 kg GMJ9500 to secure cordon searches in urban alleys.
Complete Report Scope:
- By Capability
- Detection
- Metal-detector-based systems
- Ground-penetrating-radar systems
- RF/EO/IR sensor fusion suites
- Countermeasures
- Stand-off jammers
- Directed-energy neutralizers
- Disruptor and EOD robotics
- Detection
- By Deployment
- Vehicle-Mounted
- Manned Tactical Vehicles
- Unmanned Ground Vehicles
- Hand-held/Man-portable
- Aerial-borne Pods and Payloads
- Vehicle-Mounted
- By End User
- Military
- Homeland Security
- By Technology
- RF Jamming
- Sensor-based Detection
- Robotic and Autonomous Systems
- By Geography
- North America
- United States
- Canada
- Mexico
- Europe
- Germany
- United Kingdom
- France
- Russia
- Rest of Europe
- Asia-Pacific
- China
- Japan
- India
- Australia
- Rest of Asia-Pacific
- South America
- Brazil
- Rest of South America
- Middle East and Africa
- Middle East
- United Arab Emirates
- Saudi Arabia
- Rest of Middle East
- Africa
- South Africa
- Rest of Africa
- Middle East
- North America
Geography Analysis
North America represented 49.30% of the counter-IED market revenue in 2025, sustained by a USD 1 trillion defense budget and deep operational know-how from Iraq and Afghanistan. The DoD pushes multi-domain protection prototypes into user evaluations, trimming acquisition cycles and preserving regional leadership. Canada's border-security upgrades and Mexico's focus on organized crime IEDs add incremental demand.
The Asia-Pacific counter-IED market exhibits a projected 5.05% CAGR through 2031, the fastest zone, propelled by territorial flashpoints in the South and East China seas. India invests in Israeli radars, roadside jammers, and robotic mine plows under emergency procurement rules, while Australia funds unmanned route clearance as part of its Defense Strategic Review implementation. ASEAN states adopt lower-cost man-portable disruptors to protect urban transit hubs, broadening the regional customer base. Europe sustains buying momentum through NATO's Enhanced Forward Presence and accelerated rearmament triggered by the war in Ukraine. Multinational programs in Brussels coordinate test protocols and life-cycle support, lifting smaller member states that lack Indigenous C-IED labs. In the Middle East and Africa, procurement remains episodic, but oil-export gains allow Gulf states to purchase top-tier directed-energy systems, while UN peacekeeping missions in the Sahel fuel demand for rugged detection kits.
- Lockheed Martin Corporation
- Northrop Grumman Corporation
- L3Harris Technologies, Inc.
- Chemring Group PLC
- Thales Group
- Elbit Systems Ltd.
- Rheinmetall AG
- Israel Aerospace Industries Ltd.
- QinetiQ Group
- Allen-Vanguard Corporation
- BAE Systems plc
- SRC, Inc.
- Armtrac Limited
- Leonardo S.p.A
- Sierra Nevada Company, LLC
- Oshkosh Defense, LLC
Additional Benefits:
- The market estimate (ME) sheet in Excel format
- 3 months of analyst support
TABLE OF CONTENTS
1 INTRODUCTION
- 1.1 Study Assumptions and Market Definition
- 1.2 Scope of the Study
2 RESEARCH METHODOLOGY
3 EXECUTIVE SUMMARY
4 MARKET LANDSCAPE
- 4.1 Market Overview
- 4.2 Market Drivers
- 4.2.1 Rising defense-budget allocation to asymmetric warfare preparedness
- 4.2.2 Accelerated fielding of manned-unmanned teaming C-IED assets
- 4.2.3 Rapid advances in AI-enabled multi-sensor fusion for IED detection
- 4.2.4 Growing demand for vehicle-agnostic CREW kits across allied forces
- 4.2.5 Convergence of C-IED and C-UAS architectures
- 4.2.6 National regulations on precursor-chemical tracking
- 4.3 Market Restraints
- 4.3.1 High capital cost of EW-grade GaN RF front-ends
- 4.3.2 Spectrum-management bottlenecks limiting CREW power
- 4.3.3 Complex integration with legacy battle-management systems
- 4.3.4 Export-license delays under Wassenaar Arrangement
- 4.4 Value Chain Analysis
- 4.5 Regulatory Landscape
- 4.6 Technological Outlook
- 4.7 Porter's Five Forces Analysis
- 4.7.1 Threat of New Entrants
- 4.7.2 Bargaining Power of Buyers
- 4.7.3 Bargaining Power of Suppliers
- 4.7.4 Threat of Substitutes
- 4.7.5 Intensity of Competitive Rivalry
5 MARKET SIZE AND GROWTH FORECASTS ( VALUE)
- 5.1 By Capability
- 5.1.1 Detection
- 5.1.1.1 Metal-detector-based systems
- 5.1.1.2 Ground-penetrating-radar systems
- 5.1.1.3 RF/EO/IR sensor fusion suites
- 5.1.2 Countermeasures
- 5.1.2.1 Stand-off jammers
- 5.1.2.2 Directed-energy neutralizers
- 5.1.2.3 Disruptor and EOD robotics
- 5.1.1 Detection
- 5.2 By Deployment
- 5.2.1 Vehicle-Mounted
- 5.2.1.1 Manned Tactical Vehicles
- 5.2.1.2 Unmanned Ground Vehicles
- 5.2.2 Hand-held/Man-portable
- 5.2.3 Aerial-borne Pods and Payloads
- 5.2.1 Vehicle-Mounted
- 5.3 By End User
- 5.3.1 Military
- 5.3.2 Homeland Security
- 5.4 By Technology
- 5.4.1 RF Jamming
- 5.4.2 Sensor-based Detection
- 5.4.3 Robotic and Autonomous Systems
- 5.5 By Geography
- 5.5.1 North America
- 5.5.1.1 United States
- 5.5.1.2 Canada
- 5.5.1.3 Mexico
- 5.5.2 Europe
- 5.5.2.1 Germany
- 5.5.2.2 United Kingdom
- 5.5.2.3 France
- 5.5.2.4 Russia
- 5.5.2.5 Rest of Europe
- 5.5.3 Asia-Pacific
- 5.5.3.1 China
- 5.5.3.2 Japan
- 5.5.3.3 India
- 5.5.3.4 Australia
- 5.5.3.5 Rest of Asia-Pacific
- 5.5.4 South America
- 5.5.4.1 Brazil
- 5.5.4.2 Rest of South America
- 5.5.5 Middle East and Africa
- 5.5.5.1 Middle East
- 5.5.5.1.1 United Arab Emirates
- 5.5.5.1.2 Saudi Arabia
- 5.5.5.1.3 Rest of Middle East
- 5.5.5.2 Africa
- 5.5.5.2.1 South Africa
- 5.5.5.2.2 Rest of Africa
- 5.5.5.1 Middle East
- 5.5.1 North America
6 COMPETITIVE LANDSCAPE
- 6.1 Market Concentration
- 6.2 Strategic Moves
- 6.3 Market Share Analysis
- 6.4 Company Profiles (includes Global level Overview, Market level overview, Core Segments, Financials as available, Strategic Information, Market Rank/Share for key companies, Products and Services, and Recent Developments)
- 6.4.1 Lockheed Martin Corporation
- 6.4.2 Northrop Grumman Corporation
- 6.4.3 L3Harris Technologies, Inc.
- 6.4.4 Chemring Group PLC
- 6.4.5 Thales Group
- 6.4.6 Elbit Systems Ltd.
- 6.4.7 Rheinmetall AG
- 6.4.8 Israel Aerospace Industries Ltd.
- 6.4.9 QinetiQ Group
- 6.4.10 Allen-Vanguard Corporation
- 6.4.11 BAE Systems plc
- 6.4.12 SRC, Inc.
- 6.4.13 Armtrac Limited
- 6.4.14 Leonardo S.p.A
- 6.4.15 Sierra Nevada Company, LLC
- 6.4.16 Oshkosh Defense, LLC
7 MARKET OPPORTUNITIES AND FUTURE OUTLOOK
- 7.1 White-space and Unmet-Need Assessment


