

|
시장보고서
상품코드
2122501
산업 분석 : 시장 점유율 분석, 업계 동향과 통계, 성장 예측(2026-2031년)Industrial Analytics - Market Share Analysis, Industry Trends & Statistics, Growth Forecasts (2026 - 2031) |
||||||
 Mordor Intelligence
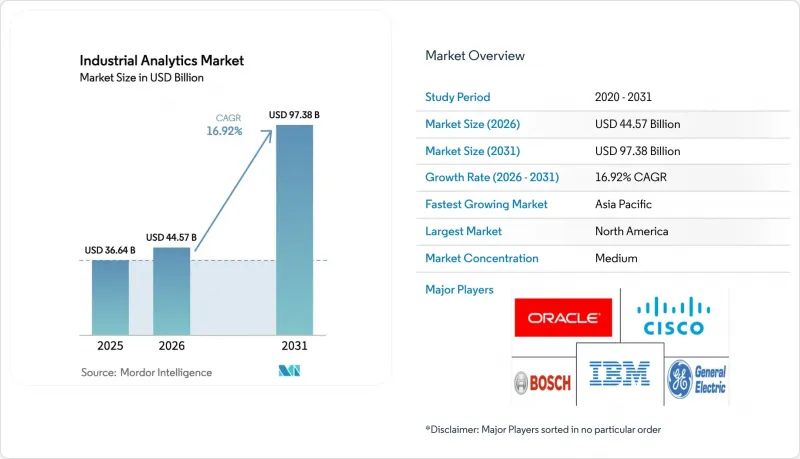
Mordor Intelligence에 의하면, 산업용 애널리틱스 시장 규모는 2025년에 366억 4,000만 달러로 평가되었고, 2026년445억 7,000만 달러에서 2031년까지 973억 8,000만 달러에 이를 것으로 예측되며, 예측 기간(2026-2031년) CAGR은 16.92%를 기록할 전망입니다.
본 보고서는 도입 형태(On-Premise 및 클라우드), 구성 요소(소프트웨어 및 서비스), 분석 유형(예측 분석 등), 최종 사용자 산업(제조업, 건설업 등), 조직 규모(중소기업 등), 용도(자산 성과 관리 등), 지역별로 분류되어 있습니다. 시장 예측은 금액(달러) 기준으로 제시되어 있습니다.
세계 산업용 애널리틱스 시장 동향 및 인사이트
엣지 컴퓨팅 기능의 확대
엣지 로컬라이즈된 추론을 통해 로봇 경로 계획, 비전 기반 품질 검사, 변전소 고장 위치 파악 등 지연 시간에 민감한 작업에서 발생하는 네트워크 병목 현상이 해소됩니다. Honeywell과 Google Cloud는 센서 스트림을 현장에서 처리하는 마이크로 노드를 도입하여 대역폭 비용을 30% 절감했습니다. IBM은 연결이 불안정한 해양 플랫폼에서 예측 모델을 실행하는 15와트 엣지 디바이스를 출시했습니다. Microsoft Azure Stack은 Siemens Industrial Edge와 원활하게 통합되어 있어, 제조업체는 중앙에서 모델을 학습시킨 후 압축된 가중치를 현장 게이트웨이로 전송할 수 있습니다. 이러한 아키텍처를 통해 네트워크 장애 시에도 업무가 중단되지 않고, 실시간 제어 루프를 1자리 밀리초 단위의 시간 범위 내에서 작동시킬 수 있습니다. 그 결과로 가져오는 생산성 향상 덕분에 엣지 컴퓨팅은 산업용 분석 시장에서 가장 큰 영향력을 가진 촉진요인 중 하나가 되었습니다.
로우코드 플랫폼에 산업용 AI 통합
드래그 앤 드롭 방식의 워크플로를 통해 유지보수, 품질 관리, 물류 프로세스에 분석 기능을 원활하게 통합할 수 있어 Python이나 SQL 기술이 필요하지 않습니다. 베인 앤 컴퍼니(Bain & Company)의 조사에 따르면, 공장에서 기존의 프로그래밍 대신 로우코드 도구를 사용했을 때 도입 시간이 60% 단축된 것으로 나타났습니다. Microsoft Power Platform에는 펌프, 모터, 압축기용으로 최적화된 이상 감지 모델이 기본으로 탑재되어 있습니다. IFS와 ServiceNow는 센서 이벤트를 작업 지시서 작성과 연동하여 기술자가 즉시 처방적 조치를 받을 수 있도록 하고 있습니다. 맥킨지의 ‘2025 Lighthouse Network’ 조사에 따르면, 로우코드를 도입한 공장에서는 근본 원인 분석 속도가 25% 빨라진 것으로 나타났습니다. 설정의 용이성은 소규모 공장의 도입 장벽을 낮추고, 산업용 분석 시장의 모범 사례 확산을 가속화합니다.
국경을 초월한 클라우드 도입에 따른 데이터 주권에 대한 우려
중국의 ‘데이터 보안법’은 다국적 기업에 운영 데이터를 국내 서버에 저장할 것을 의무화하고 있어, 전 세계 데이터 레이크의 통합을 저해하고 있습니다. EU의 GDPR(EU 개인정보보호규정)은 접근 제어에 사용되는 직원의 생체 인식 데이터 수출을 제한하고 있어, 벤더들은 지역별 추론 클러스터를 구축할 수밖에 없는 상황입니다. 인도의 ‘디지털 개인 데이터 보호법’ 초안도 유사한 현지화 조항을 채택할 가능성이 있습니다. 이러한 사일로화는 인프라 비용을 증가시키고, 모델 훈련을 파편화하며, 기능 배포를 지연시킵니다. 산업용 분석 시장에 있어 이는 마찰 요인이 되며, 벤더는 엣지 또는 하이브리드 아키텍처를 통해서만 이를 완화할 수 있습니다.
부문 분석
2025년에는 제조업체들이 종량제 및 사전 학습된 모델을 채택한 결과, 클라우드 기반 도입이 산업용 분석 시장 점유율의 59.12%를 차지했습니다. Microsoft Azure, AWS IoT SiteWise, Google Cloud Vertex AI와의 통합에 힘입어, 클라우드 도입에 따른 산업용 애널리틱스 시장 규모는 연평균 성장률(CAGR) 17.09%로 확대될 것으로 예측됩니다. On-Premise 시스템은 국방 및 제약 업계에서 지연 시간이 중요한 워크플로우를 계속 담당하고 있으며, 수요의 40.88%를 차지하고 있습니다. 하이브리드 이용 사례는 계속해서 증가하고 있습니다. 슈나이더 일렉트릭의 ‘EcoStruxure’는 모델을 양방향으로 동기화함으로써, 규제 대상 데이터를 On-Premise에 보관하면서도 클라우드 기반 재훈련의 이점을 누릴 수 있도록 합니다. ABB의 ‘Ability Genix’도 유사한 이점을 제공하며, 연합 아키텍처가 단일 스택 내에서 주권, 가동 시간, 확장성 요건을 어떻게 충족시킬 수 있는지 입증하고 있습니다.
로컬 게이트웨이와 중앙 집중식 MLOps 파이프라인의 네트워크가 확대됨에 따라, 기업은 기밀 데이터를 보유하면서도 클라우드상의 익명화된 동종 업계 경쟁사의 지표 및 성과를 비교·평가할 수 있게 됩니다. 이러한 하이브리드 접근 방식은 여러 관할 구역에 걸쳐 사업을 전개하는 다국적 제조업체들로부터 지지를 받고 있습니다. 오케스트레이션 도구가 성숙해짐에 따라 하이브리드 아키텍처가 신규 도입의 주류가 될 것으로 예상되며, 이는 미래 산업용 분석 시장의 성장에서 핵심적인 역할을 확고히할 것입니다.
2025년에는 소프트웨어가 매출의 62.34%를 차지했으나, 서비스 부문은 2031년까지 연평균 성장률(CAGR) 17.21%로 빠르게 추격하고 있습니다. 기업들은 센서 통합, 특징량 엔지니어링, 지속적인 모델 튜닝을 액센츄어, 딜로이트, PwC 등의 파트너사에 아웃소싱하고 있습니다. 그 결과, 산업용 애널리틱스 시장에서 서비스 부문의 규모는 소프트웨어 부문보다 빠르게 확대되고 있습니다. SAP와 IBM에서 지멘스에 이르는 각 벤더들은 장비 프로파일 라이브러리, 이상 임계값 보정, 보안 패치 적용 등을 포함한 관리형 서비스를 패키지화하고 있습니다.
산업용 자산은 시간이 지남에 따라 노후화되고, 공정 변수는 변동하기 때문에 애널리틱스 이니셔티브에는 지속적인 재조정이 필요합니다. 고객은 변경 관리 및 도메인 전문 지식을 통합하기 위해 시스템 통합 업체에 의존하고 있습니다. 이러한 서비스 중심 모델을 통해 애널리틱스는 자본 지출에서 운영비로 전환되고, 벤더와 고객 간의 관계가 심화되며, 2031년까지 산업용 애널리틱스 시장을 형성할 지속적인 수익원이 조성되고 있습니다.
지역별 분석
2025년, 북미는 산업용 애널리틱스 시장 점유율의 38.29%를 차지했습니다. 이는 ‘CHIPS and Science Act’와 관련된 반도체, 자동차, 석유 및 가스 분야에 대한 투자가 주도한 결과입니다. 연방 정부의 인센티브에는 디지털 트윈 기능 도입이 규정되어 있으며, 이는 신규 공장(그린필드)에서의 애널리틱스 도입을 촉진하고 있습니다. 캐나다의 ‘전략적 혁신 기금(Strategic Innovation Fund)’은 항공우주 및 전기차 배터리 시범 사업을 지원하고 있으며, 한편 멕시코의 니어쇼어링 프로젝트에서는 공장 시운전을 가속화하기 위해 클라우드-엣지 하이브리드 방식이 채택되었습니다. 주마다 다른 개인정보 보호법으로 인해 규정 준수 부담은 증가하고 있지만, 한편으로는 거버넌스 모듈에 대한 수요도 자극하여 간접적으로 소프트웨어 공급업체에 이익을 가져다주고 있습니다.
아시아태평양은 2031년까지 연평균 성장률(CAGR) 17.96%를 나타낼 것으로 예측됩니다. 중국은 보조금을 스마트 제조 지표와 연계하여, 공장에 디지털 트윈을 도입해 생산 라인을 개조하도록 장려하고 있습니다. 인도의 ‘생산 연계 인센티브(PLI)’ 제도에서는 보조금 수령 요건으로 실시간 품질 분석을 요구하고 있으며, 이는 산업용 애널리틱스 시장에 시너지 효과를 가져오고 있습니다. 일본의 ‘사회 5.0’은 피로 예측 모델을 활용한 인간과 로봇의 협업을 추진하고 있는 반면, 한국의 스마트 팩토리 프로그램은 중소기업의 애널리틱스 도입을 지원하고 있습니다. 호주의 광산에서는 엣지 애널리틱스를 활용해 운반 트럭의 효율을 높이고 있으며, 동남아시아의 수출 기업들은 EU의 실사 요건을 충족하기 위해 컴플라이언스 대시보드를 도입하고 있습니다.
유럽 성장의 열쇠는 지속가능성 관련 규정 준수에 있습니다. ‘기업 지속가능성 보고 지침(CSRD)’은 설비 수준의 에너지 감사를 추진하고 있으며, 독일의 ‘인더스트리 4.0’ 보조금은 중견 제조업체가 디지털 트윈을 도입하도록 장려하고 있습니다. 프랑스의 ‘미래 산업’ 세제 혜택과 영국의 ‘메이드 스마터(Made Smarter)’ 보조금도 수요를 더욱 확대시키고 있습니다. 동유럽 시장은 아직 발전 단계에 있지만, 러시아의 현지 공급업체들은 수입 규제를 회피하기 위해 국내 규격에 맞춘 솔루션을 제공함으로써 산업용 애널리틱스 시장에 지역 특유의 색채를 더하고 있습니다.
중동 및 아프리카 및 남미는 새로운 성장 거점으로 부상하고 있습니다. 사우디아라비아의 ‘비전 2030’은 석유화학 및 유틸리티 분야의 분석 기술을 추진하고 있으며, 남아프리카의 광산에서는 가스 누출을 감지하기 위한 안전 분석 기술이 도입되고 있습니다. 브라질의 농업 비즈니스 체인에서는 정밀 농업과 식품 가공 분석을 통합하고 있으며, 아르헨티나의 리튬 생산업체들은 물 사용량을 줄이기 위해 모델을 활용하고 있습니다. 절대적인 지출 규모는 선진 지역보다 낮지만, 이들 지역 전반에서 시범 프로젝트가 가속화되면서 산업 분석 시장의 세계 확장 범위를 넓히고 있습니다.
기타 혜택:
- 엑셀 형식 시장 전망(ME) 시트
- 3개월간의 애널리스트 지원
자주 묻는 질문
목차
제1장 서론
제2장 조사 방법
제3장 주요 요약
제4장 시장 구도
제5장 시장 규모와 성장 예측
제6장 경쟁 구도
제7장 시장 기회와 향후 전망
LSH 26.09.03According to Mordor Intelligence, the industrial analytics market size was valued at USD 36.64 billion in 2025 and is estimated to grow from USD 44.57 billion in 2026 to reach USD 97.38 billion by 2031, at a CAGR of 16.92% during the forecast period (2026-2031).
This report is Segmented by Deployment (On-Premises, and Cloud), Component (Software, and Services), Analytics Type (Predictive Analytics, and More), End-User Industry (Manufacturing, Construction, and More), Organization Size (Small and Medium-Sized Enterprises, and More), Application (Asset Performance Management, and More), and Geography. The Market Forecasts are Provided in Terms of Value (USD).
Global Industrial Analytics Market Trends and Insights
Expansion of Edge Computing Capabilities
Edge-localized inference eliminates network bottlenecks for latency-sensitive tasks such as robotic path planning, vision-based quality checks, and substation fault isolation. Honeywell and Google Cloud deployed micro-nodes that process sensor streams on-site, reducing bandwidth costs by 30%. IBM shipped 15-watt edge devices that run predictive models on offshore platforms where connectivity is sporadic. Microsoft Azure Stack integrates seamlessly with Siemens Industrial Edge, allowing manufacturers to train centrally and then push compressed weights to shop-floor gateways. Such architectures ensure uninterrupted operations when networks fail and allow real-time control loops to operate within single-digit millisecond windows. Resulting productivity gains make edge computing one of the highest-impact catalysts for the industrial analytics market.
Integration of Industrial AI in Low-Code Platforms
Drag-and-drop workflows seamlessly embed analytics into maintenance, quality, and logistics processes, eliminating the need for Python or SQL skills. Bain research showed a 60% reduction in deployment time when plants used low-code tools versus traditional programming. Microsoft Power Platform now ships with anomaly-detection models tuned for pumps, motors, and compressors. IFS and ServiceNow link sensor events to work-order generation, allowing technicians to receive prescriptive actions instantly. McKinsey's 2025 Lighthouse Network found that factories that embraced low-code recorded 25% faster root-cause analyses. The ease of configuration lowers barriers for small plants and accelerates the diffusion of industrial analytics market best practices.
Data-Sovereignty Concerns in Cross-Border Cloud Deployments
China's Data Security Law forces multinationals to store operational data on domestic servers, preventing global data-lake consolidation. The EU's GDPR restricts the exporting of employee biometrics used in access control, driving vendors to set up regional inference clusters. India's draft Digital Personal Data Protection Act may adopt similar localization clauses. Each silo raises infrastructure costs, fragments model training, and slows feature rollouts. For the industrial analytics market, this introduces friction that vendors can only mitigate with edge or hybrid architectures.
Other drivers and restraints analyzed in the detailed report include:
- Proliferation of 5G-Enabled Industrial IoT Networks
- Regulatory Push for Energy-Efficient Operations
- Shortage of Industrial-Domain-Specific Data Scientists
For complete list of drivers and restraints, kindly check the Table Of Contents.
Segment Analysis
Cloud-based implementations accounted for 59.12% of the industrial analytics market share in 2025, as manufacturers adopted consumption pricing and pre-trained models. The industrial analytics market size for cloud deployments is projected to expand at a 17.09% CAGR, driven by integrations with Microsoft Azure, AWS IoT SiteWise, and Google Cloud Vertex AI. On-premises systems continue to serve latency-critical workflows in defense and pharmaceutical industries, accounting for 40.88% of demand. Hybrid use cases are multiplying. Schneider Electric's EcoStruxure synchronizes models bi-directionally, allowing regulatory data to remain on-site while benefiting from cloud-based retraining. ABB's Ability Genix offers similar advantages, demonstrating how federated architectures can satisfy sovereignty, uptime, and scalability within a single stack.
The growing mesh of local gateways and centralized MLOps pipelines enables firms to retain sensitive data while benchmarking performance against anonymized peer metrics in the cloud. This blended approach resonates with multinational manufacturers juggling multiple jurisdictions. As orchestration tooling matures, hybrid architectures are expected to dominate new deployments, cementing their role at the core of future industrial analytics market growth.
Software represented 62.34% revenue in 2025, but services are catching up fast with a 17.21% CAGR through 2031. Enterprises outsource sensor integration, feature engineering, and continuous model tuning to partners such as Accenture, Deloitte, and PwC. As a result, the industrial analytics market size for services is expanding faster than the software layer. Vendors, ranging from SAP and IBM to Siemens, bundle managed offerings that include equipment profile libraries, anomaly threshold calibration, and security patching.
Because industrial assets age and process variables drift, analytics initiatives require perpetual recalibration. Customers rely on system integrators to embed change management and domain expertise. This service-centric model transforms analytics from a capital purchase into an operational expenditure, deepening vendor-client relationships and fostering recurring revenue streams that will shape the industrial analytics market through 2031.
Complete Report Scope:
- By Deployment
- On-Premises
- Cloud
- By Component
- Software
- Services
- By Analytics Type
- Descriptive Analytics
- Predictive Analytics
- Prescriptive Analytics
- By End-User Industry
- Manufacturing
- Construction
- Mining
- Transportation and Logistics
- Utilities
- Other End-User Industry
- By Organization Size
- Large Enterprises
- Small and Medium-Sized Enterprises
- By Application
- Asset Performance Management
- Quality and Process Optimization
- Supply-Chain and Inventory Analytics
- Energy Management
- Safety and Risk Analytics
- By Geography
- North America
- United States
- Canada
- Mexico
- Europe
- Germany
- United Kingdom
- France
- Russia
- Rest of Europe
- Asia-Pacific
- China
- Japan
- India
- South Korea
- Australia
- Rest of Asia-Pacific
- Middle East and Africa
- Middle East
- Saudi Arabia
- United Arab Emirates
- Rest of Middle East
- Africa
- South Africa
- Egypt
- Rest of Africa
- Middle East
- South America
- Brazil
- Argentina
- Rest of South America
- North America
Geography Analysis
North America contributed 38.29% of the industrial analytics market share in 2025, driven by investments in the semiconductor, automotive, and oil and gas sectors, linked to the CHIPS and Science Act. Federal incentives stipulate digital-twin capabilities, catalyzing analytics deployments across greenfield fabs. Canada's Strategic Innovation Fund backed aerospace and EV battery pilots, while Mexican nearshoring projects embraced cloud-edge hybrids to accelerate plant commissioning. Fragmented state privacy laws raise compliance overhead but also spur demand for governance modules, indirectly benefiting software vendors.
Asia-Pacific is forecast to record a 17.96% CAGR through 2031. China ties subsidies to smart-manufacturing metrics, pushing factories to retrofit lines with digital twins. India's Production-Linked Incentive scheme requires real-time quality analytics for reimbursement eligibility, creating a multiplier effect for the industrial analytics market. Japan's Society 5.0 promotes human-robot collaboration powered by fatigue-prediction models, while South Korea's smart-factory program subsidizes the adoption of SME analytics. Australia's mining sites utilize edge analytics to enhance haul-truck efficiency, while Southeast Asian exporters implement compliance dashboards to meet EU due diligence requirements.
Europe's growth story revolves around sustainability compliance. The Corporate Sustainability Reporting Directive promotes equipment-level energy audits, while Germany's Industrie 4.0 grants encourage mid-size manufacturers to adopt digital twins. France's Industry of the Future tax incentives and the United Kingdom's Made Smarter grants further expand demand. Eastern markets remain nascent, but local vendors in Russia tailor offerings to national standards to circumvent import restrictions, adding regional flavor to the industrial analytics market.
The Middle East and Africa, along with South America, represent emerging growth pockets. Saudi Arabia's Vision 2030 drives analytics for petrochemicals and utilities, and South Africa's mines deploy safety analytics to detect gas leaks. Brazil's agribusiness chains integrate precision agriculture with food-processing analytics, and Argentina's lithium producers utilize models to reduce water usage. Although absolute spend is lower than in developed regions, pilot projects are accelerating across these territories, widening the global footprint of the industrial analytics market.
- Cisco Systems
- IBM Corporation
- General Electric Company
- Amazon Web Services Inc.
- Oracle Corporation
- Hewlett-Packard Enterprise
- Robert Bosch GmbH
- Microsoft Corporation
- SAP SE
- ABB Ltd.
- Siemens AG
- Hitachi Ltd.
- Honeywell International Inc.
- Schneider Electric SE
- SAS Institute Inc.
- Splunk Inc.
- Rockwell Automation Inc.
- PTC Inc.
- Intel Corporation
- Uptake Technologies Inc.
Additional Benefits:
- The market estimate (ME) sheet in Excel format
- 3 months of analyst support
TABLE OF CONTENTS
1 INTRODUCTION
- 1.1 Study Assumptions and Market Definition
- 1.2 Scope of the Study
2 RESEARCH METHODOLOGY
3 EXECUTIVE SUMMARY
4 MARKET LANDSCAPE
- 4.1 Market Overview
- 4.2 Market Drivers
- 4.2.1 Expansion of Edge Computing Capabilities
- 4.2.2 Integration of Industrial AI in Low-Code Platforms
- 4.2.3 Proliferation of 5G-Enabled Industrial IoT Networks
- 4.2.4 Regulatory Push for Energy-Efficient Operations
- 4.2.5 Standardization of Digital Twins Across Asset-Intensive Sectors
- 4.2.6 Mainstream Adoption of Pay-per-Use Analytics Models
- 4.3 Market Restraints
- 4.3.1 Data-Sovereignty Concerns in Cross-Border Cloud Deployments
- 4.3.2 Shortage of Industrial-Domain-Specific Data Scientists
- 4.3.3 Cyber-physical Security Vulnerabilities in OT Networks
- 4.3.4 Legacy Equipment Integration Costs
- 4.4 Industry Value Chain Analysis
- 4.5 Regulatory Landscape
- 4.6 Technological Outlook
- 4.7 Impact of Macroeconomic Factors on the Market
- 4.8 Porter's Five Forces Analysis
- 4.8.1 Bargaining Power of Suppliers
- 4.8.2 Bargaining Power of Buyers
- 4.8.3 Threat of New Entrants
- 4.8.4 Threat of Substitutes
- 4.8.5 Intensity of Competitive Rivalry
5 MARKET SIZE AND GROWTH FORECASTS (VALUE)
- 5.1 By Deployment
- 5.1.1 On-Premises
- 5.1.2 Cloud
- 5.2 By Component
- 5.2.1 Software
- 5.2.2 Services
- 5.3 By Analytics Type
- 5.3.1 Descriptive Analytics
- 5.3.2 Predictive Analytics
- 5.3.3 Prescriptive Analytics
- 5.4 By End-User Industry
- 5.4.1 Manufacturing
- 5.4.2 Construction
- 5.4.3 Mining
- 5.4.4 Transportation and Logistics
- 5.4.5 Utilities
- 5.4.6 Other End-User Industry
- 5.5 By Organization Size
- 5.5.1 Large Enterprises
- 5.5.2 Small and Medium-Sized Enterprises
- 5.6 By Application
- 5.6.1 Asset Performance Management
- 5.6.2 Quality and Process Optimization
- 5.6.3 Supply-Chain and Inventory Analytics
- 5.6.4 Energy Management
- 5.6.5 Safety and Risk Analytics
- 5.7 By Geography
- 5.7.1 North America
- 5.7.1.1 United States
- 5.7.1.2 Canada
- 5.7.1.3 Mexico
- 5.7.2 Europe
- 5.7.2.1 Germany
- 5.7.2.2 United Kingdom
- 5.7.2.3 France
- 5.7.2.4 Russia
- 5.7.2.5 Rest of Europe
- 5.7.3 Asia-Pacific
- 5.7.3.1 China
- 5.7.3.2 Japan
- 5.7.3.3 India
- 5.7.3.4 South Korea
- 5.7.3.5 Australia
- 5.7.3.6 Rest of Asia-Pacific
- 5.7.4 Middle East and Africa
- 5.7.4.1 Middle East
- 5.7.4.1.1 Saudi Arabia
- 5.7.4.1.2 United Arab Emirates
- 5.7.4.1.3 Rest of Middle East
- 5.7.4.2 Africa
- 5.7.4.2.1 South Africa
- 5.7.4.2.2 Egypt
- 5.7.4.2.3 Rest of Africa
- 5.7.4.1 Middle East
- 5.7.5 South America
- 5.7.5.1 Brazil
- 5.7.5.2 Argentina
- 5.7.5.3 Rest of South America
- 5.7.1 North America
6 COMPETITIVE LANDSCAPE
- 6.1 Market Concentration
- 6.2 Strategic Moves
- 6.3 Market Share Analysis
- 6.4 Company Profiles (includes Global Level Overview, Market Level Overview, Core Segments, Financials as available, Strategic Information, Market Rank/Share for key companies, Products and Services, and Recent Developments)
- 6.4.1 Cisco Systems
- 6.4.2 IBM Corporation
- 6.4.3 General Electric Company
- 6.4.4 Amazon Web Services Inc.
- 6.4.5 Oracle Corporation
- 6.4.6 Hewlett-Packard Enterprise
- 6.4.7 Robert Bosch GmbH
- 6.4.8 Microsoft Corporation
- 6.4.9 SAP SE
- 6.4.10 ABB Ltd.
- 6.4.11 Siemens AG
- 6.4.12 Hitachi Ltd.
- 6.4.13 Honeywell International Inc.
- 6.4.14 Schneider Electric SE
- 6.4.15 SAS Institute Inc.
- 6.4.16 Splunk Inc.
- 6.4.17 Rockwell Automation Inc.
- 6.4.18 PTC Inc.
- 6.4.19 Intel Corporation
- 6.4.20 Uptake Technologies Inc.
7 MARKET OPPORTUNITIES AND FUTURE OUTLOOK
- 7.1 White-Space and Unmet-Need Assessment


