

|
시장보고서
상품코드
2122515
데이터 레이크 : 시장 점유율 분석, 업계 동향과 통계, 성장 예측(2026-2031년)Data Lake - Market Share Analysis, Industry Trends & Statistics, Growth Forecasts (2026 - 2031) |
||||||
 Mordor Intelligence
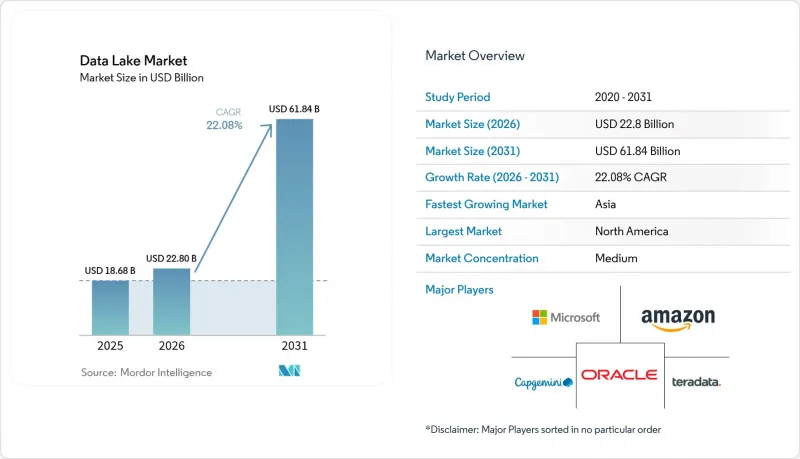
Mordor Intelligence에 의하면, 데이터 레이크 시장 규모는 2025년 186억 8,000만 달러에서 2026년에는 228억 달러로 성장하고, 2026-2031년 CAGR 22.08%로 성장을 지속하여 2031년에는 618억 4,000만 달러에 달할 것으로 예측됩니다.
본 보고서는 제공 형태(솔루션 및 서비스), 도입 형태(클라우드 및 하이브리드/멀티 클라우드), 조직 규모(대기업 및 중소기업), 업무 기능(운영 및 공급망, 재무 및 리스크, 기타), 최종 사용자 업종(IT 및 통신, 헬스케어 및 생명과학, 기타),지역(북미, 아시아, 기타)별로 분류되어 있습니다. 시장 예측은 금액(달러) 기준으로 제시되어 있습니다.
세계 데이터 레이크 시장 동향 및 인사이트
GenAI 워크로드로 인한 비정형 데이터 및 멀티모달 데이터의 폭발적 증가
생성형 AI 용도는 방대한 양의 이미지, 음성, 텍스트 페이로드를 생성하며, 이를 위해서는 ‘스키마 온 리드(schema-on-read)’ 방식의 스토리지가 필요합니다. 기업들은 2025년까지 전 세계 데이터 총량 175제타바이트 중 30%가 실시간 처리를 필요로할 것으로 예측하고 있으며, 이는 고정형 데이터 웨어하우스에는 부적합한 특성입니다. 따라서 데이터 레이크는 프롬프트 엔지니어링 루프에서 사용되는 멀티모달 코퍼스의 기본 저장소가 되고 있습니다. Google Cloud의 ‘레이크하우스’ 블루프린트는 네이티브 형식 스토리지와 벡터 인덱스를 결합하여 기반 모델의 미세 조정을 가속화하는 동시에 스토리지 비용을 절감하는 방법을 제시합니다. 도입을 미루는 기업은 혁신 주기의 둔화나 AI 워크로드의 단위 비용 상승이라는 위험에 직면하게 됩니다.
유럽의 데이터 상주 요건이 클라우드 기반 레이크 도입을 가속화하고 있습니다.
EU의 ‘데이터 거버넌스법’ 및 ‘데이터법’은 조직에 기밀성이 높은 워크로드를 현지화하도록 의무화하고 있습니다. 각 하이퍼스케일러 기업들은 이에 대응하고 있으며, AWS는 데이터 위치 제어 기능이 내장된 소버린 클라우드 리전에 78억 유로를 투자하고 있습니다. 기업들은 현재 거주 요건을 충족하면서 페더레이티드 엔진을 통해 쿼리를 실행할 수 있는 리전별로 세분화된 데이터 레이크를 도입하고 있으며, 감사 보고서에서 국경을 초월한 데이터 이용 현황을 시각화할 수 있는 리니지 정보가 풍부한 메타데이터 카탈로그에 대한 수요가 높아지고 있습니다.
메타데이터의 드리프트가 ‘데이터 늪’을 만들어내고 있습니다.
데이터 수집량이 카탈로그 업데이트량을 초과하면, 데이터 레이크는 검색이 불가능한 저장소로 변질되고 맙니다. 2025년까지 전 세계 데이터 양은 163제타바이트에 달할 것으로 예측되며, 컨텍스트가 결여된 사일로화된 파일이 발생할 위험이 높아지고 있습니다. 이에 대응하여 기업들은 ‘Unity Catalog’와 같은 자동화된 리니지 추적기를 도입하고 있습니다. 이 도구는 모든 읽기 및 쓰기 작업을 로그에 기록하고, 고립된 자산에 플래그를 지정합니다. 이와 같은 통제 조치가 없다면, 거버넌스에 드는 오버헤드로 인해 레이크하우스 통합을 통해 기대했던 비용 절감 효과가 상쇄될 가능성이 있습니다.
부문 분석
솔루션 부문은 데이터 레이크 시장의 69.35%를 차지했으며, 해당 부문의 시장 규모는 129억 5,000만 달러에 달했습니다. 이러한 압도적인 점유율은 기업들이 AI 지원 환경의 기반이 되는 스토리지 엔진, 쿼리 가속기, 거버넌스 제품군을 표준화하고 있기 때문입니다. 각 벤더는 비용 최적화 대시보드, 자동 계층화, 네이티브 오픈테이블 지원을 묶어 제공함으로써 워크로드의 진화에 발맞추어 관련성을 유지하고 있습니다.
‘서비스’ 하위 부문은 2031년까지 연평균 성장률(CAGR) 24.77%로 급성장하고 있으며, 이는 마이그레이션 청사진, 성능 튜닝, 연중무휴 24시간 관리형 운영에 대한 수요를 반영합니다. 많은 기업은 레거시 Hadoop 환경의 플랫폼 마이그레이션을 수행할 수 있는 인력이 부족하기 때문에 예측 가능한 SLA 성과를 약속하는 전문 업체에 위탁하고 있습니다. 인력 시장의 부족으로 인해 전문 서비스 수주액은 데이터 레이크 시장 전체보다 빠른 속도로 계속 성장할 것으로 확실시됩니다.
조직이 즉각적인 확장성과 통합된 보안을 추구하는 가운데, 2025년에는 클라우드 배포가 데이터 레이크 시장의 64.20%를 차지했습니다. Amazon S3와 같은 탄력적인 오브젝트 스토리지는 자본 지출(CapEx)을 절감하는 동시에 콜드 데이터를 저비용 등급으로 자동 계층화하는 라이프사이클 자동화를 실현합니다. 그 후, 분석 엔진이 온디맨드로 가동되어 컴퓨팅 비용을 프로젝트 진행 속도에 맞추어 조정합니다.
하이브리드 및 멀티 클라우드 구성은 2031년까지 연평균 성장률(CAGR) 23.1%로 확대되고 있습니다. 오픈 테이블 형식을 통해 단일 메타데이터 정의로 On-Premise 및 퍼블릭 클라우드 버킷을 가로질러 접근할 수 있으므로, 복제 필요성이 대폭 감소합니다. 기업들이 규제 대상 워크로드를 주권 지역에 배치하면서도 크로스 클라우드 패브릭을 통해 쿼리를 실행하게 됨에 따라, 지역별 규정 준수 규제가 하이브리드 전략을 더욱 뒷받침하고 있습니다. 그 결과, 하이브리드 환경을 위한 데이터 레이크 시장 규모는 주권 클라우드의 출범과 발맞추어 확대되고 있습니다.
지역별 분석
북미는 2025년 매출의 37.40%를 차지하며, 아키텍처 성숙도 면에서 계속해서 기준을 제시하고 있습니다. 금융 기관은 진화하는 스트레스 테스트 템플릿에 대응하기 위해 시계열 데이터의 보존 기간을 연장하고 있는 반면, 병원 네트워크는 AI 기반 진단의 토대가 되는 다중 모달 환자 그래프를 구축하고 있습니다. 또한 벤처 캐피털도 거버넌스 관련 스타트업의 설립을 뒷받침하고 있어 활기찬 생태계가 조성되고 있습니다.
아시아태평양은 가장 빠르게 성장하는 지역으로, 2031년까지 연평균 성장률(CAGR)이 23.5%를 나타낼 것으로 전망됩니다. 일본, 인도, 싱가포르 정부는 소버린 클라우드 프로젝트를 지원하고 있으며, 이는 지역 규정을 준수하는 레이크존에 대한 수요를 촉진하고 있습니다. 중국의 통신 사업자들은 용량 계획을 위해 방대한 양의 5G 로그를 분석하고 있는 반면, 인도네시아의 핀테크 기업들은 사이버 범죄를 억제하기 위해 사기 감지 정보 레이크를 공유하고 있습니다. 일본의 Wasabi 등 APAC에 본사를 둔 벤더들은 예상되는 36%의 IaaS 수요 증가를 포착하는 것을 목표로 하고 있습니다.
유럽에서는 엄격한 데이터 주권 규제의 영향으로 클라우드 도입이 가속화되고 있습니다. ‘유럽 데이터 전략’이 현지 호스팅에 대한 투자를 촉진하고 있으며, AWS는 거주 요건을 충족하기 위해 2025년 말까지 브란덴부르크 리전을 개설할 예정입니다. 제조업체들은 CSRD 보고를 위해 실시간 Scope 3 배출량을 저장하고 있으며, 은행들은 감사에 대응 가능한 레이크 내에서 바젤 III 계산을 정교화하고 있습니다. 유럽은행감독청(EBA)의 2025년 스트레스 테스트 템플릿에서는 레이크하우스가 충족해야 할 기술 요건이 더욱 강화되었습니다.
기타 혜택:
- 엑셀 형식 시장 예측(ME) 시트
- 3개월간의 애널리스트 지원
자주 묻는 질문
목차
제1장 서론
제2장 조사 방법
제3장 주요 요약
제4장 시장 구도
제5장 시장 규모와 성장 예측
제6장 경쟁 구도
제7장 시장 기회와 향후 전망
LSH 26.09.03According to Mordor Intelligence, the data lakes market size is expected to grow from USD 18.68 billion in 2025 to USD 22.8 billion in 2026 and is forecast to reach USD 61.84 billion by 2031 at 22.08% CAGR over 2026-2031.
This report is Segmented by Offering (Solutions, and Services), Deployment (Cloud, and Hybrid/Multi-Cloud), Organization Size (Large Enterprises, and SMEs), Business Function (Operations and Supply-Chain, Finance and Risk, and More), End-User Vertical (IT and Telecom, Healthcare and Life Sciences, and More), and Geography (North America, Asia, and More). The Market Forecasts are Provided in Terms of Value (USD).
Global Data Lake Market Trends and Insights
Explosion of unstructured and multimodal data from GenAI workloads
Generative-AI applications create vast image, audio, and text payloads that demand schema-on-read storage. Enterprises expect 30% of the global 175 zettabyte data sphere to require real-time processing by 2025, a profile unsuited to rigid warehouses. Data lakes therefore become the default landing zone for multi-modal corpora used in prompt-engineering loops.Google Cloud's lakehouse blueprint shows how native-format storage paired with vector indexing accelerates foundation-model fine-tuning while lowering storage bills. Firms delaying adoption risk slower innovation cycles and higher unit-costs on AI workloads.
Data-residency mandates in Europe accelerating cloud-based lake adoption
The EU Data Governance Act and Data Act compel organizations to localize sensitive workloads. Hyperscalers are responding: AWS is investing EUR 7.8 billion in a sovereign-cloud region that ships with embedded data-location controls. Enterprises now deploy region-segmented data lakes that meet residency rules yet remain queryable through federated engines, sparking demand for lineage-rich metadata catalogs capable of surfacing cross-border data usage in audit reports.
Metadata drift creating "data swamps"
When ingestion outpaces catalog updates, data lakes devolve into unsearchable repositories. By 2025, global data volume will reach 163 zettabytes, heightening the risk of siloed files with missing context. Enterprises are responding by adopting automated lineage trackers such as Unity Catalog, which logs every read-write and flags orphaned assets. Without similar controls, governance overhead can erase savings projected from lakehouse consolidation.
Other drivers and restraints analyzed in the detailed report include:
- Lakehouse convergence delivering 35-40% TCO savings
- Serverless table formats unlocking multi-cloud portability
- Skilled lake-engineering talent shortfall in emerging regions
For complete list of drivers and restraints, kindly check the Table Of Contents.
Segment Analysis
Solutions generated 69.35% of data lakes market revenue in 2025, equating to a data lakes market size of USD 12.95 billion. The dominance comes from enterprises standardizing on storage engines, query accelerators, and governance suites that form the backbone of AI-ready environments. Vendors bundle cost-optimizer dashboards, automated tiering, and native open-table support, maintaining relevance as workloads evolve.
The services sub-segment is racing ahead at a 24.77% CAGR to 2031, reflecting demand for migration blueprints, performance tuning, and 24X7 managed operations. Many firms lack staff who can re-platform legacy Hadoop estates, so they contract specialists that promise predictable SLA outcomes. The tight talent market ensures professional-services bookings will keep growing faster than the overall data lakes market
Cloud deployments captured 64.20% of the data lakes market share in 2025 as organizations sought instant scalability and integrated security. Elastic object stores like Amazon S3 eliminate CapEx while delivering lifecycle automation that auto-tiers cold data to low-cost classes. Analytics engines then spin up on demand, keeping compute spend aligned with project tempo.
Hybrid and multi-cloud configurations are expanding at 23.1% CAGR to 2031. Open-table formats let one metadata definition span on-prem and public-cloud buckets, slashing replication needs. Regional compliance rules further fuel hybrid strategies, as firms pin regulated workloads in sovereign regions yet still query them through cross-cloud fabrics. As a result, the data lakes market size for hybrid environments is rising in lockstep with sovereign-cloud launches.
Complete Report Scope:
- By Offering
- Solutions
- Data Discovery and Cataloging
- Data Integration and ETL/ELT
- Analytics and Visualization Tools
- Governance and Security Platforms
- Services
- Professional Services (Consulting, Integration)
- Managed Services
- Solutions
- By Deployment
- Cloud
- Public Cloud
- Private Cloud
- Hybrid/Multi-Cloud
- On-Premise
- Cloud
- By Organization Size
- Large Enterprises
- Small and Mid-Size Enterprises (SMEs)
- By Business Function
- Operations and Supply-Chain
- Finance and Risk
- Sales and Marketing
- Human Resources
- By End-User Vertical
- IT and Telecom
- BFSI
- Healthcare and Life Sciences
- Retail and E-commerce
- Manufacturing and Industrial
- Media and Entertainment
- Government and Public Sector
- Energy and Utilities
- Others (Education, Hospitality)
- By Geography
- North America
- United States
- Canada
- Mexico
- South America
- Brazil
- Argentina
- Chile
- Peru
- Rest of South America
- Europe
- Germany
- United Kingdom
- France
- Italy
- Spain
- Rest of Europe
- Asia-Pacific
- China
- Japan
- India
- Australia
- New Zealand
- Rest of Asia-Pacific
- Middle East
- United Arab Emirates
- Saudi Arabia
- Turkey
- Rest of Middle East
- Africa
- South Africa
- Rest of Africa
- North America
Geography Analysis
North America generated 37.40% of 2025 revenue and continues to set benchmarks in architecture maturity. Financial institutions lengthen time-series retention to meet evolving stress-test templates, while hospital networks build multimodal patient graphs that underpin AI-driven diagnostics. Venture capital also fuels governance-start-up formation, ensuring a vibrant ecosystem.
Asia-Pacific is the fastest-expanding region, clocking a 23.5% CAGR through 2031. Governments in Japan, India, and Singapore sponsor sovereign-cloud projects, spurring demand for region-compliant lake zones. Telcos in China analyze massive 5G logs for capacity planning, whereas Indonesian fintechs share fraud-intelligence lakes to curb cybercrime. Vendors establishing APAC headquarters, such as Wasabi in Japan, aim to catch the projected 36% IaaS upturn.
Europe accelerates adoption under strict data-sovereignty mandates. The European Strategy for Data drives investment in local hosting, and AWS will open a Brandenburg region by late 2025 to satisfy residency rules. Manufacturers store real-time Scope-3 emissions for CSRD reporting, and banks refine Basel III calculations inside audit-ready lakes. The European Banking Authority's 2025 stress-test templates reinforce technical requirements that lakehouses fulfill.
- Amazon Web Services (AWS)
- Microsoft Corporation
- Google LLC
- IBM Corporation
- Oracle Corporation
- Snowflake Inc.
- SAP SE
- Cloudera Inc.
- Teradata Corporation
- Informatica Inc.
- Databricks Inc.
- Hitachi Vantara LLC
- Dell Technologies Inc.
- Atos SE
- SAS Institute Inc.
- Zaloni Inc.
- Dremio Corporation
- Qubole Inc.
- Talend SA
- HPE (Ezmeral)
Additional Benefits:
- The market estimate (ME) sheet in Excel format
- 3 months of analyst support
TABLE OF CONTENTS
1 Introduction
- 1.1 Study Assumptions and Market Definition
- 1.2 Scope of the Study
2 Research Methodology
3 Executive Summary
4 Market Landscape
- 4.1 Market Overview
- 4.2 Market Drivers
- 4.2.1 Explosion of Unstructured and Multimodal Data from GenAI Workloads
- 4.2.2 Data-Residency Mandates in Europe Accelerating Cloud-based Lake Adoption
- 4.2.3 Lakehouse Convergence Driving 35-40% TCO Savings for Fortune-500 Firms
- 4.2.4 Serverless Table Formats (Iceberg/Delta) Unlocking Multi-Cloud Portability
- 4.2.5 Real-Time ESG Scope-3 Data Capture Requirements in Industrial Sector
- 4.2.6 Regulatory Stress-Testing in Financial Services Demanding Decade-Scale Tick Data Retention
- 4.3 Market Restraints
- 4.3.1 Metadata Drift Creating "Data Swamps" and Raising Governance Cost
- 4.3.2 Skilled Lake Engineering Talent Shortfall in Emerging Regions
- 4.3.3 Latency-Sensitive Workloads Still Favoring Warehouses over Lakes
- 4.3.4 Opaque Consumption-Based Cloud Pricing Complicating Budget Forecasts
- 4.4 Technological Outlook
- 4.5 Porter's Five Forces
- 4.5.1 Bargaining Power of Suppliers
- 4.5.2 Bargaining Power of Buyers
- 4.5.3 Threat of New Entrants
- 4.5.4 Threat of Substitutes
- 4.5.5 Intensity of Competitive Rivalry
5 Market Size and Growth Forecasts (Value)
- 5.1 By Offering
- 5.1.1 Solutions
- 5.1.1.1 Data Discovery and Cataloging
- 5.1.1.2 Data Integration and ETL/ELT
- 5.1.1.3 Analytics and Visualization Tools
- 5.1.1.4 Governance and Security Platforms
- 5.1.2 Services
- 5.1.2.1 Professional Services (Consulting, Integration)
- 5.1.2.2 Managed Services
- 5.1.1 Solutions
- 5.2 By Deployment
- 5.2.1 Cloud
- 5.2.1.1 Public Cloud
- 5.2.1.2 Private Cloud
- 5.2.1.3 Hybrid/Multi-Cloud
- 5.2.2 On-Premise
- 5.2.1 Cloud
- 5.3 By Organization Size
- 5.3.1 Large Enterprises
- 5.3.2 Small and Mid-Size Enterprises (SMEs)
- 5.4 By Business Function
- 5.4.1 Operations and Supply-Chain
- 5.4.2 Finance and Risk
- 5.4.3 Sales and Marketing
- 5.4.4 Human Resources
- 5.5 By End-User Vertical
- 5.5.1 IT and Telecom
- 5.5.2 BFSI
- 5.5.3 Healthcare and Life Sciences
- 5.5.4 Retail and E-commerce
- 5.5.5 Manufacturing and Industrial
- 5.5.6 Media and Entertainment
- 5.5.7 Government and Public Sector
- 5.5.8 Energy and Utilities
- 5.5.9 Others (Education, Hospitality)
- 5.6 By Geography
- 5.6.1 North America
- 5.6.1.1 United States
- 5.6.1.2 Canada
- 5.6.1.3 Mexico
- 5.6.2 South America
- 5.6.2.1 Brazil
- 5.6.2.2 Argentina
- 5.6.2.3 Chile
- 5.6.2.4 Peru
- 5.6.2.5 Rest of South America
- 5.6.3 Europe
- 5.6.3.1 Germany
- 5.6.3.2 United Kingdom
- 5.6.3.3 France
- 5.6.3.4 Italy
- 5.6.3.5 Spain
- 5.6.3.6 Rest of Europe
- 5.6.4 Asia-Pacific
- 5.6.4.1 China
- 5.6.4.2 Japan
- 5.6.4.3 India
- 5.6.4.4 Australia
- 5.6.4.5 New Zealand
- 5.6.4.6 Rest of Asia-Pacific
- 5.6.5 Middle East
- 5.6.5.1 United Arab Emirates
- 5.6.5.2 Saudi Arabia
- 5.6.5.3 Turkey
- 5.6.5.4 Rest of Middle East
- 5.6.6 Africa
- 5.6.6.1 South Africa
- 5.6.6.2 Rest of Africa
- 5.6.1 North America
6 Competitive Landscape
- 6.1 Strategic Developments
- 6.2 Vendor Positioning Analysis
- 6.3 Company Profiles (includes Global level Overview, Market level overview, Core Segments, Financials as available, Strategic Information, Products and Services, and Recent Developments)
- 6.3.1 Amazon Web Services (AWS)
- 6.3.2 Microsoft Corporation
- 6.3.3 Google LLC
- 6.3.4 IBM Corporation
- 6.3.5 Oracle Corporation
- 6.3.6 Snowflake Inc.
- 6.3.7 SAP SE
- 6.3.8 Cloudera Inc.
- 6.3.9 Teradata Corporation
- 6.3.10 Informatica Inc.
- 6.3.11 Databricks Inc.
- 6.3.12 Hitachi Vantara LLC
- 6.3.13 Dell Technologies Inc.
- 6.3.14 Atos SE
- 6.3.15 SAS Institute Inc.
- 6.3.16 Zaloni Inc.
- 6.3.17 Dremio Corporation
- 6.3.18 Qubole Inc.
- 6.3.19 Talend SA
- 6.3.20 HPE (Ezmeral)
7 Market Opportunities and Future Outlook
- 7.1 White-space and Unmet-need Assessment


