|
시장보고서
상품코드
2122568
부유식 해상 풍력발전 : 시장 점유율 분석, 업계 동향 및 통계, 성장 예측(2026-2031년)Floating Offshore Wind Power - Market Share Analysis, Industry Trends & Statistics, Growth Forecasts (2026 - 2031) |
||||||
 Mordor Intelligence
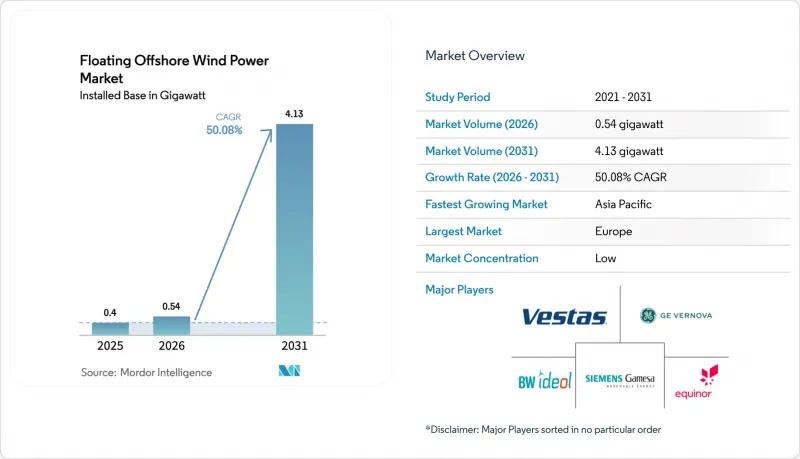
Mordor Intelligence에 의하면, 부유식 해상 풍력발전 시장 규모(설치용량 기반)는 2025년 0.4기가와트로 평가되었습니다. 2026년 0.54기가와트에서, 2031년까지 4.13기가와트로 확대되며 2026년부터 2031년까지 연평균 복합 성장률(CAGR)은 50.08%를 나타낼 전망입니다.

본 보고서는 수심(얕은 바다, 과도역, 심해), 부유식 플랫폼의 유형(반잠수식, 스파 부이 등), 터빈 출력(5MW 이하, 5-10MW, 11-15MW, 15MW 이상),적용 단계(상용화 전 시범 사업, 상용 유틸리티 규모, 하이브리드형 ‘Wind-to-X’), 지역(북미, 유럽, 아시아태평양, 남미, 중동 및 아프리카)에 따라 분류되어 있습니다.
세계의 부유식 해상 풍력발전 시장 동향 및 인사이트
미국 및 아시아태평양 지역 심해역에서의 임대권 부여 증가
2024년 미국 해양에너지관리국(BOEM)이 캘리포니아주 및 오리건주 연안에서 4.6GW 규모의 임대권을 부여함에 따라, 수심 1,200 m 및 지진 하중을 견딜 수 있는 계류 시스템에 대한 투자가 촉진되었습니다. 이에 이어 일본 경제산업성은 태풍에 견딜 수 있는 설계 및 40%의 현지 조달률을 의무화하는 2차 구역에서 1.8 GW의 임대권을 부여했습니다. 한국의 제8차 전력공급계획에서는 2030년까지 6기가와트의 부유식 발전 목표가 설정되어 있으며, 수심 150미터로 모노파일 채택이 불가능한 울산 및 제주로 자본이 유입되고 있습니다. 대만의 2026년 할당 계획에서는 부유식 프로젝트에 3기가와트가 배정되어 있으며, 텐션 레그 방식의 시범 프로젝트가 장려되고 있습니다. 임대권 부여로 인허가 절차의 위험은 완화되지만, 캘리포니아주에서는 모스 랜딩 및 디아블로 캐년 변전소 주변의 혼잡으로 인해 계통 연계 대기자 명단이 2029년까지 이어지고 있습니다.
15-20 MW급으로의 급속한 터빈 대형화가 LCOE를 낮춥니다.
지멘스 가메사의 15MW ‘SG 14-236 DD’ 및 베스타스의 ‘V236-15MW’ 터빈의 양산이 2025년에 시작되었으며, 두 모델 모두 1GW 규모 프로젝트의 기초 공사 비용을 거의 절반으로 줄이고, 발전소 부대설비(BOP) 비용을 1억 8,000만 달러 절감할 것입니다. GE 베르노바의 14MW ‘Haliade-X’ 변형 모델은 저풍속 환경에 최적화되어 있어, 뉴욕주 내 설치 가능한 임대 구역을 확대되고 있습니다. 밍양(MingYang)과 골드윈드(Goldwind)는 16MW 프로토타입을 개발하여 2피스 블레이드, 철도 운송 및 유지보수 주기 연장을 입증했습니다. 설치 메가와트당 설비 투자액은 2024년 420만 달러에서 2028년까지 310만 달러로 감소할 전망입니다.
WTIV 및 FIV 선박의 부족으로 인해 일당 비용이 45만 달러를 초과하는
2025년에는 15MW급 풍력 터빈을 설치할 수 있는 풍력 터빈 설치선(WTIV)이 고작 23척에 불과했지만, 2028년까지 47GW 규모의 프로젝트에서 설치 작업이 필요할 것으로 예측됩니다. 가동률이 95% 이상의 가운데, 용선료는 하루 48만 5,000달러까지 상승하여 캘리포니아주 모로베이의 풍력발전소 건설이 2년 연기되는 한편, 500MW 규모의 프로젝트에 소요되는 선박 비용은 8,700만 달러로 급증했습니다. 조선소에서는 2026-27년 인도를 목표로 14척의 신규 WTIV를 건조 중이지만, 2027년 이전공급 완화는 여전히 제한적입니다.
부문별 분석
2025년 전 세계 설치량의 54.1%는 수심 30-60m의 과도 수역이 차지했으며, 그 대부분은 북해 주변에 위치하고 있으며, 하이브리드 중력식 앵커를 통해 계류 비용이 절감되고 있습니다. 수심 60m를 초과하는 심해 부지는 연평균 성장률(CAGR) 58.2%의 속도로 확대되고 있으며, 캘리포니아, 일본, 노르웨이 연안의 막대한 기술적 잠재력을 발휘하게 될 것입니다. 심해 부문의 부유식 해상 풍력발전 시장 규모는 2031년까지 2,900 MW에 달할 것으로 예측됩니다. 캘리포니아주 모로베이 지역은 그 경제성을 여실히 보여주고 있습니다. 수심 1,000m에 대응하는 흡입 앵커를 채택하면 자본 비용은 1MW당 410만 달러로 치솟지만, 연안의 25GW에 달하는 풍력 자원에 대한 접근성이 그 비용 증가를 상쇄하고 있습니다. 일본 고토(Goto)의 임대 부지와 한국 울산의 부지도 수심에 따라 달라지는 이와 유사한 경제성을 뒷받침하고 있습니다.
수심 30m 미만의 얕은 해역에서는 실증 실험만 진행되었습니다. 유럽의 몇몇 시범 프로젝트에서는 더 가혹한 해역으로 규모를 확대하기 전에, 잔잔한 해역을 이용하여 플랫폼의 거동을 시험했습니다. 한편, 심해 지역에서의 도입은 Vryhof사의 STEVMANTA 흡입 앵커와 같은 계류 기술의 혁신에 의존하고 있으며, 이를 통해 앵커 수를 4개에서 3개로 줄이고 설치 시간을 25% 단축했습니다.
반잠수식 플랫폼은 모듈식 제조와 15-20 MW 터빈과의 호환성 덕분에 2025년 설비 용량의 55.8%를 차지했습니다. 프린시플 파워(Principle Power)사의 ‘WindFloat’ 플랫폼은 흘수 4m에 불과하여 부두에서 예인된 후, 설치 장소에서 밸러스트를 채워 고정할 수 있습니다. 스파르 부이는 아시아 조선소가 대량 생산형 강재 롤 성형을 채택하고, 태풍 시 거친 바다에서도 탁월한 피치 안정성을 발휘하고 있어 연평균 성장률(CAGR) 55.3%라는 가장 빠른 성장세를 보이고 있습니다. 따라서 2031년까지 부유식 해상 풍력발전 시장에서 스파울 부이의 점유율은 급격히 확대될 전망입니다.
텐션 레그 플랫폼은 12%라는 틈새 시장 점유율을 차지하고 있으며, 해저의 점토층이 견고하고 허브를 최소화할 수 있는 수직 테더 사용이 가능한 해역에서 채택되고 있습니다. BW Ideol사의 ‘Damping Pool’이나 Hexicon사의 ‘TwinWind duet’과 같은 하이브리드 바지선 구상은 계류 설비를 공유함으로써 앵커 비용 절감을 목표로 하고 있으나, 여전히 시범 단계에 머물러 있습니다.
지역별 분석
2025년, 유럽은 설치량의 53.6%를 차지했으며, 영국의 ScotWind 리스, 프랑스의 골프 뒤 리옹 입찰, 노르웨이의 석유 플랫폼 탈탄소화 계획에 힘입었습니다. 유럽의 부유식 해상 풍력발전 시장 규모는 2031년까지 2,000 MW를 넘어설 것으로 예측됩니다. 영국의 정책에서는 25%의 현지 조달률이 의무화되어 있어, 이에 따라 애버딘과 인버네스에서 항만 시설 개보수가 진행되고 있으며, 반잠수식 건조 수요가 유지되고 있습니다. 프랑스에서는 120유로/MWh로 체결된 15년간의 CfD(차액결제계약)와 지중해에서의 바지선 활용을 통해 예측 가능한 수익과 지역 조선소의 업무가 확보되고 있습니다. 스페인, 이탈리아, 북유럽 국가들도 이에 뒤이어 규모는 작지만 급속히 확대되고 있는 할당 계획을 추진하고 있으며, 여기에는 수산 양식 및 해수 담수화 시설과의 공동 활용이 포함되어 있습니다.
아시아태평양은 연평균 성장률(CAGR) 53.3%라는 가장 강력한 성장 궤도를 보이고 있습니다. 중국 광둥성과 푸젠성은 ‘제14차 5개년 계획’에 따라 5GW를 목표로 하고 있으며, MingYang사와 Goldwind사의 16MW 터빈을 도입하고 있습니다. 일본의 제2차 입찰(1.8 GW) 임대 계약에는 그린 암모니아 합성 의무화가 포함되어 있는 반면, 한국의 울산 수소도시에서는 500 MW 규모의 풍력발전 설비를 200 MW PEM 전기분해조에 연결하고 있습니다. 대만의 2026년 입찰에서는 국내 케이블 및 계류 설비 공급업체를 육성하기 위해 현지 조달률 60%를 조건으로 부유식 프로젝트를 위해 3GW를 확보하고 있습니다.
북미에서는 캘리포니아주와 오리건주 연안에서 4.6GW의 임대권을 확보했으나, 북태평양의 반고래와 관련하여 미국 환경보호청(ESA)과의 협의로 인해 허가 취득이 18개월 연기되었습니다. 개발 사업자는 현재 수동 음향 모니터링 및 계절적 작업 제한에 따른 비용을 부담하고 있으며, 첫 발전 개시는 2030년까지 미뤄질 전망입니다. 한편, 멕시코만에서의 플랫폼 용도 변경 프로젝트에서는 유휴 시추 장비와 기존 해저 인프라를 활용함으로써 설비 투자를 35% 절감하고 있습니다. 남미, 중동 및 아프리카은 여전히 발전의 초기 단계에 있습니다. 페트로브라스는 리우데자네이루 연안의 150 MW 기존 시설을 전용하는 방안을 검토 중이며, 아랍에미리트는 그린 수소 수출을 목적으로 아부다비 인근의 200 MW 프로젝트를 평가했습니다.
기타 혜택 :
- 엑셀 형식 시장 예측(ME) 시트
- 3개월간의 애널리스트 지원
자주 묻는 질문
목차
제1장 서론
제2장 조사 방법
제3장 주요 요약
제4장 시장 구도
제5장 시장 규모 및 성장 예측
제6장 경쟁 구도
제7장 시장 기회 및 향후 전망
KTH 26.09.08According to Mordor Intelligence, the floating offshore wind power market size in terms of installed base is projected to expand from 0.4 gigawatt in 2025 and 0.54 gigawatt in 2026 to 4.13 gigawatt by 2031, registering a CAGR of 50.08% between 2026 to 2031.
This report is Segmented by Water Depth (Shallow, Transitional, and Deep), Floating Platform Type (Semi-Submersible, Spar-Buoy, and More), Turbine Capacity (Up To 5 MW, 5 To 10 MW, 11 To 15 MW, and Above 15 MW), Application Stage (Pre-Commercial Pilot, Commercial Utility-Scale, and Hybrid Wind-To-X), and Geography (North America, Europe, Asia-Pacific, South America, and Middle East and Africa).
Global Floating Offshore Wind Power Market Trends and Insights
Growing Lease Awards in U.S. & APAC Deep-Water Zones
The Bureau of Ocean Energy Management's award of 4.6 GW of leases off California and Oregon in 2024 moved investment toward mooring systems able to withstand 1,200 m depths and seismic loads. Japan's Ministry of Economy, Trade and Industry followed with 1.8 GW of Round 2 zones that impose typhoon-resilient design and 40% local-content rules. South Korea's 8th power-supply plan sets a 6 GW floating target for 2030, steering capital to Ulsan and Jeju, where 150-m depths preclude monopiles. Taiwan's 2026 allocation earmarks 3 GW for floating projects, incentivizing tension-leg pilots. Lease awards de-risk permitting, yet California's interconnection queue stretches to 2029 because of congestion around Moss Landing and Diablo Canyon substations.
Rapid Turbine Upsizing to 15-20 MW Class Reducing LCOE
Serial production of Siemens Gamesa's 15 MW SG 14-236 DD and Vestas' V236-15 MW turbines began in 2025, each cutting foundation costs for 1 GW projects by nearly half and slicing balance-of-plant expenses by USD 180 million. GE Vernova's 14 MW Haliade-X variant optimized for low-wind regimes enlarges viable lease zones in New York State. MingYang and Goldwind achieved 16 MW prototypes, validating two-piece blades, rail transport, and extended service intervals. Capex per installed megawatt is tracking from USD 4.2 million in 2024 toward USD 3.1 million by 2028.
WTIV & FIV Vessel Shortage Driving Day Rates Above USD 450k
Only 23 wind-turbine installation vessels (WTIVs) can handle 15 MW machines in 2025, yet 47 GW of projects need lifting through 2028. As utilization exceeds 95%, charter prices rose to USD 485,000 per day, postponing California's Morro Bay array by two years and inflating a 500 MW project's vessel bill to USD 87 million. Shipyards are building 14 new WTIVs for 2026-27 delivery, but supply relief before 2027 remains limited.
Other drivers and restraints analyzed in the detailed report include:
- Oil & Gas Platform Conversions Unlocking Gulf of Mexico Supply Chain
- EU & UK CfD Reform Boosting Bankability
- High-Voltage Dynamic Cable Failures in 50-100 m Depth Pilots
For complete list of drivers and restraints, kindly check the Table Of Contents.
Segment Analysis
Transitional depths of 30-60 m represented 54.1% of global installations in 2025, largely around the North Sea, where hybrid gravity anchors lower mooring costs. Deep-water sites beyond 60 m are on pace for a 58.2% CAGR, unlocking the vast technical potential off California, Japan, and Norway. The Floating Offshore Wind Power market size for the Deep segment is projected to reach 2,900 MW by 2031. California's Morro Bay area highlights the economics: suction anchors rated for 1,000-m depths lift capital expense to USD 4.1 million per MW, yet access to 25 GW of wind resource offsets that premium. Japan's Goto leases and South Korea's Ulsan sites confirm similar depth-driven economics.
Shallow settings under 30 m captured only demonstration activity. Several European pilots used benign waters to test platform behavior before scaling to harsher seas. Meanwhile, Deep-water adoption relies on mooring innovation such as Vryhof's STEVMANTA suction anchor, which reduces anchor count from four to three and slashes installation time by 25%.
Semi-submersibles contributed 55.8% of 2025 capacity, thanks to modular fabrication and compatibility with 15-20 MW turbines. Principle Power's WindFloat platform can be towed out from quays with only a 4 m draft and then ballasted in place. Spar-buoys show the fastest ascent with a 55.3% CAGR as Asian yards employ high-volume steel roll-forming and demonstrate remarkable pitch stability in typhoon seas. The Floating Offshore Wind Power market share of Spar-buoys is therefore set to expand sharply through 2031.
Tension-leg platforms hold a niche 12% share, appearing where firm seabed clay enables vertical tethers that minimize heave. Hybrid barge ideas like BW Ideol's Damping Pool or Hexicon's TwinWind duet aim to trim anchor costs by sharing moorings but remain at pilot scale.
Complete Report Scope:
- By Water Depth
- Shallow (Up to 30 m)
- Transitional (30 to 60 m)
- Deep (Above 60 m)
- By Floating Platform Type
- Semi-Submersible
- Spar-Buoy
- Tension-Leg Platform (TLP)
- Barge & Hybrid Concepts
- By Turbine Capacity
- Up to 5 MW
- 5 to 10 MW
- 11 to 15 MW
- Above 15 MW
- By Application Stage
- Pre-Commercial Pilot
- Commercial Utility-Scale
- Hybrid Wind-to-X (Hydrogen, Desalination)
- By Geography
- North America
- United States
- Rest of North America
- Europe
- France
- United Kingdom
- Spain
- Nordic Countries
- Italy
- Rest of Europe
- Asia-Pacific
- China
- Japan
- South Korea
- Rest of Asia-Pacific
- South America
- Brazil
- Argentina
- Rest of South America
- Middle East and Africa
- United Arab Emirates
- Saudi Arabia
- South Africa
- Rest of Middle East and Africa
- North America
Geography Analysis
Europe maintained 53.6% of installations in 2025, supported by the United Kingdom's ScotWind leases, France's Golfe du Lion tender, and Norway's oil-platform decarbonization schemes. The Floating Offshore Wind Power market size in Europe is expected to pass 2,000 MW by 2031. United Kingdom policy mandates 25% local content, prompting port upgrades at Aberdeen and Inverness and sustaining semi-submersible fabrication. France's 15-year CfDs at EUR 120/MWh and Mediterranean barge deployments provide predictable revenue and regional yard work. Spain, Italy, and Nordic nations follow with smaller yet fast-moving allocations that embed aquaculture or desalination co-use.
Asia-Pacific shows the strongest growth trajectory with a 53.3% CAGR. China's Guangdong and Fujian provinces target 5 GW under the 14th Five-Year Plan, deploying MingYang and Goldwind 16 MW turbines. Japan's 1.8 GW Round 2 leases include mandatory green-ammonia synthesis, while South Korea's Ulsan Hydrogen City connects 500 MW of wind to 200 MW of PEM electrolyzers. Taiwan's 2026 round reserves 3 GW for floating projects with 60% local content to develop domestic cable and mooring suppliers.
North America secured 4.6 GW of leases off California and Oregon, but ESA consultations for the North Pacific right whale extend permitting by 18 months. Developers now fund passive-acoustic monitoring and seasonal work restrictions, pushing the first power to 2030. Meanwhile, Gulf of Mexico platform conversions tap idle rigs and established subsea infrastructure to curb capex by 35%. South America and the Middle East & Africa remain nascent. Petrobras studies a 150 MW conversion off Rio de Janeiro, and the United Arab Emirates assesses 200 MW near Abu Dhabi for green-hydrogen export.
- Siemens Gamesa Renewable Energy SA
- Vestas Wind Systems A/S
- GE Vernova (GE Renewable Energy)
- BW Ideol AS
- Equinor ASA
- Orsted A/S
- Principle Power Inc.
- Aker Solutions ASA
- Hexicon AB
- TotalEnergies SE
- Shell plc
- Ocean Winds (EDPR/ENGIE)
- Copenhagen Infrastructure Partners
- RWE AG
- Marubeni Corporation
- Doosan Enerbility Co., Ltd
- MingYang Smart Energy
- Goldwind Science & Technology
- Cobra IS (Grupo ACS)
- Gazelle Wind Power Ltd.
Additional Benefits:
- The market estimate (ME) sheet in Excel format
- 3 months of analyst support
TABLE OF CONTENTS
1 Introduction
- 1.1 Study Assumptions & Market Definition
- 1.2 Scope of the Study
2 Research Methodology
3 Executive Summary
4 Market Landscape
- 4.1 Market Overview
- 4.2 Market Drivers
- 4.2.1 Growing Lease Awards in U.S. & APAC Deep-Water Zones
- 4.2.2 Rapid Turbine Upsizing to 15-20 MW Class Reducing LCOE
- 4.2.3 Oil & Gas Platform Conversions Unlocking Gulf of Mexico Supply Chain
- 4.2.4 EU & UK CfD Reform Boosting Bankability
- 4.2.5 National Hydrogen Roadmaps Creating Co-location Demand
- 4.2.6 Asian Cable-Vessel Build-out Shortening Installation Schedules
- 4.3 Market Restraints
- 4.3.1 WTIV & FIV Vessel Shortage Driving Day-rates > US$450k
- 4.3.2 High-Voltage Dynamic Cable Failures in 50-100 m Depth Pilots
- 4.3.3 California ESA Right-Whale Constraints Slowing BOEM Permits
- 4.3.4 Spot Steel Price Volatility (> US$950/t) Disrupting Floater Yards
- 4.4 Supply-Chain Analysis
- 4.5 Regulatory Outlook
- 4.6 Technological Outlook
- 4.7 Key Projects Information
- 4.7.1 Major Existing Projects
- 4.7.2 Upcoming Projects
- 4.8 Porter's Five Forces
- 4.8.1 Bargaining Power of Suppliers
- 4.8.2 Bargaining Power of Buyers
- 4.8.3 Threat of New Entrants
- 4.8.4 Threat of Substitutes
- 4.8.5 Competitive Rivalry
- 4.9 Investment Analysis
5 Market Size & Growth Forecasts
- 5.1 By Water Depth
- 5.1.1 Shallow (Up to 30 m)
- 5.1.2 Transitional (30 to 60 m)
- 5.1.3 Deep (Above 60 m)
- 5.2 By Floating Platform Type
- 5.2.1 Semi-Submersible
- 5.2.2 Spar-Buoy
- 5.2.3 Tension-Leg Platform (TLP)
- 5.2.4 Barge & Hybrid Concepts
- 5.3 By Turbine Capacity
- 5.3.1 Up to 5 MW
- 5.3.2 5 to 10 MW
- 5.3.3 11 to 15 MW
- 5.3.4 Above 15 MW
- 5.4 By Application Stage
- 5.4.1 Pre-Commercial Pilot
- 5.4.2 Commercial Utility-Scale
- 5.4.3 Hybrid Wind-to-X (Hydrogen, Desalination)
- 5.5 By Geography
- 5.5.1 North America
- 5.5.1.1 United States
- 5.5.1.2 Rest of North America
- 5.5.2 Europe
- 5.5.2.1 France
- 5.5.2.2 United Kingdom
- 5.5.2.3 Spain
- 5.5.2.4 Nordic Countries
- 5.5.2.5 Italy
- 5.5.2.6 Rest of Europe
- 5.5.3 Asia-Pacific
- 5.5.3.1 China
- 5.5.3.2 Japan
- 5.5.3.3 South Korea
- 5.5.3.4 Rest of Asia-Pacific
- 5.5.4 South America
- 5.5.4.1 Brazil
- 5.5.4.2 Argentina
- 5.5.4.3 Rest of South America
- 5.5.5 Middle East and Africa
- 5.5.5.1 United Arab Emirates
- 5.5.5.2 Saudi Arabia
- 5.5.5.3 South Africa
- 5.5.5.4 Rest of Middle East and Africa
- 5.5.1 North America
6 Competitive Landscape
- 6.1 Market Concentration
- 6.2 Strategic Moves (M&A, Partnerships, PPAs)
- 6.3 Market Share Analysis (Market Rank/Share for key companies)
- 6.4 Company Profiles (includes Global level Overview, Market level overview, Core Segments, Financials as available, Strategic Information, Products & Services, and Recent Developments)
- 6.4.1 Siemens Gamesa Renewable Energy SA
- 6.4.2 Vestas Wind Systems A/S
- 6.4.3 GE Vernova (GE Renewable Energy)
- 6.4.4 BW Ideol AS
- 6.4.5 Equinor ASA
- 6.4.6 Orsted A/S
- 6.4.7 Principle Power Inc.
- 6.4.8 Aker Solutions ASA
- 6.4.9 Hexicon AB
- 6.4.10 TotalEnergies SE
- 6.4.11 Shell plc
- 6.4.12 Ocean Winds (EDPR/ENGIE)
- 6.4.13 Copenhagen Infrastructure Partners
- 6.4.14 RWE AG
- 6.4.15 Marubeni Corporation
- 6.4.16 Doosan Enerbility Co., Ltd
- 6.4.17 MingYang Smart Energy
- 6.4.18 Goldwind Science & Technology
- 6.4.19 Cobra IS (Grupo ACS)
- 6.4.20 Gazelle Wind Power Ltd.
7 Market Opportunities & Future Outlook
- 7.1 White-space & Unmet-Need Assessment